 Explore
 Validate
 Learn
Learn Western blot
Antibody data
- Antibody Data
- Antigen structure
- References [20]
- Comments [0]
- Validations
- Western blot [5]
- Immunocytochemistry [4]
- Immunohistochemistry [1]
- Other assay [12]
Submit
Validation data
Reference
Comment
Report error
- Product number
- PA5-19468 - Provider product page

- Provider
- Invitrogen Antibodies
- Product name
- Lamin B1 Polyclonal Antibody
- Antibody type
- Polyclonal
- Antigen
- Synthetic peptide
- Description
- Heat mediated antigen retrieval recommended prior to tissue staining.
- Concentration
- 1 mg/mL
Submitted references RNA 5-methylcytosine status is associated with DNMT2/TRDMT1 nuclear localization in osteosarcoma cell lines.
The ubiquitin-dependent ATPase p97 removes cytotoxic trapped PARP1 from chromatin.
p97/VCP inhibition causes excessive MRE11-dependent DNA end resection promoting cell killing after ionizing radiation.
Identification of a Stable, Non-Canonically Regulated Nrf2 Form in Lung Cancer Cells.
The Status of Bile Acids and Farnesoid X Receptor in Brain and Liver of Rats with Thioacetamide-Induced Acute Liver Failure.
TRPV4 channels are essential for alveolar epithelial barrier function as protection from lung edema.
Chemical genetics strategy to profile kinase target engagement reveals role of FES in neutrophil phagocytosis.
MCM8IP activates the MCM8-9 helicase to promote DNA synthesis and homologous recombination upon DNA damage.
Kaempferol Inhibits Zearalenone-Induced Oxidative Stress and Apoptosis via the PI3K/Akt-Mediated Nrf2 Signaling Pathway: In Vitro and In Vivo Studies.
Store-operated Ca(2+) entry in primary murine lung fibroblasts is independent of classical transient receptor potential (TRPC) channels and contributes to cell migration.
Chromatin compartment dynamics in a haploinsufficient model of cardiac laminopathy.
Nuclear shape, protrusive behaviour and in vivo retention of human bone marrow mesenchymal stromal cells is controlled by Lamin-A/C expression.
Dp71 Expression in Human Glioblastoma.
Restoration of Replication Fork Stability in BRCA1- and BRCA2-Deficient Cells by Inactivation of SNF2-Family Fork Remodelers.
ETV4 collaborates with Wnt/β-catenin signaling to alter cell cycle activity and promote tumor aggressiveness in gastrointestinal stromal tumor.
Metalloprotease SPRTN/DVC1 Orchestrates Replication-Coupled DNA-Protein Crosslink Repair.
Farnesoid X receptor-dependent and -independent pathways mediate the transcriptional control of human fibroblast growth factor 19 by vitamin A.
Curcumin induces oxidation-dependent cell cycle arrest mediated by SIRT7 inhibition of rDNA transcription in human aortic smooth muscle cells.
A novel role for histone deacetylase 6 in the regulation of the tolerogenic STAT3/IL-10 pathway in APCs.
Acute pulmonary dose-responses to inhaled multi-walled carbon nanotubes.
Betlej G, Ząbek T, Lewińska A, Błoniarz D, Rzeszutek I, Wnuk M
Journal of bone oncology 2022 Oct;36:100448
Journal of bone oncology 2022 Oct;36:100448
The ubiquitin-dependent ATPase p97 removes cytotoxic trapped PARP1 from chromatin.
Krastev DB, Li S, Sun Y, Wicks AJ, Hoslett G, Weekes D, Badder LM, Knight EG, Marlow R, Pardo MC, Yu L, Talele TT, Bartek J, Choudhary JS, Pommier Y, Pettitt SJ, Tutt ANJ, Ramadan K, Lord CJ
Nature cell biology 2022 Jan;24(1):62-73
Nature cell biology 2022 Jan;24(1):62-73
p97/VCP inhibition causes excessive MRE11-dependent DNA end resection promoting cell killing after ionizing radiation.
Kilgas S, Singh AN, Paillas S, Then CK, Torrecilla I, Nicholson J, Browning L, Vendrell I, Konietzny R, Kessler BM, Kiltie AE, Ramadan K
Cell reports 2021 May 25;35(8):109153
Cell reports 2021 May 25;35(8):109153
Identification of a Stable, Non-Canonically Regulated Nrf2 Form in Lung Cancer Cells.
Mikac S, Rychłowski M, Dziadosz A, Szabelska-Beresewicz A, Fahraeus R, Hupp T, Sznarkowska A
Antioxidants (Basel, Switzerland) 2021 May 15;10(5)
Antioxidants (Basel, Switzerland) 2021 May 15;10(5)
The Status of Bile Acids and Farnesoid X Receptor in Brain and Liver of Rats with Thioacetamide-Induced Acute Liver Failure.
Czarnecka AM, Milewski K, Albrecht J, Zielińska M
International journal of molecular sciences 2020 Oct 20;21(20)
International journal of molecular sciences 2020 Oct 20;21(20)
TRPV4 channels are essential for alveolar epithelial barrier function as protection from lung edema.
Weber J, Rajan S, Schremmer C, Chao YK, Krasteva-Christ G, Kannler M, Yildirim AÖ, Brosien M, Schredelseker J, Weissmann N, Grimm C, Gudermann T, Dietrich A
JCI insight 2020 Oct 15;5(20)
JCI insight 2020 Oct 15;5(20)
Chemical genetics strategy to profile kinase target engagement reveals role of FES in neutrophil phagocytosis.
van der Wel T, Hilhorst R, den Dulk H, van den Hooven T, Prins NM, Wijnakker JAPM, Florea BI, Lenselink EB, van Westen GJP, Ruijtenbeek R, Overkleeft HS, Kaptein A, Barf T, van der Stelt M
Nature communications 2020 Jun 25;11(1):3216
Nature communications 2020 Jun 25;11(1):3216
MCM8IP activates the MCM8-9 helicase to promote DNA synthesis and homologous recombination upon DNA damage.
Huang JW, Acharya A, Taglialatela A, Nambiar TS, Cuella-Martin R, Leuzzi G, Hayward SB, Joseph SA, Brunette GJ, Anand R, Soni RK, Clark NL, Bernstein KA, Cejka P, Ciccia A
Nature communications 2020 Jun 11;11(1):2948
Nature communications 2020 Jun 11;11(1):2948
Kaempferol Inhibits Zearalenone-Induced Oxidative Stress and Apoptosis via the PI3K/Akt-Mediated Nrf2 Signaling Pathway: In Vitro and In Vivo Studies.
Rajendran P, Ammar RB, Al-Saeedi FJ, Mohamed ME, ElNaggar MA, Al-Ramadan SY, Bekhet GM, Soliman AM
International journal of molecular sciences 2020 Dec 28;22(1)
International journal of molecular sciences 2020 Dec 28;22(1)
Store-operated Ca(2+) entry in primary murine lung fibroblasts is independent of classical transient receptor potential (TRPC) channels and contributes to cell migration.
Bendiks L, Geiger F, Gudermann T, Feske S, Dietrich A
Scientific reports 2020 Apr 22;10(1):6812
Scientific reports 2020 Apr 22;10(1):6812
Chromatin compartment dynamics in a haploinsufficient model of cardiac laminopathy.
Bertero A, Fields PA, Smith AST, Leonard A, Beussman K, Sniadecki NJ, Kim DH, Tse HF, Pabon L, Shendure J, Noble WS, Murry CE
The Journal of cell biology 2019 Sep 2;218(9):2919-2944
The Journal of cell biology 2019 Sep 2;218(9):2919-2944
Nuclear shape, protrusive behaviour and in vivo retention of human bone marrow mesenchymal stromal cells is controlled by Lamin-A/C expression.
Dorland YL, Cornelissen AS, Kuijk C, Tol S, Hoogenboezem M, van Buul JD, Nolte MA, Voermans C, Huveneers S
Scientific reports 2019 Oct 7;9(1):14401
Scientific reports 2019 Oct 7;9(1):14401
Dp71 Expression in Human Glioblastoma.
Ruggieri S, De Giorgis M, Annese T, Tamma R, Notarangelo A, Marzullo A, Senetta R, Cassoni P, Notarangelo M, Ribatti D, Nico B
International journal of molecular sciences 2019 Oct 31;20(21)
International journal of molecular sciences 2019 Oct 31;20(21)
Restoration of Replication Fork Stability in BRCA1- and BRCA2-Deficient Cells by Inactivation of SNF2-Family Fork Remodelers.
Taglialatela A, Alvarez S, Leuzzi G, Sannino V, Ranjha L, Huang JW, Madubata C, Anand R, Levy B, Rabadan R, Cejka P, Costanzo V, Ciccia A
Molecular cell 2017 Oct 19;68(2):414-430.e8
Molecular cell 2017 Oct 19;68(2):414-430.e8
ETV4 collaborates with Wnt/β-catenin signaling to alter cell cycle activity and promote tumor aggressiveness in gastrointestinal stromal tumor.
Zeng S, Seifert AM, Zhang JQ, Kim TS, Bowler TG, Cavnar MJ, Medina BD, Vitiello GA, Rossi F, Loo JK, Param NJ, DeMatteo RP
Oncotarget 2017 Dec 26;8(69):114195-114209
Oncotarget 2017 Dec 26;8(69):114195-114209
Metalloprotease SPRTN/DVC1 Orchestrates Replication-Coupled DNA-Protein Crosslink Repair.
Vaz B, Popovic M, Newman JA, Fielden J, Aitkenhead H, Halder S, Singh AN, Vendrell I, Fischer R, Torrecilla I, Drobnitzky N, Freire R, Amor DJ, Lockhart PJ, Kessler BM, McKenna GW, Gileadi O, Ramadan K
Molecular cell 2016 Nov 17;64(4):704-719
Molecular cell 2016 Nov 17;64(4):704-719
Farnesoid X receptor-dependent and -independent pathways mediate the transcriptional control of human fibroblast growth factor 19 by vitamin A.
Jahn D, Sutor D, Dorbath D, Weiß J, Götze O, Schmitt J, Hermanns HM, Geier A
Biochimica et biophysica acta 2016 Feb;1859(2):381-92
Biochimica et biophysica acta 2016 Feb;1859(2):381-92
Curcumin induces oxidation-dependent cell cycle arrest mediated by SIRT7 inhibition of rDNA transcription in human aortic smooth muscle cells.
Lewinska A, Wnuk M, Grabowska W, Zabek T, Semik E, Sikora E, Bielak-Zmijewska A
Toxicology letters 2015 Mar 18;233(3):227-38
Toxicology letters 2015 Mar 18;233(3):227-38
A novel role for histone deacetylase 6 in the regulation of the tolerogenic STAT3/IL-10 pathway in APCs.
Cheng F, Lienlaf M, Wang HW, Perez-Villarroel P, Lee C, Woan K, Rock-Klotz J, Sahakian E, Woods D, Pinilla-Ibarz J, Kalin J, Tao J, Hancock W, Kozikowski A, Seto E, Villagra A, Sotomayor EM
Journal of immunology (Baltimore, Md. : 1950) 2014 Sep 15;193(6):2850-62
Journal of immunology (Baltimore, Md. : 1950) 2014 Sep 15;193(6):2850-62
Acute pulmonary dose-responses to inhaled multi-walled carbon nanotubes.
Porter DW, Hubbs AF, Chen BT, McKinney W, Mercer RR, Wolfarth MG, Battelli L, Wu N, Sriram K, Leonard S, Andrew M, Willard P, Tsuruoka S, Endo M, Tsukada T, Munekane F, Frazer DG, Castranova V
Nanotoxicology 2013 Nov;7(7):1179-94
Nanotoxicology 2013 Nov;7(7):1179-94
No comments: Submit comment
Supportive validation
- Submitted by
- Invitrogen Antibodies (provider)
- Main image

- Experimental details
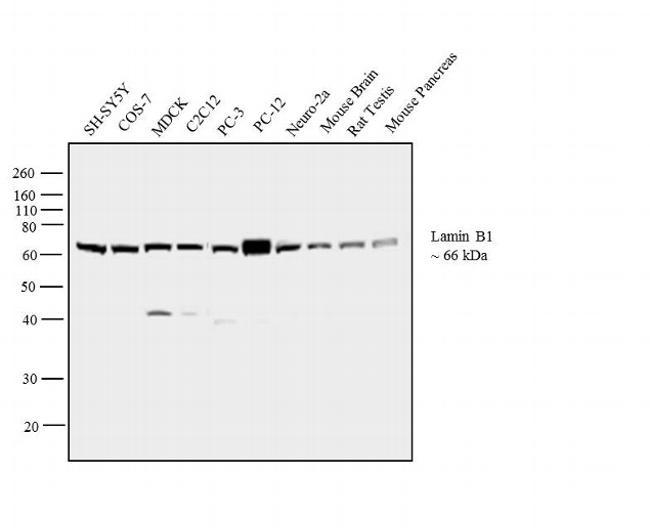
- Western blot analysis was performed on whole cell extracts (30 µg lysate) of SH-SY5Y (Lane 1), COS-7 (Lane 2), MDCK (Lane 3), C2C12 (Lane 4), PC-3 (Lane 5), PC-12 (Lane 6), Neuro-2a (Lane 7), tissue extracts of Mouse Brain (Lane 8), Rat Testis (Lane 9) and Mouse Pancreas (Lane 10). The blot was probed with Anti-Lamin B1 Rabbit Polyclonal Antibody (Product # PA5-19468, 0.5 µg/mL) and detected by chemiluminescence using Goat anti-Rabbit IgG (H+L) Superclonal™ Secondary Antibody, HRP conjugate (Product # A27036, 0.25 µg/mL, 1:4000 dilution). A 66 kDa band corresponding to Lamin B1 was observed across the cell lines and tissues tested. Known quantity of protein samples were electrophoresed using Novex® NuPAGE® 4-12 % Bis-Tris gel (Product # NP0322BOX), XCell SureLock™ Electrophoresis System (Product # EI0002) and Novex® Sharp Pre-Stained Protein Standard (Product # LC5800). Resolved proteins were then transferred onto a nitrocellulose membrane with iBlot® 2 Dry Blotting System (Product # IB21001). The membrane was probed with the relevant primary and secondary Antibody following blocking with 5 % skimmed milk. Chemiluminescent detection was performed using Pierce™ ECL Western Blotting Substrate (Product # 32106).
- Submitted by
- Invitrogen Antibodies (provider)
- Main image
- Experimental details
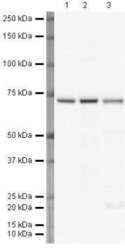
- Western blot analysis of HeLa Whole Cell Lysate using Product # PA5-19468, Lamin B1 primary antibody at a dilution of 1 µg/mL (lane 1). Staining of Jurkat Whole Cell Lysate at a dilution of 1 µg/mL (Lane 2). Staining of A431 Whole Cell Lysate at a dilution of 1 µg/mL (lane 3). Blot treated with a secondary HRP-conjugated Goat polyclonal anti-Rabbit antibody was used at a dilution of 1:3000.

- Submitted by
- Invitrogen Antibodies (provider)
- Main image

- Experimental details
- Western blot analysis was performed on whole cell extracts (30 µg lysate) of SH-SY5Y (Lane 1), COS-7 (Lane 2), MDCK (Lane 3), C2C12 (Lane 4), PC-3 (Lane 5), PC-12 (Lane 6), Neuro-2a (Lane 7), tissue extracts of Mouse Brain (Lane 8), Rat Testis (Lane 9) and Mouse Pancreas (Lane 10). The blot was probed with Anti-Lamin B1 Rabbit Polyclonal Antibody (Product # PA5-19468, 0.5 µg/mL) and detected by chemiluminescence using Goat anti-Rabbit IgG (H+L) Superclonal™ Secondary Antibody, HRP conjugate (Product # A27036, 0.25 µg/mL, 1:4000 dilution). A 66 kDa band corresponding to Lamin B1 was observed across the cell lines and tissues tested. Known quantity of protein samples were electrophoresed using Novex® NuPAGE® 4-12 % Bis-Tris gel (Product # NP0322BOX), XCell SureLock™ Electrophoresis System (Product # EI0002) and Novex® Sharp Pre-Stained Protein Standard (Product # LC5800). Resolved proteins were then transferred onto a nitrocellulose membrane with iBlot® 2 Dry Blotting System (Product # IB21001). The membrane was probed with the relevant primary and secondary Antibody following blocking with 5 % skimmed milk. Chemiluminescent detection was performed using Pierce™ ECL Western Blotting Substrate (Product # 32106).

- Submitted by
- Invitrogen Antibodies (provider)
- Main image
- Experimental details
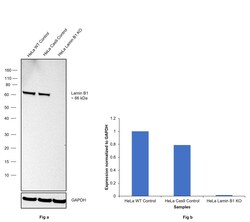
- Knockout of Lamin B1 was achieved by CRISPR-Cas9 genome editing using LentiArray™ Lentiviral sgRNA (Product # A32042, Assay ID CRISPR711025_LV) and LentiArray Cas9 Lentivirus (Product # A32064). Western blot analysis of Lamin B1 was performed by loading 30 µg of HeLa wild type (Lane 1), HeLa Cas9 (Lane 2) andHeLa Lamin B1 KO (Lane 3) membrane enriched extracts. The samples were electrophoresed using NuPAGE™ Novex™ 4-12% Bis-Tris Protein Gel (Product # NP0322BOX). Resolved proteins were then transferred onto a nitrocellulose membrane (Product # IB23001) by iBlot® 2 Dry Blotting System (Product # IB21001). The blot was probed with Anti-Lamin B1 Polyclonal Antibody (Product # PA5-19468, 1:1000 dilution) and Goat anti-Rabbit IgG (H+L) Superclonal™ Recombinant Secondary Antibody, HRP (Product # A27036, 1:5000 dilution) using the iBright FL 1000 (Product # A32752). Chemiluminescent detection was performed using Novex® ECL Chemiluminescent Substrate Reagent Kit (Product # WP20005). Loss of signal upon CRISPR mediated knockout (KO) using the LentiArray™ CRISPR product line confirms that antibody is specific to Lamin B1.

- Submitted by
- Invitrogen Antibodies (provider)
- Main image
- Experimental details
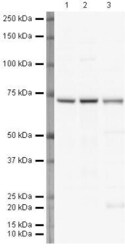
- Western blot analysis of HeLa Whole Cell Lysate using Product # PA5-19468, Lamin B1 primary antibody at a dilution of 1 µg/mL (lane 1). Staining of Jurkat Whole Cell Lysate at a dilution of 1 µg/mL (Lane 2). Staining of A431 Whole Cell Lysate at a dilution of 1 µg/mL (lane 3). Blot treated with a secondary HRP-conjugated Goat polyclonal anti-Rabbit antibody was used at a dilution of 1:3000.

Supportive validation
- Submitted by
- Invitrogen Antibodies (provider)
- Main image
- Experimental details
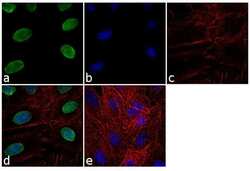
- Immunofluorescence analysis of Lamin B1 was performed using 70% confluent log phase A549 cells. The cells were fixed with 4% paraformaldehyde for 10 minutes, permeabilized with 0.1% Triton™ X-100 for 10 minutes, and blocked with 1% BSA for 1 hour at room temperature. The cells were labeled with Lamin B1 Rabbit Polyclonal Antibody (Product # PA5-19468) at 2 µg/mL in 0.1% BSA and incubated for 3 hours at room temperature and then labeled with Goat anti-Rabbit IgG (H+L) Superclonal™ Secondary Antibody, Alexa Fluor® 488 conjugate (Product # A27034) at a dilution of 1:2000 for 45 minutes at room temperature (Panel a: green). Nuclei (Panel b: blue) were stained with SlowFade® Gold Antifade Mountant with DAPI (Product # S36938). F-actin (Panel c: red) was stained with Rhodamine Phalloidin (Product # R415, 1:300). Panel d represents the merged image showing nuclear localization. Panel e shows the no primary antibody control. The images were captured at 60X magnification.

- Submitted by
- Invitrogen Antibodies (provider)
- Main image

- Experimental details
- Immunofluorescence analysis of Lamin B1 was performed using 70% confluent log phase NIH/3T3 cells. The cells were fixed with 4% paraformaldehyde for 10 minutes, permeabilized with 0.1% Triton™ X-100 for 10 minutes, and blocked with 1% BSA for 1 hour at room temperature. The cells were labeled with Lamin B1 Rabbit Polyclonal Antibody (Product # PA5-19468) at 2 µg/mL in 0.1% BSA and incubated for 3 hours at room temperature and then labeled with Goat anti-Rabbit IgG (H+L) Superclonal™ Secondary Antibody, Alexa Fluor® 488 conjugate (Product # A27034) at a dilution of 1:2000 for 45 minutes at room temperature (Panel a: green). Nuclei (Panel b: blue) were stained with SlowFade® Gold Antifade Mountant with DAPI (Product # S36938). F-actin (Panel c: red) was stained with Rhodamine Phalloidin (Product # R415, 1:300). Panel d represents the merged image showing nuclear localization. Panel e shows the no primary antibody control. The images were captured at 60X magnification.

- Submitted by
- Invitrogen Antibodies (provider)
- Main image

- Experimental details
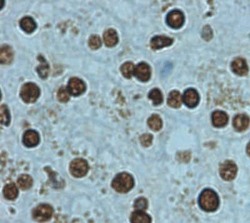
- Immunocytochemistry analysis of Lamin B1 in U2OS cells. Formalin fixed cells were permeabilized with 0.1% Triton X-100 (Product # 28314) in PBS for 30 minutes at room temperature and blocked with Universal Blocker (from Product # 03-6000) for 30 minutes at room temperature. Cells were probed with a Lamin B1 polyclonal antibody (Product # PA5-19468) at a dilution of 1:100 for at least 1 hour at room temperature, washed with PBST, and incubated with an alkaline phosphatase-conjugated goat anti-rabbit IgG (H+L) secondary antibody (Product # 31346) at a dilution of 1:250 for 30 minutes at room temperature. Chromogenic detection was performed using 1-Step NBT/BCIP (Product # 34042). Images were taken on a Zeiss Axio Observer microscope at 20X magnification (x1.6 Optovar ~ 32X).

- Submitted by
- Invitrogen Antibodies (provider)
- Main image

- Experimental details
- Immunocytochemistry analysis of Lamin B1 in U2OS cells. Cells fixed with 4% paraformaldehyde were permeabilized with 0.1% Triton X-100 (Product # 28314) in PBS for 15 minutes at room temperature and blocked with 2% BSA in PBST (from Product # 37525) for 30 minutes at room temperature. Cells were treated with Peroxidase Suppressor (Product # 35000), probed with a Lamin B1 polyclonal antibody (Product # PA5-19468) at a dilution of 1:100 for at least 1 hour at room temperature, washed with PBST, and incubated with an HRP-conjugated goat anti-rabbit IgG (H+L) secondary antibody (Product # 31466) at a dilution of 1:1000 for 30 minutes at room temperature. Chromogenic detection was performed using Metal Enhanced DAB Substrate Kit (Product # 34065). Images were taken on a Zeiss Axio Observer microscope at 20X magnification (x1.6 Optovar ~ 32X).

Supportive validation
- Submitted by
- Invitrogen Antibodies (provider)
- Main image
- Experimental details
- Immunohistochemical (formalin-fixed, paraffin-embedded) staining of Human Liver tissue using Product # PA5-19468, anti-Lamin B1 antibody. Primary antibody was used at a concentration of 1 µg/mL and exposed for 8 mins at room temp. The sample was pretreated using heat mediated antigen retrieval with Sodium Citrate Buffer (pH6/20mins). The detection method was a HRP conjugated polymer, DAB chromogen and the sample was counterstained with haematoxylin and mounted with DPX.

Supportive validation
- Submitted by
- Invitrogen Antibodies (provider)
- Main image

- Experimental details
- NULL

- Submitted by
- Invitrogen Antibodies (provider)
- Main image

- Experimental details
- NULL

- Submitted by
- Invitrogen Antibodies (provider)
- Main image

- Experimental details
- Fig. 2 Characterization of the interaction between MCM8IP and RPA1. a Detection by western blot of RPA1 and RPA2 co-precipitated by bead-bound recombinant GST, GST-SMARCAL1, or GST-MCM8IP from bacteria. b Schematic representation of full-length MCM8IP and MCM8IP with deletions in RPA1 binding motifs. The Delta1-54,153-168 mutant was renamed RBM. Shown in red is a region with homology to proline-rich protein 18 (PRR18). The DUF4539 domain, a predicted OB-fold, is shown in green. c Detection by western blot of RPA1 co-precipitated by bead-bound GST, GST-MCM8IP WT, or GST fused to the MCM8IP mutants presented in ( b ). d Detection by western blot of RPA1 and RPA2 co-immunoprecipitated by HA-GFP, HA-MCM8IP WT, or RBM from HEK293T cells. e Representative images of the recruitment of MCM8IP-FLAG WT or RBM to sites of UV laser microirradiation in U2OS cells. DNA damage tracts are indicated with gammaH2AX staining. Scale bar = 20 um. f Detection by western blot of MCM8IP-FLAG (short exposure, s.e. ; long exposure, l.e.) and RPA2 following subcellular fractionation of lysates from HCT116 MCM8IP KO cells reconstituted with MCM8IP-FLAG WT or RBM. Cells were treated with 10 uM cisplatin for 24 h or left untreated prior to lysis. Vinculin and Lamin B1 are shown as loading and fractionation controls.

- Submitted by
- Invitrogen Antibodies (provider)
- Main image

- Experimental details
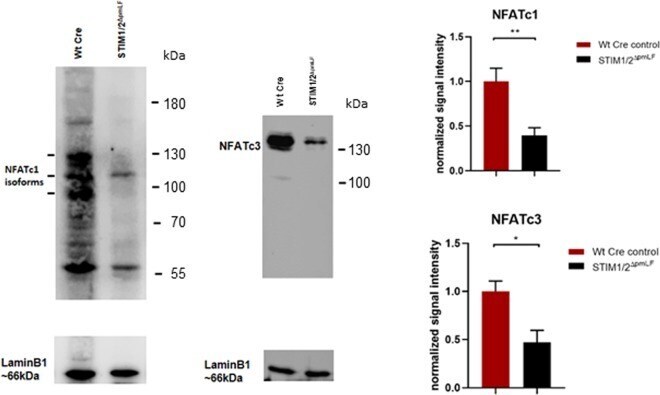
- Figure 7 Quantification of nuclear NFATc levels in STIM1/2- deficient pmLF (STIM1/2 DeltapmLF ) and wild-type cells infected with recombinant lentiviruses expressing Cre recombinase as control cells (Wt Cre). Representative Western Blots showing NFATc1 (left panel) and NFATc3 (right panel) isoforms in nuclear extracts from STIM1/2 DeltapmLF and Wt Cre cells. Summary of quantitative analysis of nuclear NFAT levels of the c1 (upper bar graph) and c3 (lower bar graph) isoforms. Columns show calculated means +/- SEM. Asterisks mark significant differences (n > 3 mice, *P < 0.05, **P < 0.001) between ratios of STIM1/2 DeltapmLF cells compared to Wt Cre control cells.
- Submitted by
- Invitrogen Antibodies (provider)
- Main image

- Experimental details
- Characterization of the lamin A/C and lamin B1 levels in U-2 OS, SaOS-2 and MG-63 cells (A) and prediction of the post-translational modifications of DNMT2/TRDMT1 (B, C). (A) Changes in the levels of lamin A/C (left) and lamin B1 (right). Lamin A/C and lamin B1 signals were analyzed using immunofluorescence and imaging flow cytometry. Representative histograms are shown (top). The blue histograms indicate lamin A/C and lamin B1 levels in U-2 OS, green histograms indicate lamin A/C and lamin B1 levels in SaOS-2 cells, while red histograms indicate lamin A/C and lamin B1 levels in MG-63 cells. Representative microphotographs are also shown (bottom). BF- bright field, SSC- side scatter. (B) Protein plot generated by the Scansite program showing the full length of DNMT2/TRDMT1 protein and the predicted phosphorylation sites. (C) Table generated by Scansite program showing predicted site and sequence of DNMT2/TRDMT1 protein likely to be phosphorylated, possible factors causing post-translational modification and colocalization of the DNMT2/TRDMT1 with possible modifiers.

- Submitted by
- Invitrogen Antibodies (provider)
- Main image

- Experimental details
- Figure 5 DPC Removal during S-Phase of the Cell Cycle (A) Schematic of the experimental approach used to synchronize T24 cell in G0 and monitor DPC levels during S-phase entry. (B) Total DPC levels in G0-, late G1-, and S-phase before and after SPRTN depletion in HeLa cells visualized by silver staining. The WB of cyclin A and cell-cycle profiles were used as a control of S-phase entry. (C) WB showing SPRTN expression or depletion in non-replicative and replicative T24 cells. (D) Schematic of cell viability measurement in replicative and non-replicative cells. (E) Cell viability of replicative and non-replicative T24 cells after SPRTN depletion and FA treatment. (F) Total DPC levels after G1/S release in HeLa WT and Delta-SPRTN cells visualized by silver staining. The WB of cyclins and cell-cycle profiles (lower images) were used to control S-phase progression. (G) WB showing presence of DNA-PK and Lamin B1 in DPCs in Delta-SPRTN HeLa cells after G1/S release. Whole cell extract: WCE. Mean +- SEM, n = 3.

- Submitted by
- Invitrogen Antibodies (provider)
- Main image

- Experimental details
- Figure 1 Lamin B (red) and Dp71 dystrophin isoform (Dys) (green) confocal dual immunofluorescence reaction in tumor ( E - I , L - R ) and normal human astrocytes (NHA) ( A - D ) cells. Dys fluorescent signal decreases and localizes in the cytoplasm of U118MG ( I , L , N ) and the glioblastoma primary cell line (GLI1) ( O , P , R ) tumor cells compared with strong and diffused nuclear signal in the NHA control cells ( A , B , D ). An orange fluorescence signal corresponding to colocalization of lamin B and Dys is present in NHA cells ( A , B yellow arrows). HBL52 meningioma cells ( E - H ) show a strong cytoplasmic and clustered Dys signal ( E , F , H , white arrow) compared to the control cells ( A , B , D ). Lamin B red fluorescence increases in U118MG ( L , M ) tumor cells compared to the NHA control cells ( B , C ). Morphometric analysis ( S ) shows a significant reduction of Dys fluorescence intensity in U118MG and GLI1 tumor cells, a significant increase of Dys expression in HBL52 meningioma cells, and a significant increase of lamin B expression in U118MG cells compared to NHA cells. The fluorescence intensity of colocalization decreases in tumor cells. (* p < 0.05, ** p < 0.01, *** p < 0.001--all groups vs. NHA group) Scale Bar: A-R 10 um.

- Submitted by
- Invitrogen Antibodies (provider)
- Main image

- Experimental details
- Figure 2 Lamin B and Dys protein ( A - C ) and mRNA expression ( D , E ) in tumor and NHA cells. Western blotting analysis shows Dys cytoplasmic ( C ) expression in HBL52, U118MG, and GLI1, tumor cells compared with Dys nuclear ( N ) expression in NHA cells ( A ). The lamin B expression is only nuclear for the presence of equal total ( T ) and nuclear ( N ) bands ( A ). The quantification of Dys bands ( B ) shows a significantly lower level of Dys proteins in total ( T ), nuclear ( N ), and cytoplasmic ( C ), protein fractions of U118MG and GLI1 cells compared to NHA cells, while the total ( T ) and cytoplasmic ( C ) protein fraction increases in HBL52 cells compared to NHA cells ( B ). The quantification of lamin B bands ( B ) reveals a significantly higher level of lamin B proteins in total (T) and nuclear (N) protein fractions of U118MG and GLI1 cells compared to NHA cells ( C ). The bands are representative of three independent experiments in triplicate for each protein, and beta-actin was used as a housekeeping gene. The data are expressed as proteins/beta-actin ratio +- SEM. The Dys mRNA expression analysis by real-time PCR (D) shows a significant increase of Dys mRNA levels in HBL52 cells and a decrease in U118MG and GLI1 cells as compared with the control NHA cells (D). The lamin B mRNA expression analysis by real-time PCR (E) shows a significant increase of lamin B mRNA levels in U118MG and GLI1 cells as compared with the control NHA cells (E). (* p < 0.05 all groups

- Submitted by
- Invitrogen Antibodies (provider)
- Main image
- Experimental details
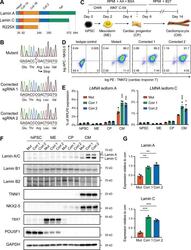
- Figure 1. Generation of lamin A/C haploinsufficient hiPSC-CMs. (A) Predicted effect of the LMNA R225X mutation on the two splicing products lamin A and C. (B) Sanger sequencing of LMNA exon 4 in hiPSCs with heterozygous R225X mutation (top), or in hiPSCs obtained after CRISPR/Cas9-based scarless correction of the mutation (bottom). (C) Schematic of the protocol for step-wise directed differentiation of hiPSC-CMs. CHIR, CHIR-99021; AA, ascorbic acid. (D) Quantification of cardiac differentiation efficiency by flow cytometry for TNNT2 and NKX2-5 on hiPSC-CMs at day 14 of differentiation. (E) RT-qPCR analyses at the indicated stages of hiPSC-CM differentiation (see panel C). Differences versus mutant were calculated by two-way ANOVA with post hoc Holm-Sidak binary comparisons (*, P < 0.05; ***, P < 0.001; n = 3 differentiations; average +- SEM). (F) Representative Western blot for A- and B-type lamins and differentiation markers during iPSC-CM differentiation. (G) Quantification of lamin A/C expression in hiPSC-CMs from Western blot densitometries. Differences versus mutant were calculated by one-way ANOVA with post hoc Holm-Sidak binary comparisons (**, P < 0.01; ***, P < 0.001; n = 3 differentiations; average +- SEM). Throughout the figure (and in all other figures), Mut or Mutant indicates LMNA R225X hiPSCs, and Corr.1/2 or Corrected 1/2 indicates the two isogenic corrected control LMNA R225R hiPSC lines.

- Submitted by
- Invitrogen Antibodies (provider)
- Main image

- Experimental details
- Figure 7. Alterations in peripheral localization of lamin A/C-sensitive loci. (A) Representative immunoFISH for the nuclear lamina (lamin B1), the cardiac marker alpha-actinin, and the CACNA1C locus in mutant and corrected hiPSCs and hiPSC-CM (nuclei counterstained with DAPI). Scale bars, 5 um. (B) Quantification of the distance between the indicated loci and the nuclear lamina in diploid cells based on immunoFISH data. Violin plots report the whole range, and horizontal lines indicate the first quartile, median, and third quartile. Statistical analysis by Brown-Forsythe and Welch ANOVA test followed by the Holm-Sidak multiple comparisons versus hiPSC for the same line or versus mutant, as indicated (*, P < 0.05; **, P < 0.01; ***, P < 0.001; n = individual loci, as indicated). (C) As in Fig. 6 E , but reporting chromatin compartmentalization changes for two genomic regions not affected by lamin A/C haploinsufficiency and used as negative control for immunoFISH experiments (B).

- Submitted by
- Invitrogen Antibodies (provider)
- Main image

- Experimental details
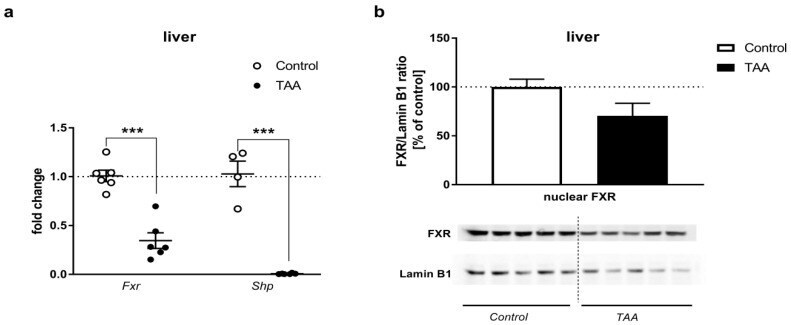
- Figure 3 ( a ) Fxr and Shp mRNA expression in the liver of control and TAA rats. Black circles represent the TAA-treated group, whereas empty circles denote the control group. All data are presented as an overlaying scatter-plot of single data points +- SEM, n = 4-6. *** p < 0.001 compared with control; ( b ) the relative protein level of FXR (55 kDa) in the nuclear fraction of liver homogenate of control and TAA rats. Lamin B1 (66 kDa) was used as an internal control. Results are presented as the mean +- SEM, n = 5.
- Submitted by
- Invitrogen Antibodies (provider)
- Main image

- Experimental details
- Figure 4 Fxr and Shp mRNA expression in the cerebral cortex, hippocampus, and cerebellum of control and TAA rats ( a , b ). Black circles represent the TAA-treated group, whereas empty circles denote the control group. All data are presented as an overlaying scatter-plot of single data points +- SEM, n = 4-6. * p < 0.05 compared with control; the relative protein level of FXR (55 kDa) in the nuclear fraction of cerebral cortex ( c ), hippocampus ( d ), cerebellum ( e ), homogenates of control and TAA rats. Lamin B1 (66 kDa) was used as an internal control. Results are presented as the mean +- SEM, n = 4-5.
