 Explore
 Validate
 Learn
Learn Western blot
 Immunohistochemistry
Antibody data
- Antibody Data
- Antigen structure
- References [0]
- Comments [0]
- Validations
- Immunohistochemistry [4]
- Other assay [4]
Submit
Validation data
Reference
Comment
Report error
- Product number
- MA1-26771 - Provider product page

- Provider
- Invitrogen Antibodies
- Product name
- Collagen I Monoclonal Antibody (COL-1)
- Antibody type
- Monoclonal
- Antigen
- Other
- Description
- The antibody is reactive with the native (helical) form of collagen type I in ELISA and dot blot. The product is not reactive when tested on thermally denatured molecules. In immunohistochemical staining of acetone-fixed and unfixed frozen sections, a strong staining of connective tissue fibers is seen. Using the dot blot and ELISA techniques, the antibody shows no cross-reactivity with collagen types, II, III, IV, V, VI, VII, IX, X and XI. The epitope recognized by the antibody is sensitive to routine formalin fixation and paraffin embedding.|Store product as a concentrated solution. Centrifuge briefly prior to opening the vial.
- Reactivity
- Human, Mouse, Rat, Bovine, Porcine, Rabbit
- Host
- Mouse
- Isotype
- IgG
- Antibody clone number
- COL-1
- Vial size
- 100 µL
- Concentration
- 6.4 mg/mL
- Storage
- Store at 4°C short term. For long term storage, store at -20°C, avoiding freeze/thaw cycles.
No comments: Submit comment
Supportive validation
- Submitted by
- Invitrogen Antibodies (provider)
- Main image
- Experimental details
- Immunohistochemistry analysis of Collagen-I was performed in pig tongue tissue using Collagen I Monoclonal Antibody (COL-1) (Product # MA1-26771) at a dilution of 1:4,000.

- Submitted by
- Invitrogen Antibodies (provider)
- Main image

- Experimental details
- Immunohistochemistry analysis of Collagen-I was performed in pig tongue tissue using Collagen I Monoclonal Antibody (COL-1) (Product # MA1-26771) at a dilution of 1:4,000.

- Submitted by
- Invitrogen Antibodies (provider)
- Main image

- Experimental details
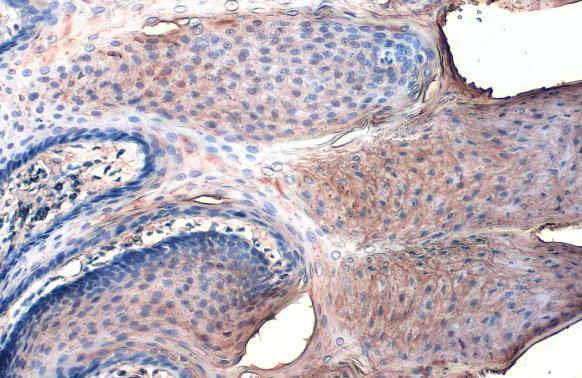
- Immunohistochemistry analysis of Collagen-I was performed in human tongue tissue using Collagen I Monoclonal Antibody (COL-1) (Product # MA1-26771) at a dilution of 1:2,000.

- Submitted by
- Invitrogen Antibodies (provider)
- Main image

- Experimental details
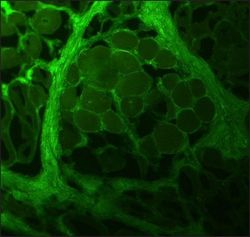
- Collagen I Monoclonal Antibody (COL-1) detects Collagen I protein at cell membrane by immunohistochemical analysis. Sample: Paraffin-embedded rabbit tongue. Collagen I stained by Collagen I Monoclonal Antibody (COL-1) (Product # MA1-26771) diluted at 1:200. Antigen Retrieval: Citrate buffer, pH 6.0, 15 min.
Supportive validation
- Submitted by
- Invitrogen Antibodies (provider)
- Main image

- Experimental details
- Serum bone turnover markers in three different treatment mouse groups. Standard ELISA methods for ( A ) APL, alkaline phosphatase; ( B ) TRAP5b, tartrate-resistant acid phosphatase 5b; ( C ) CTX-1, C-terminal telopeptide of type I collagen. ( D ) Western blots for col-1a (collagen 1), NFATc1, and cathepsin K. Total protein was isolated from vertebra L2 to L3; samples were five per group. Data are expressed as mean +- SD (sham group n = 9; OVX group n = 10; OVX + E2 n = 11). One-way ANOVA followed by Student-Newman-Keuls post hoc analysis for multiple pairwise comparisons was performed.

- Submitted by
- Invitrogen Antibodies (provider)
- Main image
- Experimental details
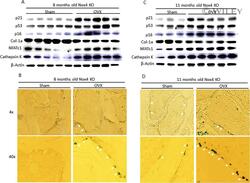
- Increased senescence pathway in bone from ovariectomized (OVX) Nox4 -/- mice. ( A ) Proteins were isolated from L2 to L3 vertebral bone from sham and OVX 8-month-old mouse groups. Western blots show overexpression p53, p21, p16, NFATc1, and cathepsin K, but downregulation of Col-1a protein expression in the OVX group compared with the sham group. ( B ) Senescence-associated beta-galactosidase (SAbetaG) staining was performed on cryo-sectioned L4 vertebral bone. Images (magnification x4 and x40 from an epifluorescent microscope, model BH-2; Olympus, Tokyo, Japan) show one representative sample from each group. White arrows show SabetaG-positive blue-stained osteoblastic cells on bone surface. ( C ) Western blots show overexpression of p53, p21, p16, NFATc1, and cathepsin K, but downregulation of Col-1a protein expression in 11-month-old OVX group compared with the sham group (two samples from the sham group were lost during sample preparation). ( D ) SAbetaG staining was performed on cryo-sectioned L4 vertebral bone. Images (magnification x4 and x40 from epifluorescent microscope, model BH-2; Olympus) show one representative sample from each group of 11-month-old Nox4 -/- mice. White arrows show SabetaG-positive blue-stained osteoblastic cells on bone surface.

- Submitted by
- Invitrogen Antibodies (provider)
- Main image

- Experimental details
- FIGURE 4 Low-oxygen within 3D-O matrices increases the expression of main fibrous ECM proteins. (A) Representative fluorescent images exhibiting changes in expression of collagen I, collagen III, and fibronectin at day 4 for MDA-MB-231 cells grown within 3D-O physiological and 3D-O tumorous matrices; DAPI: Blue; ECMs: green). Scale bar = 100 mum. (B) ECM expression by BCa cells growing within 3D-O physiological and 3D-O tumorous matrices, quantified as MFI of ECM expression (i) and the number of cells (ii) . (C) Representative fluorescent images exhibiting changes in collagen I expression by MDA-MB-231 cells grown in 3D-O physiological and 3D-O tumorous matrices after treatment with PX-478 for 4 days at 5 muM concentration. Scale bar = 100 mum. ** p < 0.001, * p < 0.05, data were analyzed using unpaired two-tailed Student''s t -test.

- Submitted by
- Invitrogen Antibodies (provider)
- Main image

- Experimental details
- FIGURE 2 The proliferating ventricular cardiomyocytes were efficiently labeled in Tnnt2-Dre x Aurkb-rox-tdTomato neonates. (A) Tnnt2-Dre mice were used to cross with Aurkb-rox-tdTomato mice to label proliferating cardiomyocytes. (B) Immunostaining showed the coexpression of tdTomato with cTnT, PECAM, a-SMA, or Col1 on P1 Tnnt2-Dre x Aurkb-rox-tdTomato heart sections. Scale bar = 40 mum. (C) Immunostaining for tdTomato with Aurkb on P56 Tnnt2-Dre x Aurkb-rox-tdTomato heart sections. Scale bar = 20 mum. (D) Representative images of flow cytometry analysis (D1) and quantification of tdTomato +- cells (D2) and numbers in G1, S, G2/M phases (D3) from ventricles of P1 Tnnt2-Dre x Aurkb-rox-tdTomato mice. (D2) n = 6, * p < 0.05 vs. tdTomato - cTnT - ; # p < 0.05 vs. tdTomato + cTnT - ; & p < 0.05 vs. tdTomato - cTnT + . (D3) n = 5, * p < 0.05 vs. tdTomato - cTnT + . (E) Representative images (E1) and quantification (E2) of time-lapse imaging analysis showed cell proliferation in vitro of tdTomato + cardiomyocytes from the ventricles of P1 Tnnt2-Dre x Aurkb-rox-tdTomato mice. Scale bar = 20 mum.
