Explore
 Validate
 Learn
Learn Western blot
Antibody data
- Antibody Data
- Antigen structure
- References [141]
- Comments [0]
- Validations
- Western blot [5]
- Immunocytochemistry [39]
- Immunohistochemistry [2]
- Flow cytometry [1]
- Other assay [58]
Submit
Validation data
Reference
Comment
Report error
- Product number
- A11126 - Provider product page

- Provider
- Invitrogen Antibodies
- Product name
- alpha Tubulin Monoclonal Antibody (236-10501)
- Antibody type
- Monoclonal
- Antigen
- Other
- Description
- The anti-bovine alpha-tubulin antibody can be used with secondary detection techniques to visualize microtubules in fixed cells and in fixed or frozen tissue sections of various species. In addition, this antibody can be used to detect tubulin by ELISA and immunoblot, for the screening of expression libraries and, since it recognizes amino acids 65-97 of the N-terminal structural domain, as a probe for the N-terminal domain of alpha-tubulin.
- Antibody clone number
- 236-10501
Submitted references Cur@SF NPs alleviate Friedreich's ataxia in a mouse model through synergistic iron chelation and antioxidation.
Neuroplastin genetically interacts with Cadherin 23 and the encoded isoform Np55 is sufficient for cochlear hair cell function and hearing.
A 9-kDa matricellular SPARC fragment released by cathepsin D exhibits pro-tumor activity in the triple-negative breast cancer microenvironment.
MicroRNA-155-5p Contributes to 5-Fluorouracil Resistance Through Down-Regulating TP53INP1 in Oral Squamous Cell Carcinoma.
PARP inhibition in UV-associated angiosarcoma preclinical models.
NETs decorated with bioactive IL-33 infiltrate inflamed tissues and induce IFN-α production in patients with SLE.
9-Cyanopyronin probe palette for super-multiplexed vibrational imaging.
The FUS gene is dual-coding with both proteins contributing to FUS-mediated toxicity.
Discovery of a Novel Specific Inhibitor Targeting Influenza A Virus Nucleoprotein with Pleiotropic Inhibitory Effects on Various Steps of the Viral Life Cycle.
Human parainfluenza virus type 3 expressing the respiratory syncytial virus pre-fusion F protein modified for virion packaging yields protective intranasal vaccine candidates.
Navitoclax combined with Alpelisib effectively inhibits Merkel cell carcinoma cell growth in vitro.
Tetraspanin-7 regulation of L-type voltage-dependent calcium channels controls pancreatic β-cell insulin secretion.
Subcellular mRNA Localization Regulates Ribosome Biogenesis in Migrating Cells.
The Medicago truncatula DREPP Protein Triggers Microtubule Fragmentation in Membrane Nanodomains during Symbiotic Infections.
High-intensity interval exercise increases humanin, a mitochondrial encoded peptide, in the plasma and muscle of men.
Whole-genome sequencing of patients with rare diseases in a national health system.
Olaparib and temozolomide in desmoplastic small round cell tumors: a promising combination in vitro and in vivo.
Protein synthesis inhibitors stimulate MondoA transcriptional activity by driving an accumulation of glucose 6-phosphate.
Standardized Reporter Systems for Purification and Imaging of Human Pluripotent Stem Cell-derived Motor Neurons and Other Cholinergic Cells.
Besnoitia besnoiti-driven endothelial host cell cycle alteration.
The role of ZAP and OAS3/RNAseL pathways in the attenuation of an RNA virus with elevated frequencies of CpG and UpA dinucleotides.
Abemaciclib Is Effective Against Pancreatic Cancer Cells and Synergizes with HuR and YAP1 Inhibition.
Actin-microtubule interplay coordinates spindle assembly in human oocytes.
Novel Therapeutic Anti-ADAM17 Antibody A9(B8) Enhances EGFR-TKI-Mediated Anticancer Activity in NSCLC.
Fibroblastic Reticular Cells Control Conduit Matrix Deposition during Lymph Node Expansion.
Nuclear Deformation in Response to Mechanical Confinement is Cell Type Dependent.
Resolution limit of image analysis algorithms.
Toxoplasma gondii-induced host cellular cell cycle dysregulation is linked to chromosome missegregation and cytokinesis failure in primary endothelial host cells.
The Methyltransferase-Like Domain of Chikungunya Virus nsP2 Inhibits the Interferon Response by Promoting the Nuclear Export of STAT1.
Variants in EXOSC9 Disrupt the RNA Exosome and Result in Cerebellar Atrophy with Spinal Motor Neuronopathy.
Primary Cilia Mediate Diverse Kinase Inhibitor Resistance Mechanisms in Cancer.
Double Strand Break DNA Repair occurs via Non-Homologous End-Joining in Mouse MII Oocytes.
Imaging of immunogold labeling in cells and tissues by helium ion microscopy.
Characterisation of cellular effects of Burkholderia pseudomallei cycle inhibiting factor (Cif).
Abundant off-target edits from site-directed RNA editing can be reduced by nuclear localization of the editing enzyme.
Grafting of Bioactive Polymers with Various Architectures: A Versatile Tool for Preparing Antibacterial Infection and Biocompatible Surfaces.
Collagen COL22A1 maintains vascular stability and mutations in COL22A1 are potentially associated with intracranial aneurysms.
Anti-diabetic Effects of Ethanol Extract from Bitter Melon in Mice Fed a High-fat Diet.
Reciprocal amplification of caspase-3 activity by nuclear export of a putative human RNA-modifying protein, PUS10 during TRAIL-induced apoptosis.
INPP5E Preserves Genomic Stability through Regulation of Mitosis.
Inhibition of AURKA kinase activity suppresses collective invasion in a microfluidic cell culture platform.
Endogenous AJAP1 associates with the cytoskeleton and attenuates angiogenesis in endothelial cells.
Inhibition of PIP4Kγ ameliorates the pathological effects of mutant huntingtin protein.
DTX3L is upregulated in glioma and is associated with glioma progression.
Rho-associated protein kinase regulates subcellular localisation of Angiomotin and Hippo-signalling during preimplantation mouse embryo development.
Mechanism of Axonal Contractility in Embryonic Drosophila Motor Neurons In Vivo.
Forkhead Box O3A (FOXO3) and the Mitochondrial Disulfide Relay Carrier (CHCHD4) Regulate p53 Protein Nuclear Activity in Response to Exercise.
The sensitivity of the DNA damage checkpoint prevents oocyte maturation in endometriosis.
Human Cytomegalovirus Immediate-Early 1 Protein Rewires Upstream STAT3 to Downstream STAT1 Signaling Switching an IL6-Type to an IFNγ-Like Response.
Adenomatous polyposis coli regulates radial axonal sorting and myelination in the PNS.
Maternal Smoke Exposure Impairs the Long-Term Fertility of Female Offspring in a Murine Model.
Pellicle formation in the malaria parasite.
Resin embedded multicycle imaging (REMI): a tool to evaluate protein domains.
Apolar and polar transitions drive the conversion between amoeboid and mesenchymal shapes in melanoma cells.
DNAM-1 controls NK cell activation via an ITT-like motif.
Mcl-1 is a key regulator of the ovarian reserve.
A sensitised RNAi screen reveals a ch-TOG genetic interaction network required for spindle assembly.
Knockout of RNA Binding Protein MSI2 Impairs Follicle Development in the Mouse Ovary: Characterization of MSI1 and MSI2 during Folliculogenesis.
Identification of a novel MET mutation in high-grade glioma resulting in an auto-active intracellular protein.
Mitochondrial dysfunction in oocytes of obese mothers: transmission to offspring and reversal by pharmacological endoplasmic reticulum stress inhibitors.
Reprogramming cellular phenotype by soft collagen gels.
Pharmacologic suppression of JAK1/2 by JAK1/2 inhibitor AZD1480 potently inhibits IL-6-induced experimental prostate cancer metastases formation.
Characterization of the mitofusin 2 R94W mutation in a knock-in mouse model.
Motor protein mutations cause a new form of hereditary spastic paraplegia.
IFT27, encoding a small GTPase component of IFT particles, is mutated in a consanguineous family with Bardet-Biedl syndrome.
A role for Ral GTPase-activating protein subunit β in mitotic regulation.
Preclinical activity profile and therapeutic efficacy of the HSP90 inhibitor ganetespib in triple-negative breast cancer.
Epithelial and stromal cells of bovine endometrium have roles in innate immunity and initiate inflammatory responses to bacterial lipopeptides in vitro via Toll-like receptors TLR2, TLR1, and TLR6.
mTORC1 dependent regulation of REDD1 protein stability.
Effects of dual targeting of tumor cells and stroma in human glioblastoma xenografts with a tyrosine kinase inhibitor against c-MET and VEGFR2.
DNA damage response in male gametes of Cyrtanthus mackenii during pollen tube growth.
Post-translational regulation of mTOR complex 1 in hypoxia and reoxygenation.
Atypical protein kinase Cι is required for Wnt3a-dependent neurite outgrowth and binds to phosphorylated dishevelled 2.
Destabilization of CDC6 upon DNA damage is dependent on neddylation but independent of Cullin E3 ligases.
Cytostasis and morphological changes induced by mifepristone in human metastatic cancer cells involve cytoskeletal filamentous actin reorganization and impairment of cell adhesion dynamics.
Adenomatous polyposis coli regulates oligodendroglial development.
De novo generation of cells within human nurse macrophages and consequences following HIV-1 infection.
The mechanical behavior of mutant K14-R125P keratin bundles and networks in NEB-1 keratinocytes.
The role of the cullin-5 e3 ubiquitin ligase in the regulation of insulin receptor substrate-1.
APC(FZR1) prevents nondisjunction in mouse oocytes by controlling meiotic spindle assembly timing.
Estrous cycle-dependent changes of Fas expression in the bovine corpus luteum: influence of keratin 8/18 intermediate filaments and cytokines.
Timing of anaphase-promoting complex activation in mouse oocytes is predicted by microtubule-kinetochore attachment but not by bivalent alignment or tension.
Stat1 activation attenuates IL-6 induced Stat3 activity but does not alter apoptosis sensitivity in multiple myeloma.
Combined expression of KLK4, KLK5, KLK6, and KLK7 by ovarian cancer cells leads to decreased adhesion and paclitaxel-induced chemoresistance.
A unique ball-shaped Golgi apparatus in the rat pituitary gonadotrope: its functional implications in relation to the arrangement of the microtubule network.
CBP/p300 and SIRT1 are involved in transcriptional regulation of S-phase specific histone genes.
Centrosomal dysregulation in human metastatic melanoma cell lines.
Corticotropin releasing factor-induced CREB activation in striatal neurons occurs via a novel Gβγ signaling pathway.
Increased susceptibility to cortical spreading depression in the mouse model of familial hemiplegic migraine type 2.
Neddylation-induced conformational control regulates cullin RING ligase activity in vivo.
An overlapping reading frame in the PRNP gene encodes a novel polypeptide distinct from the prion protein.
SNARE-mediated membrane traffic is required for focal adhesion kinase signaling and Src-regulated focal adhesion turnover.
Regulation of cullin RING E3 ubiquitin ligases by CAND1 in vivo.
Characterization of the role of COP9 signalosome in regulating cullin E3 ubiquitin ligase activity.
Essential role of protein phosphatase 2A in metaphase II arrest and activation of mouse eggs shown by okadaic acid, dominant negative protein phosphatase 2A, and FTY720.
Protein kinase A-mediated phosphorylation of the RASSF1A tumour suppressor at Serine 203 and regulation of RASSF1A function.
Sperm dimorphism in terms of nuclear shape and microtubule accumulation in Cyrtanthus mackenii.
Biochemical and cellular effects of inhibiting Nedd8 conjugation.
A spatio-temporal analysis of matrix protein and nucleocapsid trafficking during vesicular stomatitis virus uncoating.
Amino terminal hydrophobic import signals target the p14(ARF) tumor suppressor to the mitochondria.
Thioredoxin-interacting protein (Txnip) gene expression: sensing oxidative phosphorylation status and glycolytic rate.
Calmodulin-dependent protein kinase gamma 3 (CamKIIgamma3) mediates the cell cycle resumption of metaphase II eggs in mouse.
p16INK4a-induced senescence is disabled by melanoma-associated mutations.
Biomechanical analysis of cancerous and normal cells based on bulge generation in a microfluidic device.
Regulation of FE65 nuclear translocation and function by amyloid beta-protein precursor in osmotically stressed cells.
Impairment of the telomere/telomerase system and genomic instability are associated with keratinocyte immortalization induced by the skin human papillomavirus type 38.
Localization of C. trachomatis Inc proteins in expression of their genes in HeLa cell culture.
New isoforms of rat Aquaporin-4.
A role for CK2 upon interkinetic nuclear migration in the cell cycle of retinal progenitor cells.
Wnt-3a and Dickkopf-1 stimulate neurite outgrowth in Ewing tumor cells via a Frizzled3- and c-Jun N-terminal kinase-dependent mechanism.
Development of an AT2-deficient proximal tubule cell line for transport studies.
Fluorescence nanoscopy in whole cells by asynchronous localization of photoswitching emitters.
A cassette system to study embryonic stem cell differentiation by inducible RNA interference.
Characterization of cullin-based E3 ubiquitin ligases in intact mammalian cells--evidence for cullin dimerization.
A mutation in CCDC50, a gene encoding an effector of epidermal growth factor-mediated cell signaling, causes progressive hearing loss.
Pollen tube growth: coping with mechanical obstacles involves the cytoskeleton.
Distinct roles of TIR and non-TIR regions in the subcellular localization and signaling properties of MyD88.
Effect of paclitaxel on intracellular localization of c-Myc and P-c-Myc in prostate carcinoma cell lines.
Paclitaxel induced apoptosis in breast cancer cells requires cell cycle transit but not Cdc2 activity.
Membrane localization of adenomatous polyposis coli protein at cellular protrusions: targeting sequences and regulation by beta-catenin.
Comprehensive examination of charged intramembrane residues in a nucleoside transporter.
The transmembrane domain is essential for the microtubular trafficking of membrane type-1 matrix metalloproteinase (MT1-MMP).
COMMD proteins, a novel family of structural and functional homologs of MURR1.
Regulation of two insulin granule populations within the reserve pool by distinct calcium sources.
Using single-particle tracking to study nuclear trafficking of viral genes.
Pigment cells: a model for the study of organelle transport.
Simultaneous trichromatic fluorescence detection of proteins on Western blots using an amine-reactive dye in combination with alkaline phosphatase- and horseradish peroxidase-antibody conjugates.
Mammalian ykt6 is a neuronal SNARE targeted to a specialized compartment by its profilin-like amino terminal domain.
Inhibition of tumor necrosis factor alpha-mediated NFkappaB activation and leukocyte adhesion, with enhanced endothelial apoptosis, by G protein-linked receptor (TP) ligands.
A phosphatidylinositol (4,5)-bisphosphate binding site within mu2-adaptin regulates clathrin-mediated endocytosis.
Spastin, the protein mutated in autosomal dominant hereditary spastic paraplegia, is involved in microtubule dynamics.
Distinct regions in the 3' untranslated region are responsible for targeting and stabilizing utrophin transcripts in skeletal muscle cells.
Control of intracellular movement of connexins by E-cadherin in murine skin papilloma cells.
Temperature-dependent arrest of neutrophil apoptosis. Failure of Bax insertion into mitochondria at 15 degrees C prevents the release of cytochrome c.
S100A6 and S100A11 are specific targets of the calcium- and zinc-binding S100B protein in vivo.
Distinct FTDP-17 missense mutations in tau produce tau aggregates and other pathological phenotypes in transfected CHO cells.
Alexa dyes, a series of new fluorescent dyes that yield exceptionally bright, photostable conjugates.
The EF-hand Ca(2+)-binding protein p22 associates with microtubules in an N-myristoylation-dependent manner.
A luminescent ruthenium complex for ultrasensitive detection of proteins immobilized on membrane supports.
APO2.7 defines a shared apoptotic-necrotic pathway in a breast tumor hypoxia model.
Zygotic expression of the pebble locus is required for cytokinesis during the postblastoderm mitoses of Drosophila.
Xu L, Sun Z, Xing Z, Liu Y, Zhao H, Tang Z, Luo Y, Hao S, Li K
Journal of nanobiotechnology 2022 Mar 9;20(1):118
Journal of nanobiotechnology 2022 Mar 9;20(1):118
Neuroplastin genetically interacts with Cadherin 23 and the encoded isoform Np55 is sufficient for cochlear hair cell function and hearing.
Newton S, Kong F, Carlton AJ, Aguilar C, Parker A, Codner GF, Teboul L, Wells S, Brown SDM, Marcotti W, Bowl MR
PLoS genetics 2022 Jan;18(1):e1009937
PLoS genetics 2022 Jan;18(1):e1009937
A 9-kDa matricellular SPARC fragment released by cathepsin D exhibits pro-tumor activity in the triple-negative breast cancer microenvironment.
Alcaraz LB, Mallavialle A, David T, Derocq D, Delolme F, Dieryckx C, Mollevi C, Boissière-Michot F, Simony-Lafontaine J, Du Manoir S, Huesgen PF, Overall CM, Tartare-Deckert S, Jacot W, Chardès T, Guiu S, Roger P, Reinheckel T, Moali C, Liaudet-Coopman E
Theranostics 2021;11(13):6173-6192
Theranostics 2021;11(13):6173-6192
MicroRNA-155-5p Contributes to 5-Fluorouracil Resistance Through Down-Regulating TP53INP1 in Oral Squamous Cell Carcinoma.
Liu B, Hu J, Zhao H, Zhao L, Pan S
Frontiers in oncology 2021;11:706095
Frontiers in oncology 2021;11:706095
PARP inhibition in UV-associated angiosarcoma preclinical models.
Weidema ME, Desar IME, Hillebrandt-Roeffen MHS, van Erp AEM, Masuzawa M, PALGA-group, Flucke UE, van der Graaf WTA, Versleijen-Jonkers YMH
Journal of cancer research and clinical oncology 2021 Sep;147(9):2579-2590
Journal of cancer research and clinical oncology 2021 Sep;147(9):2579-2590
NETs decorated with bioactive IL-33 infiltrate inflamed tissues and induce IFN-α production in patients with SLE.
Georgakis S, Gkirtzimanaki K, Papadaki G, Gakiopoulou H, Drakos E, Eloranta ML, Makridakis M, Kontostathi G, Zoidakis J, Baira E, Rönnblom L, Boumpas DT, Sidiropoulos P, Verginis P, Bertsias G
JCI insight 2021 Nov 8;6(21)
JCI insight 2021 Nov 8;6(21)
9-Cyanopyronin probe palette for super-multiplexed vibrational imaging.
Miao Y, Qian N, Shi L, Hu F, Min W
Nature communications 2021 Jul 26;12(1):4518
Nature communications 2021 Jul 26;12(1):4518
The FUS gene is dual-coding with both proteins contributing to FUS-mediated toxicity.
Brunet MA, Jacques JF, Nassari S, Tyzack GE, McGoldrick P, Zinman L, Jean S, Robertson J, Patani R, Roucou X
EMBO reports 2021 Jan 7;22(1):e50640
EMBO reports 2021 Jan 7;22(1):e50640
Discovery of a Novel Specific Inhibitor Targeting Influenza A Virus Nucleoprotein with Pleiotropic Inhibitory Effects on Various Steps of the Viral Life Cycle.
Yang F, Pang B, Lai KK, Cheung NN, Dai J, Zhang W, Zhang J, Chan KH, Chen H, Sze KH, Zhang H, Hao Q, Yang D, Yuen KY, Kao RY
Journal of virology 2021 Apr 12;95(9)
Journal of virology 2021 Apr 12;95(9)
Human parainfluenza virus type 3 expressing the respiratory syncytial virus pre-fusion F protein modified for virion packaging yields protective intranasal vaccine candidates.
Liu X, Liang B, Liu X, Amaro-Carambot E, Surman S, Kwong PD, Graham BS, Collins PL, Munir S
PloS one 2020;15(2):e0228572
PloS one 2020;15(2):e0228572
Navitoclax combined with Alpelisib effectively inhibits Merkel cell carcinoma cell growth in vitro.
Chteinberg E, Wetzels S, Gerritsen W, Temmerman L, van den Oord J, Biessen E, Kurz AK, Winnepenninckx V, Zenke M, Speel EJ, Zur Hausen A
Therapeutic advances in medical oncology 2020;12:1758835920975621
Therapeutic advances in medical oncology 2020;12:1758835920975621
Tetraspanin-7 regulation of L-type voltage-dependent calcium channels controls pancreatic β-cell insulin secretion.
Dickerson MT, Dadi PK, Butterworth RB, Nakhe AY, Graff SM, Zaborska KE, Schaub CM, Jacobson DA
The Journal of physiology 2020 Nov;598(21):4887-4905
The Journal of physiology 2020 Nov;598(21):4887-4905
Subcellular mRNA Localization Regulates Ribosome Biogenesis in Migrating Cells.
Dermit M, Dodel M, Lee FCY, Azman MS, Schwenzer H, Jones JL, Blagden SP, Ule J, Mardakheh FK
Developmental cell 2020 Nov 9;55(3):298-313.e10
Developmental cell 2020 Nov 9;55(3):298-313.e10
The Medicago truncatula DREPP Protein Triggers Microtubule Fragmentation in Membrane Nanodomains during Symbiotic Infections.
Su C, Klein ML, Hernández-Reyes C, Batzenschlager M, Ditengou FA, Lace B, Keller J, Delaux PM, Ott T
The Plant cell 2020 May;32(5):1689-1702
The Plant cell 2020 May;32(5):1689-1702
High-intensity interval exercise increases humanin, a mitochondrial encoded peptide, in the plasma and muscle of men.
Woodhead JST, D'Souza RF, Hedges CP, Wan J, Berridge MV, Cameron-Smith D, Cohen P, Hickey AJR, Mitchell CJ, Merry TL
Journal of applied physiology (Bethesda, Md. : 1985) 2020 May 1;128(5):1346-1354
Journal of applied physiology (Bethesda, Md. : 1985) 2020 May 1;128(5):1346-1354
Whole-genome sequencing of patients with rare diseases in a national health system.
Turro E, Astle WJ, Megy K, Gräf S, Greene D, Shamardina O, Allen HL, Sanchis-Juan A, Frontini M, Thys C, Stephens J, Mapeta R, Burren OS, Downes K, Haimel M, Tuna S, Deevi SVV, Aitman TJ, Bennett DL, Calleja P, Carss K, Caulfield MJ, Chinnery PF, Dixon PH, Gale DP, James R, Koziell A, Laffan MA, Levine AP, Maher ER, Markus HS, Morales J, Morrell NW, Mumford AD, Ormondroyd E, Rankin S, Rendon A, Richardson S, Roberts I, Roy NBA, Saleem MA, Smith KGC, Stark H, Tan RYY, Themistocleous AC, Thrasher AJ, Watkins H, Webster AR, Wilkins MR, Williamson C, Whitworth J, Humphray S, Bentley DR, NIHR BioResource for the 100,000 Genomes Project, Kingston N, Walker N, Bradley JR, Ashford S, Penkett CJ, Freson K, Stirrups KE, Raymond FL, Ouwehand WH
Nature 2020 Jul;583(7814):96-102
Nature 2020 Jul;583(7814):96-102
Olaparib and temozolomide in desmoplastic small round cell tumors: a promising combination in vitro and in vivo.
van Erp AEM, van Houdt L, Hillebrandt-Roeffen MHS, van Bree NFHN, Flucke UE, Mentzel T, Shipley J, Desar IME, Fleuren EDG, Versleijen-Jonkers YMH, van der Graaf WTA
Journal of cancer research and clinical oncology 2020 Jul;146(7):1659-1670
Journal of cancer research and clinical oncology 2020 Jul;146(7):1659-1670
Protein synthesis inhibitors stimulate MondoA transcriptional activity by driving an accumulation of glucose 6-phosphate.
Wilde BR, Kaadige MR, Guillen KP, Butterfield A, Welm BE, Ayer DE
Cancer & metabolism 2020 Dec 4;8(1):27
Cancer & metabolism 2020 Dec 4;8(1):27
Standardized Reporter Systems for Purification and Imaging of Human Pluripotent Stem Cell-derived Motor Neurons and Other Cholinergic Cells.
Garcia-Diaz A, Efe G, Kabra K, Patel A, Lowry ER, Shneider NA, Corneo B, Wichterle H
Neuroscience 2020 Dec 1;450:48-56
Neuroscience 2020 Dec 1;450:48-56
Besnoitia besnoiti-driven endothelial host cell cycle alteration.
Velásquez ZD, Lopez-Osorio S, Pervizaj-Oruqaj L, Herold S, Hermosilla C, Taubert A
Parasitology research 2020 Aug;119(8):2563-2577
Parasitology research 2020 Aug;119(8):2563-2577
The role of ZAP and OAS3/RNAseL pathways in the attenuation of an RNA virus with elevated frequencies of CpG and UpA dinucleotides.
Odon V, Fros JJ, Goonawardane N, Dietrich I, Ibrahim A, Alshaikhahmed K, Nguyen D, Simmonds P
Nucleic acids research 2019 Sep 5;47(15):8061-8083
Nucleic acids research 2019 Sep 5;47(15):8061-8083
Abemaciclib Is Effective Against Pancreatic Cancer Cells and Synergizes with HuR and YAP1 Inhibition.
Dhir T, Schultz CW, Jain A, Brown SZ, Haber A, Goetz A, Xi C, Su GH, Xu L, Posey J 3rd, Jiang W, Yeo CJ, Golan T, Pishvaian MJ, Brody JR
Molecular cancer research : MCR 2019 Oct;17(10):2029-2041
Molecular cancer research : MCR 2019 Oct;17(10):2029-2041
Actin-microtubule interplay coordinates spindle assembly in human oocytes.
Roeles J, Tsiavaliaris G
Nature communications 2019 Oct 11;10(1):4651
Nature communications 2019 Oct 11;10(1):4651
Novel Therapeutic Anti-ADAM17 Antibody A9(B8) Enhances EGFR-TKI-Mediated Anticancer Activity in NSCLC.
Yang Z, Chan KI, Kwok HF, Tam KY
Translational oncology 2019 Nov;12(11):1516-1524
Translational oncology 2019 Nov;12(11):1516-1524
Fibroblastic Reticular Cells Control Conduit Matrix Deposition during Lymph Node Expansion.
Martinez VG, Pankova V, Krasny L, Singh T, Makris S, White IJ, Benjamin AC, Dertschnig S, Horsnell HL, Kriston-Vizi J, Burden JJ, Huang PH, Tape CJ, Acton SE
Cell reports 2019 Nov 26;29(9):2810-2822.e5
Cell reports 2019 Nov 26;29(9):2810-2822.e5
Nuclear Deformation in Response to Mechanical Confinement is Cell Type Dependent.
Doolin MT, Ornstein TS, Stroka KM
Cells 2019 May 8;8(5)
Cells 2019 May 8;8(5)
Resolution limit of image analysis algorithms.
Cohen EAK, Abraham AV, Ramakrishnan S, Ober RJ
Nature communications 2019 Feb 15;10(1):793
Nature communications 2019 Feb 15;10(1):793
Toxoplasma gondii-induced host cellular cell cycle dysregulation is linked to chromosome missegregation and cytokinesis failure in primary endothelial host cells.
Velásquez ZD, Conejeros I, Larrazabal C, Kerner K, Hermosilla C, Taubert A
Scientific reports 2019 Aug 29;9(1):12496
Scientific reports 2019 Aug 29;9(1):12496
The Methyltransferase-Like Domain of Chikungunya Virus nsP2 Inhibits the Interferon Response by Promoting the Nuclear Export of STAT1.
Göertz GP, McNally KL, Robertson SJ, Best SM, Pijlman GP, Fros JJ
Journal of virology 2018 Sep 1;92(17)
Journal of virology 2018 Sep 1;92(17)
Variants in EXOSC9 Disrupt the RNA Exosome and Result in Cerebellar Atrophy with Spinal Motor Neuronopathy.
Burns DT, Donkervoort S, Müller JS, Knierim E, Bharucha-Goebel D, Faqeih EA, Bell SK, AlFaifi AY, Monies D, Millan F, Retterer K, Dyack S, MacKay S, Morales-Gonzalez S, Giunta M, Munro B, Hudson G, Scavina M, Baker L, Massini TC, Lek M, Hu Y, Ezzo D, AlKuraya FS, Kang PB, Griffin H, Foley AR, Schuelke M, Horvath R, Bönnemann CG
American journal of human genetics 2018 May 3;102(5):858-873
American journal of human genetics 2018 May 3;102(5):858-873
Primary Cilia Mediate Diverse Kinase Inhibitor Resistance Mechanisms in Cancer.
Jenks AD, Vyse S, Wong JP, Kostaras E, Keller D, Burgoyne T, Shoemark A, Tsalikis A, de la Roche M, Michaelis M, Cinatl J Jr, Huang PH, Tanos BE
Cell reports 2018 Jun 5;23(10):3042-3055
Cell reports 2018 Jun 5;23(10):3042-3055
Double Strand Break DNA Repair occurs via Non-Homologous End-Joining in Mouse MII Oocytes.
Martin JH, Bromfield EG, Aitken RJ, Lord T, Nixon B
Scientific reports 2018 Jun 26;8(1):9685
Scientific reports 2018 Jun 26;8(1):9685
Imaging of immunogold labeling in cells and tissues by helium ion microscopy.
Sato C, Sato M, Ogawa S
International journal of molecular medicine 2018 Jul;42(1):309-321
International journal of molecular medicine 2018 Jul;42(1):309-321
Characterisation of cellular effects of Burkholderia pseudomallei cycle inhibiting factor (Cif).
Ng MY, Gan YH, Hagen T
Biology open 2018 Jul 16;7(7)
Biology open 2018 Jul 16;7(7)
Abundant off-target edits from site-directed RNA editing can be reduced by nuclear localization of the editing enzyme.
Vallecillo-Viejo IC, Liscovitch-Brauer N, Montiel-Gonzalez MF, Eisenberg E, Rosenthal JJC
RNA biology 2018 Jan 2;15(1):104-114
RNA biology 2018 Jan 2;15(1):104-114
Grafting of Bioactive Polymers with Various Architectures: A Versatile Tool for Preparing Antibacterial Infection and Biocompatible Surfaces.
Chouirfa H, Evans MDM, Bean P, Saleh-Mghir A, Crémieux AC, Castner DG, Falentin-Daudré C, Migonney V
ACS applied materials & interfaces 2018 Jan 17;10(2):1480-1491
ACS applied materials & interfaces 2018 Jan 17;10(2):1480-1491
Collagen COL22A1 maintains vascular stability and mutations in COL22A1 are potentially associated with intracranial aneurysms.
Ton QV, Leino D, Mowery SA, Bredemeier NO, Lafontant PJ, Lubert A, Gurung S, Farlow JL, Foroud TM, Broderick J, Sumanas S
Disease models & mechanisms 2018 Dec 12;11(12)
Disease models & mechanisms 2018 Dec 12;11(12)
Anti-diabetic Effects of Ethanol Extract from Bitter Melon in Mice Fed a High-fat Diet.
Yoon NA, Park J, Lee J, Jeong JY, Kim HK, Lee HS, Hwang IG, Roh GS, Kim HJ, Cho GJ, Choi WS, Lee DH, Kang SS
Development & reproduction 2017 Sep;21(3):259-267
Development & reproduction 2017 Sep;21(3):259-267
Reciprocal amplification of caspase-3 activity by nuclear export of a putative human RNA-modifying protein, PUS10 during TRAIL-induced apoptosis.
Jana S, Hsieh AC, Gupta R
Cell death & disease 2017 Oct 5;8(10):e3093
Cell death & disease 2017 Oct 5;8(10):e3093
INPP5E Preserves Genomic Stability through Regulation of Mitosis.
Sierra Potchanant EA, Cerabona D, Sater ZA, He Y, Sun Z, Gehlhausen J, Nalepa G
Molecular and cellular biology 2017 Mar 15;37(6)
Molecular and cellular biology 2017 Mar 15;37(6)
Inhibition of AURKA kinase activity suppresses collective invasion in a microfluidic cell culture platform.
Xia JL, Fan WJ, Zheng FM, Zhang WW, Xie JJ, Yang MY, Kamran M, Wang P, Teng HM, Wang CL, Liu Q
Scientific reports 2017 Jun 7;7(1):2973
Scientific reports 2017 Jun 7;7(1):2973
Endogenous AJAP1 associates with the cytoskeleton and attenuates angiogenesis in endothelial cells.
Hötte K, Smyrek I, Starzinski-Powitz A, Stelzer EHK
Biology open 2017 Jun 15;6(6):723-731
Biology open 2017 Jun 15;6(6):723-731
Inhibition of PIP4Kγ ameliorates the pathological effects of mutant huntingtin protein.
Al-Ramahi I, Giridharan SSP, Chen YC, Patnaik S, Safren N, Hasegawa J, de Haro M, Wagner Gee AK, Titus SA, Jeong H, Clarke J, Krainc D, Zheng W, Irvine RF, Barmada S, Ferrer M, Southall N, Weisman LS, Botas J, Marugan JJ
eLife 2017 Dec 26;6
eLife 2017 Dec 26;6
DTX3L is upregulated in glioma and is associated with glioma progression.
Xu P, Tao X, Zhao C, Huang Q, Chang H, Ban N, Bei Y, Xia X, Shen C, Wang K, Xu L, Wu P, Ren J, Wang D
International journal of molecular medicine 2017 Aug;40(2):491-498
International journal of molecular medicine 2017 Aug;40(2):491-498
Rho-associated protein kinase regulates subcellular localisation of Angiomotin and Hippo-signalling during preimplantation mouse embryo development.
Mihajlović AI, Bruce AW
Reproductive biomedicine online 2016 Sep;33(3):381-90
Reproductive biomedicine online 2016 Sep;33(3):381-90
Mechanism of Axonal Contractility in Embryonic Drosophila Motor Neurons In Vivo.
Tofangchi A, Fan A, Saif MTA
Biophysical journal 2016 Oct 4;111(7):1519-1527
Biophysical journal 2016 Oct 4;111(7):1519-1527
Forkhead Box O3A (FOXO3) and the Mitochondrial Disulfide Relay Carrier (CHCHD4) Regulate p53 Protein Nuclear Activity in Response to Exercise.
Zhuang J, Kamp WM, Li J, Liu C, Kang JG, Wang PY, Hwang PM
The Journal of biological chemistry 2016 Nov 25;291(48):24819-24827
The Journal of biological chemistry 2016 Nov 25;291(48):24819-24827
The sensitivity of the DNA damage checkpoint prevents oocyte maturation in endometriosis.
Hamdan M, Jones KT, Cheong Y, Lane SI
Scientific reports 2016 Nov 14;6:36994
Scientific reports 2016 Nov 14;6:36994
Human Cytomegalovirus Immediate-Early 1 Protein Rewires Upstream STAT3 to Downstream STAT1 Signaling Switching an IL6-Type to an IFNγ-Like Response.
Harwardt T, Lukas S, Zenger M, Reitberger T, Danzer D, Übner T, Munday DC, Nevels M, Paulus C
PLoS pathogens 2016 Jul;12(7):e1005748
PLoS pathogens 2016 Jul;12(7):e1005748
Adenomatous polyposis coli regulates radial axonal sorting and myelination in the PNS.
Elbaz B, Traka M, Kunjamma RB, Dukala D, Brosius Lutz A, Anton ES, Barres BA, Soliven B, Popko B
Development (Cambridge, England) 2016 Jul 1;143(13):2356-66
Development (Cambridge, England) 2016 Jul 1;143(13):2356-66
Maternal Smoke Exposure Impairs the Long-Term Fertility of Female Offspring in a Murine Model.
Camlin NJ, Sobinoff AP, Sutherland JM, Beckett EL, Jarnicki AG, Vanders RL, Hansbro PM, McLaughlin EA, Holt JE
Biology of reproduction 2016 Feb;94(2):39
Biology of reproduction 2016 Feb;94(2):39
Pellicle formation in the malaria parasite.
Kono M, Heincke D, Wilcke L, Wong TW, Bruns C, Herrmann S, Spielmann T, Gilberger TW
Journal of cell science 2016 Feb 15;129(4):673-80
Journal of cell science 2016 Feb 15;129(4):673-80
Resin embedded multicycle imaging (REMI): a tool to evaluate protein domains.
Busse BL, Bezrukov L, Blank PS, Zimmerberg J
Scientific reports 2016 Aug 8;6:30284
Scientific reports 2016 Aug 8;6:30284
Apolar and polar transitions drive the conversion between amoeboid and mesenchymal shapes in melanoma cells.
Cooper S, Sadok A, Bousgouni V, Bakal C
Molecular biology of the cell 2015 Nov 5;26(22):4163-70
Molecular biology of the cell 2015 Nov 5;26(22):4163-70
DNAM-1 controls NK cell activation via an ITT-like motif.
Zhang Z, Wu N, Lu Y, Davidson D, Colonna M, Veillette A
The Journal of experimental medicine 2015 Nov 16;212(12):2165-82
The Journal of experimental medicine 2015 Nov 16;212(12):2165-82
Mcl-1 is a key regulator of the ovarian reserve.
Omari S, Waters M, Naranian T, Kim K, Perumalsamy AL, Chi M, Greenblatt E, Moley KH, Opferman JT, Jurisicova A
Cell death & disease 2015 May 7;6(5):e1755
Cell death & disease 2015 May 7;6(5):e1755
A sensitised RNAi screen reveals a ch-TOG genetic interaction network required for spindle assembly.
Barr AR, Bakal C
Scientific reports 2015 Jun 3;5:10564
Scientific reports 2015 Jun 3;5:10564
Knockout of RNA Binding Protein MSI2 Impairs Follicle Development in the Mouse Ovary: Characterization of MSI1 and MSI2 during Folliculogenesis.
Sutherland JM, Sobinoff AP, Gunter KM, Fraser BA, Pye V, Bernstein IR, Boon E, Siddall NA, De Andres LI, Hime GR, Holt JE, Graf T, McLaughlin EA
Biomolecules 2015 Jun 26;5(3):1228-44
Biomolecules 2015 Jun 26;5(3):1228-44
Identification of a novel MET mutation in high-grade glioma resulting in an auto-active intracellular protein.
Navis AC, van Lith SA, van Duijnhoven SM, de Pooter M, Yetkin-Arik B, Wesseling P, Hendriks WJ, Venselaar H, Timmer M, van Cleef P, van Bergen En Henegouwen P, Best MG, Wurdinger TD, Tops BB, Leenders WP
Acta neuropathologica 2015 Jul;130(1):131-44
Acta neuropathologica 2015 Jul;130(1):131-44
Mitochondrial dysfunction in oocytes of obese mothers: transmission to offspring and reversal by pharmacological endoplasmic reticulum stress inhibitors.
Wu LL, Russell DL, Wong SL, Chen M, Tsai TS, St John JC, Norman RJ, Febbraio MA, Carroll J, Robker RL
Development (Cambridge, England) 2015 Feb 15;142(4):681-91
Development (Cambridge, England) 2015 Feb 15;142(4):681-91
Reprogramming cellular phenotype by soft collagen gels.
Ali MY, Chuang CY, Saif MT
Soft matter 2014 Nov 28;10(44):8829-37
Soft matter 2014 Nov 28;10(44):8829-37
Pharmacologic suppression of JAK1/2 by JAK1/2 inhibitor AZD1480 potently inhibits IL-6-induced experimental prostate cancer metastases formation.
Gu L, Talati P, Vogiatzi P, Romero-Weaver AL, Abdulghani J, Liao Z, Leiby B, Hoang DT, Mirtti T, Alanen K, Zinda M, Huszar D, Nevalainen MT
Molecular cancer therapeutics 2014 May;13(5):1246-58
Molecular cancer therapeutics 2014 May;13(5):1246-58
Characterization of the mitofusin 2 R94W mutation in a knock-in mouse model.
Strickland AV, Rebelo AP, Zhang F, Price J, Bolon B, Silva JP, Wen R, Züchner S
Journal of the peripheral nervous system : JPNS 2014 Jun;19(2):152-64
Journal of the peripheral nervous system : JPNS 2014 Jun;19(2):152-64
Motor protein mutations cause a new form of hereditary spastic paraplegia.
Caballero Oteyza A, Battaloğlu E, Ocek L, Lindig T, Reichbauer J, Rebelo AP, Gonzalez MA, Zorlu Y, Ozes B, Timmann D, Bender B, Woehlke G, Züchner S, Schöls L, Schüle R
Neurology 2014 Jun 3;82(22):2007-16
Neurology 2014 Jun 3;82(22):2007-16
IFT27, encoding a small GTPase component of IFT particles, is mutated in a consanguineous family with Bardet-Biedl syndrome.
Aldahmesh MA, Li Y, Alhashem A, Anazi S, Alkuraya H, Hashem M, Awaji AA, Sogaty S, Alkharashi A, Alzahrani S, Al Hazzaa SA, Xiong Y, Kong S, Sun Z, Alkuraya FS
Human molecular genetics 2014 Jun 15;23(12):3307-15
Human molecular genetics 2014 Jun 15;23(12):3307-15
A role for Ral GTPase-activating protein subunit β in mitotic regulation.
Personnic N, Lakisic G, Gouin E, Rousseau A, Gautreau A, Cossart P, Bierne H
The FEBS journal 2014 Jul;281(13):2977-89
The FEBS journal 2014 Jul;281(13):2977-89
Preclinical activity profile and therapeutic efficacy of the HSP90 inhibitor ganetespib in triple-negative breast cancer.
Proia DA, Zhang C, Sequeira M, Jimenez JP, He S, Spector N, Shapiro GI, Tolaney S, Nagai M, Acquaviva J, Smith DL, Sang J, Bates RC, El-Hariry I
Clinical cancer research : an official journal of the American Association for Cancer Research 2014 Jan 15;20(2):413-24
Clinical cancer research : an official journal of the American Association for Cancer Research 2014 Jan 15;20(2):413-24
Epithelial and stromal cells of bovine endometrium have roles in innate immunity and initiate inflammatory responses to bacterial lipopeptides in vitro via Toll-like receptors TLR2, TLR1, and TLR6.
Turner ML, Cronin JG, Healey GD, Sheldon IM
Endocrinology 2014 Apr;155(4):1453-65
Endocrinology 2014 Apr;155(4):1453-65
mTORC1 dependent regulation of REDD1 protein stability.
Tan CY, Hagen T
PloS one 2013;8(5):e63970
PloS one 2013;8(5):e63970
Effects of dual targeting of tumor cells and stroma in human glioblastoma xenografts with a tyrosine kinase inhibitor against c-MET and VEGFR2.
Navis AC, Bourgonje A, Wesseling P, Wright A, Hendriks W, Verrijp K, van der Laak JA, Heerschap A, Leenders WP
PloS one 2013;8(3):e58262
PloS one 2013;8(3):e58262
DNA damage response in male gametes of Cyrtanthus mackenii during pollen tube growth.
Hirano T, Takagi K, Hoshino Y, Abe T
AoB PLANTS 2013;5:plt004
AoB PLANTS 2013;5:plt004
Post-translational regulation of mTOR complex 1 in hypoxia and reoxygenation.
Tan CY, Hagen T
Cellular signalling 2013 May;25(5):1235-44
Cellular signalling 2013 May;25(5):1235-44
Atypical protein kinase Cι is required for Wnt3a-dependent neurite outgrowth and binds to phosphorylated dishevelled 2.
Greer YE, Fields AP, Brown AM, Rubin JS
The Journal of biological chemistry 2013 Mar 29;288(13):9438-46
The Journal of biological chemistry 2013 Mar 29;288(13):9438-46
Destabilization of CDC6 upon DNA damage is dependent on neddylation but independent of Cullin E3 ligases.
Tan CY, Hagen T
The international journal of biochemistry & cell biology 2013 Jul;45(7):1489-98
The international journal of biochemistry & cell biology 2013 Jul;45(7):1489-98
Cytostasis and morphological changes induced by mifepristone in human metastatic cancer cells involve cytoskeletal filamentous actin reorganization and impairment of cell adhesion dynamics.
Brandhagen BN, Tieszen CR, Ulmer TM, Tracy MS, Goyeneche AA, Telleria CM
BMC cancer 2013 Jan 26;13:35
BMC cancer 2013 Jan 26;13:35
Adenomatous polyposis coli regulates oligodendroglial development.
Lang J, Maeda Y, Bannerman P, Xu J, Horiuchi M, Pleasure D, Guo F
The Journal of neuroscience : the official journal of the Society for Neuroscience 2013 Feb 13;33(7):3113-30
The Journal of neuroscience : the official journal of the Society for Neuroscience 2013 Feb 13;33(7):3113-30
De novo generation of cells within human nurse macrophages and consequences following HIV-1 infection.
Gartner S, Liu Y, Natesan S
PloS one 2012;7(7):e40139
PloS one 2012;7(7):e40139
The mechanical behavior of mutant K14-R125P keratin bundles and networks in NEB-1 keratinocytes.
Beriault DR, Haddad O, McCuaig JV, Robinson ZJ, Russell D, Lane EB, Fudge DS
PloS one 2012;7(2):e31320
PloS one 2012;7(2):e31320
The role of the cullin-5 e3 ubiquitin ligase in the regulation of insulin receptor substrate-1.
Hu CZ, Sethi JK, Hagen T
Biochemistry research international 2012;2012:282648
Biochemistry research international 2012;2012:282648
APC(FZR1) prevents nondisjunction in mouse oocytes by controlling meiotic spindle assembly timing.
Holt JE, Lane SI, Jennings P, García-Higuera I, Moreno S, Jones KT
Molecular biology of the cell 2012 Oct;23(20):3970-81
Molecular biology of the cell 2012 Oct;23(20):3970-81
Estrous cycle-dependent changes of Fas expression in the bovine corpus luteum: influence of keratin 8/18 intermediate filaments and cytokines.
Duncan A, Forcina J, Birt A, Townson D
Reproductive biology and endocrinology : RB&E 2012 Oct 31;10:90
Reproductive biology and endocrinology : RB&E 2012 Oct 31;10:90
Timing of anaphase-promoting complex activation in mouse oocytes is predicted by microtubule-kinetochore attachment but not by bivalent alignment or tension.
Lane SI, Yun Y, Jones KT
Development (Cambridge, England) 2012 Jun;139(11):1947-55
Development (Cambridge, England) 2012 Jun;139(11):1947-55
Stat1 activation attenuates IL-6 induced Stat3 activity but does not alter apoptosis sensitivity in multiple myeloma.
Dimberg LY, Dimberg A, Ivarsson K, Fryknäs M, Rickardson L, Tobin G, Ekman S, Larsson R, Gullberg U, Nilsson K, Öberg F, Wiklund HJ
BMC cancer 2012 Jul 28;12:318
BMC cancer 2012 Jul 28;12:318
Combined expression of KLK4, KLK5, KLK6, and KLK7 by ovarian cancer cells leads to decreased adhesion and paclitaxel-induced chemoresistance.
Loessner D, Quent VM, Kraemer J, Weber EC, Hutmacher DW, Magdolen V, Clements JA
Gynecologic oncology 2012 Dec;127(3):569-78
Gynecologic oncology 2012 Dec;127(3):569-78
A unique ball-shaped Golgi apparatus in the rat pituitary gonadotrope: its functional implications in relation to the arrangement of the microtubule network.
Watanabe T, Sakai Y, Koga D, Bochimoto H, Hira Y, Hosaka M, Ushiki T
The journal of histochemistry and cytochemistry : official journal of the Histochemistry Society 2012 Aug;60(8):588-602
The journal of histochemistry and cytochemistry : official journal of the Histochemistry Society 2012 Aug;60(8):588-602
CBP/p300 and SIRT1 are involved in transcriptional regulation of S-phase specific histone genes.
He H, Yu FX, Sun C, Luo Y
PloS one 2011;6(7):e22088
PloS one 2011;6(7):e22088
Centrosomal dysregulation in human metastatic melanoma cell lines.
Charters GA, Stones CJ, Shelling AN, Baguley BC, Finlay GJ
Cancer genetics 2011 Sep;204(9):477-85
Cancer genetics 2011 Sep;204(9):477-85
Corticotropin releasing factor-induced CREB activation in striatal neurons occurs via a novel Gβγ signaling pathway.
Stern CM, Luoma JI, Meitzen J, Mermelstein PG
PloS one 2011 Mar 23;6(3):e18114
PloS one 2011 Mar 23;6(3):e18114
Increased susceptibility to cortical spreading depression in the mouse model of familial hemiplegic migraine type 2.
Leo L, Gherardini L, Barone V, De Fusco M, Pietrobon D, Pizzorusso T, Casari G
PLoS genetics 2011 Jun;7(6):e1002129
PLoS genetics 2011 Jun;7(6):e1002129
Neddylation-induced conformational control regulates cullin RING ligase activity in vivo.
Boh BK, Smith PG, Hagen T
Journal of molecular biology 2011 Jun 3;409(2):136-45
Journal of molecular biology 2011 Jun 3;409(2):136-45
An overlapping reading frame in the PRNP gene encodes a novel polypeptide distinct from the prion protein.
Vanderperre B, Staskevicius AB, Tremblay G, McCoy M, O'Neill MA, Cashman NR, Roucou X
FASEB journal : official publication of the Federation of American Societies for Experimental Biology 2011 Jul;25(7):2373-86
FASEB journal : official publication of the Federation of American Societies for Experimental Biology 2011 Jul;25(7):2373-86
SNARE-mediated membrane traffic is required for focal adhesion kinase signaling and Src-regulated focal adhesion turnover.
Skalski M, Sharma N, Williams K, Kruspe A, Coppolino MG
Biochimica et biophysica acta 2011 Jan;1813(1):148-58
Biochimica et biophysica acta 2011 Jan;1813(1):148-58
Regulation of cullin RING E3 ubiquitin ligases by CAND1 in vivo.
Chua YS, Boh BK, Ponyeam W, Hagen T
PloS one 2011 Jan 13;6(1):e16071
PloS one 2011 Jan 13;6(1):e16071
Characterization of the role of COP9 signalosome in regulating cullin E3 ubiquitin ligase activity.
Choo YY, Boh BK, Lou JJ, Eng J, Leck YC, Anders B, Smith PG, Hagen T
Molecular biology of the cell 2011 Dec;22(24):4706-15
Molecular biology of the cell 2011 Dec;22(24):4706-15
Essential role of protein phosphatase 2A in metaphase II arrest and activation of mouse eggs shown by okadaic acid, dominant negative protein phosphatase 2A, and FTY720.
Chang HY, Jennings PC, Stewart J, Verrills NM, Jones KT
The Journal of biological chemistry 2011 Apr 22;286(16):14705-12
The Journal of biological chemistry 2011 Apr 22;286(16):14705-12
Protein kinase A-mediated phosphorylation of the RASSF1A tumour suppressor at Serine 203 and regulation of RASSF1A function.
Richter AM, Schagdarsurengin U, Rastetter M, Steinmann K, Dammann RH
European journal of cancer (Oxford, England : 1990) 2010 Nov;46(16):2986-95
European journal of cancer (Oxford, England : 1990) 2010 Nov;46(16):2986-95
Sperm dimorphism in terms of nuclear shape and microtubule accumulation in Cyrtanthus mackenii.
Hirano T, Hoshino Y
Sexual plant reproduction 2010 Jun;23(2):153-62
Sexual plant reproduction 2010 Jun;23(2):153-62
Biochemical and cellular effects of inhibiting Nedd8 conjugation.
Leck YC, Choo YY, Tan CY, Smith PG, Hagen T
Biochemical and biophysical research communications 2010 Jul 30;398(3):588-93
Biochemical and biophysical research communications 2010 Jul 30;398(3):588-93
A spatio-temporal analysis of matrix protein and nucleocapsid trafficking during vesicular stomatitis virus uncoating.
Mire CE, White JM, Whitt MA
PLoS pathogens 2010 Jul 15;6(7):e1000994
PLoS pathogens 2010 Jul 15;6(7):e1000994
Amino terminal hydrophobic import signals target the p14(ARF) tumor suppressor to the mitochondria.
Irvine M, Philipsz S, Frausto M, Mijatov B, Gallagher SJ, Fung C, Becker TM, Kefford RF, Rizos H
Cell cycle (Georgetown, Tex.) 2010 Feb 15;9(4):829-39
Cell cycle (Georgetown, Tex.) 2010 Feb 15;9(4):829-39
Thioredoxin-interacting protein (Txnip) gene expression: sensing oxidative phosphorylation status and glycolytic rate.
Yu FX, Chai TF, He H, Hagen T, Luo Y
The Journal of biological chemistry 2010 Aug 13;285(33):25822-30
The Journal of biological chemistry 2010 Aug 13;285(33):25822-30
Calmodulin-dependent protein kinase gamma 3 (CamKIIgamma3) mediates the cell cycle resumption of metaphase II eggs in mouse.
Chang HY, Minahan K, Merriman JA, Jones KT
Development (Cambridge, England) 2009 Dec;136(24):4077-81
Development (Cambridge, England) 2009 Dec;136(24):4077-81
p16INK4a-induced senescence is disabled by melanoma-associated mutations.
Haferkamp S, Becker TM, Scurr LL, Kefford RF, Rizos H
Aging cell 2008 Oct;7(5):733-45
Aging cell 2008 Oct;7(5):733-45
Biomechanical analysis of cancerous and normal cells based on bulge generation in a microfluidic device.
Kim YC, Park SJ, Park JK
The Analyst 2008 Oct;133(10):1432-9
The Analyst 2008 Oct;133(10):1432-9
Regulation of FE65 nuclear translocation and function by amyloid beta-protein precursor in osmotically stressed cells.
Nakaya T, Kawai T, Suzuki T
The Journal of biological chemistry 2008 Jul 4;283(27):19119-31
The Journal of biological chemistry 2008 Jul 4;283(27):19119-31
Impairment of the telomere/telomerase system and genomic instability are associated with keratinocyte immortalization induced by the skin human papillomavirus type 38.
Gabet AS, Accardi R, Bellopede A, Popp S, Boukamp P, Sylla BS, Londoño-Vallejo JA, Tommasino M
FASEB journal : official publication of the Federation of American Societies for Experimental Biology 2008 Feb;22(2):622-32
FASEB journal : official publication of the Federation of American Societies for Experimental Biology 2008 Feb;22(2):622-32
Localization of C. trachomatis Inc proteins in expression of their genes in HeLa cell culture.
Shkarupeta MM, Kostrjukova ES, Lazarev VN, Levitskii SA, Basovskii YI, Govorun VM
Bulletin of experimental biology and medicine 2008 Aug;146(2):237-42
Bulletin of experimental biology and medicine 2008 Aug;146(2):237-42
New isoforms of rat Aquaporin-4.
Moe SE, Sorbo JG, Sogaard R, Zeuthen T, Petter Ottersen O, Holen T
Genomics 2008 Apr;91(4):367-77
Genomics 2008 Apr;91(4):367-77
A role for CK2 upon interkinetic nuclear migration in the cell cycle of retinal progenitor cells.
Carneiro AC, Fragel-Madeira L, Silva-Neto MA, Linden R
Developmental neurobiology 2008 Apr;68(5):620-31
Developmental neurobiology 2008 Apr;68(5):620-31
Wnt-3a and Dickkopf-1 stimulate neurite outgrowth in Ewing tumor cells via a Frizzled3- and c-Jun N-terminal kinase-dependent mechanism.
Endo Y, Beauchamp E, Woods D, Taylor WG, Toretsky JA, Uren A, Rubin JS
Molecular and cellular biology 2008 Apr;28(7):2368-79
Molecular and cellular biology 2008 Apr;28(7):2368-79
Development of an AT2-deficient proximal tubule cell line for transport studies.
Woost PG, Kolb RJ, Chang CH, Finesilver M, Inagami T, Hopfer U
In vitro cellular & developmental biology. Animal 2007 Nov-Dec;43(10):352-60
In vitro cellular & developmental biology. Animal 2007 Nov-Dec;43(10):352-60
Fluorescence nanoscopy in whole cells by asynchronous localization of photoswitching emitters.
Egner A, Geisler C, von Middendorff C, Bock H, Wenzel D, Medda R, Andresen M, Stiel AC, Jakobs S, Eggeling C, Schönle A, Hell SW
Biophysical journal 2007 Nov 1;93(9):3285-90
Biophysical journal 2007 Nov 1;93(9):3285-90
A cassette system to study embryonic stem cell differentiation by inducible RNA interference.
Wegmüller D, Raineri I, Gross B, Oakeley EJ, Moroni C
Stem cells (Dayton, Ohio) 2007 May;25(5):1178-85
Stem cells (Dayton, Ohio) 2007 May;25(5):1178-85
Characterization of cullin-based E3 ubiquitin ligases in intact mammalian cells--evidence for cullin dimerization.
Chew EH, Poobalasingam T, Hawkey CJ, Hagen T
Cellular signalling 2007 May;19(5):1071-80
Cellular signalling 2007 May;19(5):1071-80
A mutation in CCDC50, a gene encoding an effector of epidermal growth factor-mediated cell signaling, causes progressive hearing loss.
Modamio-Hoybjor S, Mencia A, Goodyear R, del Castillo I, Richardson G, Moreno F, Moreno-Pelayo MA
American journal of human genetics 2007 Jun;80(6):1076-89
American journal of human genetics 2007 Jun;80(6):1076-89
Pollen tube growth: coping with mechanical obstacles involves the cytoskeleton.
Gossot O, Geitmann A
Planta 2007 Jul;226(2):405-16
Planta 2007 Jul;226(2):405-16
Distinct roles of TIR and non-TIR regions in the subcellular localization and signaling properties of MyD88.
Nishiya T, Kajita E, Horinouchi T, Nishimoto A, Miwa S
FEBS letters 2007 Jul 10;581(17):3223-9
FEBS letters 2007 Jul 10;581(17):3223-9
Effect of paclitaxel on intracellular localization of c-Myc and P-c-Myc in prostate carcinoma cell lines.
Supino R, Favini E, Cuccuru G, Zunino F, Scovassi AI
Annals of the New York Academy of Sciences 2007 Jan;1095:175-81
Annals of the New York Academy of Sciences 2007 Jan;1095:175-81
Paclitaxel induced apoptosis in breast cancer cells requires cell cycle transit but not Cdc2 activity.
Henley D, Isbill M, Fernando R, Foster JS, Wimalasena J
Cancer chemotherapy and pharmacology 2007 Feb;59(2):235-49
Cancer chemotherapy and pharmacology 2007 Feb;59(2):235-49
Membrane localization of adenomatous polyposis coli protein at cellular protrusions: targeting sequences and regulation by beta-catenin.
Sharma M, Leung L, Brocardo M, Henderson J, Flegg C, Henderson BR
The Journal of biological chemistry 2006 Jun 23;281(25):17140-17149
The Journal of biological chemistry 2006 Jun 23;281(25):17140-17149
Comprehensive examination of charged intramembrane residues in a nucleoside transporter.
Valdés R, Liu W, Ullman B, Landfear SM
The Journal of biological chemistry 2006 Aug 11;281(32):22647-55
The Journal of biological chemistry 2006 Aug 11;281(32):22647-55
The transmembrane domain is essential for the microtubular trafficking of membrane type-1 matrix metalloproteinase (MT1-MMP).
Remacle AG, Rozanov DV, Baciu PC, Chekanov AV, Golubkov VS, Strongin AY
Journal of cell science 2005 Nov 1;118(Pt 21):4975-84
Journal of cell science 2005 Nov 1;118(Pt 21):4975-84
COMMD proteins, a novel family of structural and functional homologs of MURR1.
Burstein E, Hoberg JE, Wilkinson AS, Rumble JM, Csomos RA, Komarck CM, Maine GN, Wilkinson JC, Mayo MW, Duckett CS
The Journal of biological chemistry 2005 Jun 10;280(23):22222-32
The Journal of biological chemistry 2005 Jun 10;280(23):22222-32
Regulation of two insulin granule populations within the reserve pool by distinct calcium sources.
Hao M, Li X, Rizzo MA, Rocheleau JV, Dawant BM, Piston DW
Journal of cell science 2005 Dec 15;118(Pt 24):5873-84
Journal of cell science 2005 Dec 15;118(Pt 24):5873-84
Using single-particle tracking to study nuclear trafficking of viral genes.
Babcock HP, Chen C, Zhuang X
Biophysical journal 2004 Oct;87(4):2749-58
Biophysical journal 2004 Oct;87(4):2749-58
Pigment cells: a model for the study of organelle transport.
Nascimento AA, Roland JT, Gelfand VI
Annual review of cell and developmental biology 2003;19:469-91
Annual review of cell and developmental biology 2003;19:469-91
Simultaneous trichromatic fluorescence detection of proteins on Western blots using an amine-reactive dye in combination with alkaline phosphatase- and horseradish peroxidase-antibody conjugates.
Martin K, Hart C, Liu J, Leung WY, Patton WF
Proteomics 2003 Jul;3(7):1215-27
Proteomics 2003 Jul;3(7):1215-27
Mammalian ykt6 is a neuronal SNARE targeted to a specialized compartment by its profilin-like amino terminal domain.
Hasegawa H, Zinsser S, Rhee Y, Vik-Mo EO, Davanger S, Hay JC
Molecular biology of the cell 2003 Feb;14(2):698-720
Molecular biology of the cell 2003 Feb;14(2):698-720
Inhibition of tumor necrosis factor alpha-mediated NFkappaB activation and leukocyte adhesion, with enhanced endothelial apoptosis, by G protein-linked receptor (TP) ligands.
Ashton AW, Ware GM, Kaul DK, Ware JA
The Journal of biological chemistry 2003 Apr 4;278(14):11858-66
The Journal of biological chemistry 2003 Apr 4;278(14):11858-66
A phosphatidylinositol (4,5)-bisphosphate binding site within mu2-adaptin regulates clathrin-mediated endocytosis.
Rohde G, Wenzel D, Haucke V
The Journal of cell biology 2002 Jul 22;158(2):209-14
The Journal of cell biology 2002 Jul 22;158(2):209-14
Spastin, the protein mutated in autosomal dominant hereditary spastic paraplegia, is involved in microtubule dynamics.
Errico A, Ballabio A, Rugarli EI
Human molecular genetics 2002 Jan 15;11(2):153-63
Human molecular genetics 2002 Jan 15;11(2):153-63
Distinct regions in the 3' untranslated region are responsible for targeting and stabilizing utrophin transcripts in skeletal muscle cells.
Gramolini AO, Bélanger G, Jasmin BJ
The Journal of cell biology 2001 Sep 17;154(6):1173-83
The Journal of cell biology 2001 Sep 17;154(6):1173-83
Control of intracellular movement of connexins by E-cadherin in murine skin papilloma cells.
Hernandez-Blazquez FJ, Joazeiro PP, Omori Y, Yamasaki H
Experimental cell research 2001 Nov 1;270(2):235-47
Experimental cell research 2001 Nov 1;270(2):235-47
Temperature-dependent arrest of neutrophil apoptosis. Failure of Bax insertion into mitochondria at 15 degrees C prevents the release of cytochrome c.
Pryde JG, Walker A, Rossi AG, Hannah S, Haslett C
The Journal of biological chemistry 2000 Oct 27;275(43):33574-84
The Journal of biological chemistry 2000 Oct 27;275(43):33574-84
S100A6 and S100A11 are specific targets of the calcium- and zinc-binding S100B protein in vivo.
Deloulme JC, Assard N, Mbele GO, Mangin C, Kuwano R, Baudier J
The Journal of biological chemistry 2000 Nov 10;275(45):35302-10
The Journal of biological chemistry 2000 Nov 10;275(45):35302-10
Distinct FTDP-17 missense mutations in tau produce tau aggregates and other pathological phenotypes in transfected CHO cells.
Vogelsberg-Ragaglia V, Bruce J, Richter-Landsberg C, Zhang B, Hong M, Trojanowski JQ, Lee VM
Molecular biology of the cell 2000 Dec;11(12):4093-104
Molecular biology of the cell 2000 Dec;11(12):4093-104
Alexa dyes, a series of new fluorescent dyes that yield exceptionally bright, photostable conjugates.
Panchuk-Voloshina N, Haugland RP, Bishop-Stewart J, Bhalgat MK, Millard PJ, Mao F, Leung WY, Haugland RP
The journal of histochemistry and cytochemistry : official journal of the Histochemistry Society 1999 Sep;47(9):1179-88
The journal of histochemistry and cytochemistry : official journal of the Histochemistry Society 1999 Sep;47(9):1179-88
The EF-hand Ca(2+)-binding protein p22 associates with microtubules in an N-myristoylation-dependent manner.
Timm S, Titus B, Bernd K, Barroso M
Molecular biology of the cell 1999 Oct;10(10):3473-88
Molecular biology of the cell 1999 Oct;10(10):3473-88
A luminescent ruthenium complex for ultrasensitive detection of proteins immobilized on membrane supports.
Berggren K, Steinberg TH, Lauber WM, Carroll JA, Lopez MF, Chernokalskaya E, Zieske L, Diwu Z, Haugland RP, Patton WF
Analytical biochemistry 1999 Dec 15;276(2):129-43
Analytical biochemistry 1999 Dec 15;276(2):129-43
APO2.7 defines a shared apoptotic-necrotic pathway in a breast tumor hypoxia model.
Koester SK, Schlossman SF, Zhang C, Decker SJ, Bolton WE
Cytometry 1998 Nov 1;33(3):324-32
Cytometry 1998 Nov 1;33(3):324-32
Zygotic expression of the pebble locus is required for cytokinesis during the postblastoderm mitoses of Drosophila.
Hime G, Saint R
Development (Cambridge, England) 1992 Jan;114(1):165-71
Development (Cambridge, England) 1992 Jan;114(1):165-71
No comments: Submit comment
Supportive validation
- Submitted by
- Invitrogen Antibodies (provider)
- Main image

- Experimental details
- Immunodetection using the Amplex® Gold Western Blot Stain Kit #1 (Product # A21890). Samples of protein molecular weight standards (Product # P-6649) containing decreasing amounts of a-tubulin were run on an SDS-polyacrylamide gel and blotted onto a PVDF membrane. The blot was incubated with a mouse monoclonal anti-a-tubulin antibody (Product # A11126), followed by a horseradish peroxidase conjugate of goat anti-mouse IgG antibody, which is included in the kit. Finally, the blot was stained with the Amplex® Gold reagent and photographed.

- Submitted by
- Invitrogen Antibodies (provider)
- Main image

- Experimental details
- Western blot analysis of alpha-Tubulin was performed by loading 20 µg of A431 (lane1), Raji (lane2), MDA-MB-231 (lane3), HCT 116 (lane4), HeLa (lane5), DU 145 (lane6), PC-3 (lane7) and Caco-2 (lane8) cell lysate using Novex®NuPAGE® 12 % Bis-Tris gel (Product # NP0341BOX), XCell SureLock Electrophoresis System (Product # EI0002), Novex® Sharp Pre-Stained Protein Standard (LC5800), and iBlot® Dry Blotting System (IB21001). Proteins were transferred to a nitrocellulose membrane and blocked with 5% skim milk at 4°C overnight. alpha-Tubulin was detected at ~ 52 kDa using alpha-Tubulin Mouse Monoclonal Antibody (Product # A11126) at 1:3000 dilution in 5% skim milk for 3 hour at room temperature on a rocking platform. Goat Anti-Mouse - HRP Secondary Antibody (Product # 62-6520) at 1:4000 dilution was used and chemiluminescent detection was performed using Pierce™ ECL Western Blotting Substrate (Product # 32106).

- Submitted by
- Invitrogen Antibodies (provider)
- Main image
- Experimental details
- Protein detection with the DyeChrome™ Western Blot Stain Kit #4 (Product # D21884). Samples of protein molecular weight standards (Product # P-6649) containing decreasing amounts of a-tubulin were run on an SDS-polyacrylamide gel and blotted onto a PVDF membrane. After electrophoresis, the blot was stained with BODIPY® TR-X, succinimidyl ester (red signal), to detect total protein. After staining, the blot was incubated with a mouse monoclonal anti-a-tubulin antibody (Product # A11126), followed by an alkaline phosphatase conjugate of goat anti-mouse IgG antibody, which is included in the kit. Finally, the blot was stained with ELF® 39 phosphate (green signal) to detect the alkaline phosphatase enzyme. The signal was visualized under UV epi-illumination. The two fluorescent signals were captured separately, using the DyeChrome™ Red/Green Photographic Filter Set (Product # D24771), and the two resulting digital images were overlaid using Adobe Photoshop software.

- Submitted by
- Invitrogen Antibodies (provider)
- Main image
- Experimental details
- Immunodetection on a Western blot with the BOLD APB chemiluminescent substrate. Samples of protein molecular weight standards (Product # P-6649) containing decreasing amounts of a-tubulin were run on an SDS-polyacrylamide gel and blotted onto a PVDF membrane. After electrophoresis, the blot was stained with SYPRO® Ruby protein blot stain (Product # S-11791) to detect total protein. After documentation of the total protein stain (top), the blot was incubated with a mouse monoclonal anti-a-tubulin antibody (Product # A11126), followed by an alkaline phosphatase conjugate of goat anti-mouse IgG antibody (Product # G-21060). Finally, the blot was stained with the BOLD APB chemiluminescent substrate (Product # B21901) to detect the alkaline phosphatase enzyme. The chemiluminescent signal was visualized using a scanner in chemiluminescence detection mode.

- Submitted by
- Invitrogen Antibodies (provider)
- Main image

- Experimental details
- Immunodetection using the Amplex® Gold Western Blot Stain Kit #1 (Product # A21890). Samples of protein molecular weight standards (Product # P-6649) containing decreasing amounts of a-tubulin were run on an SDS-polyacrylamide gel and blotted onto a PVDF membrane. The blot was incubated with a mouse monoclonal anti-a-tubulin antibody (Product # A11126), followed by a horseradish peroxidase conjugate of goat anti-mouse IgG antibody, which is included in the kit. Finally, the blot was stained with the Amplex® Gold reagent and photographed.

Supportive validation
- Submitted by
- Invitrogen Antibodies (provider)
- Main image
- Experimental details
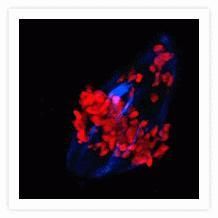
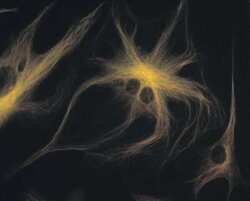
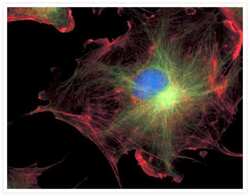
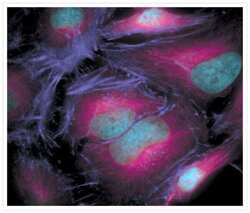
- Microtubules of fixed bovine pulmonary artery endothelial cells localized with mouse monoclonal anti-a-tubulin antibody (Product # A11126), which was subsequently visualized with Alexa Fluor 350 goat anti-mouse IgG antibody (Product # A-11045). Next, the F-actin was labeled with Alexa Fluor 594 phalloidin (Product # A12381). Finally, the cells were incubated with Alexa Fluor 488 wheat germ agglutinin (W11261) to stain components of endosomal pathways. The superimposed and pseudocolored images were acquired sequentially using bandpass filter sets appropriate for DAPI, the Texas Red dye and FITC, respectively.

- Submitted by
- Invitrogen Antibodies (provider)
- Main image

- Experimental details
- Microtubules of bovine pulmonary artery endothelial cells that have been labeled with mouse monoclonal anti-a-tubulin antibody (Product # A11126), followed by biotin-XX goat anti-mouse IgG antibody (Product # B-2763), and then visualized with Marina Blue® streptavidin (Product # S-11221). The cells were next treated with RNase, and the chromosomes were labeled with TO-PRO®-3 iodide (Product # T3605). A series of Z-plane images was acquired with a wide-field optical sectioning confocal laser-scanning microscope. A three-dimensional volume rendering was generated from the deconvolved image series.
- Submitted by
- Invitrogen Antibodies (provider)
- Main image
- Experimental details
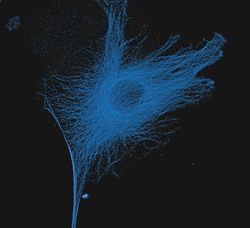
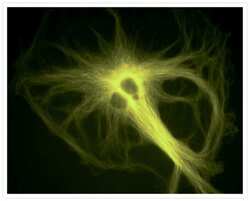
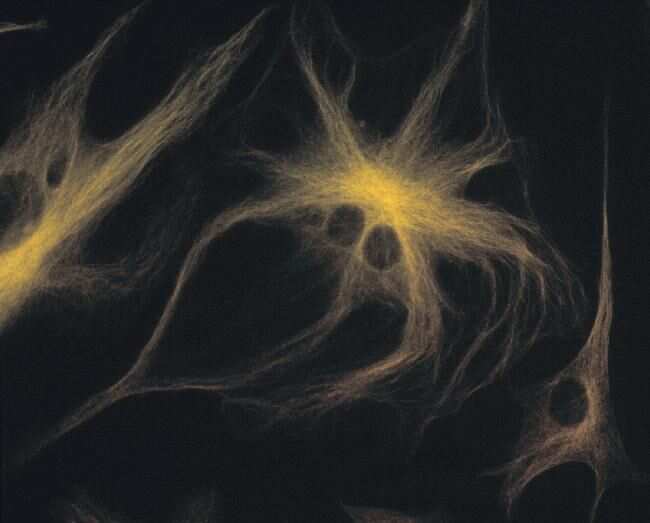
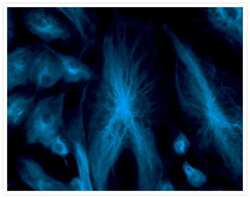
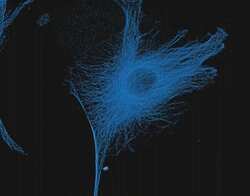
- The microtubules of fixed bovine pulmonary artery endothelial cells (BPAEC) localized with mouse monoclonal anti-a-tubulin antibody (Product # A11126), which was visualized with Alexa Fluor® 350 goat anti-mouse IgG antibody (Product # A-11045). The image was acquired using a longpass filter set appropriate for DAPI. The image was deconvolved using Huygens software (Scientific Volume Imaging, www.svi.nl).

- Submitted by
- Invitrogen Antibodies (provider)
- Main image

- Experimental details
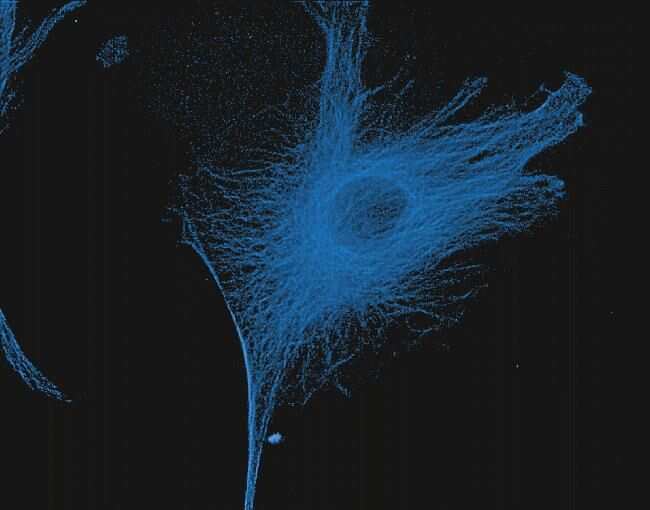
- The microtubules of fixed bovine pulmonary artery endothelial cells (BPAEC) localized with mouse monoclonal anti-a-tubulin antibody (Product # A11126), which was visualized with Alexa Fluor® 350 goat anti-mouse IgG antibody (Product # A-11045). The image was acquired using a longpass filter set appropriate for DAPI. The image was deconvolved using Huygens software (Scientific Volume Imaging, www.svi.nl).

- Submitted by
- Invitrogen Antibodies (provider)
- Main image
- Experimental details
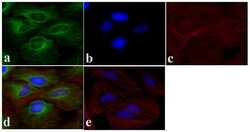
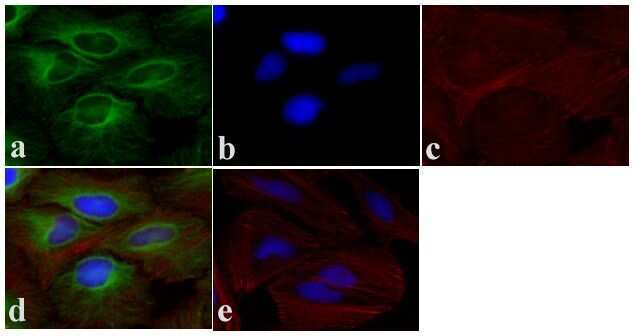
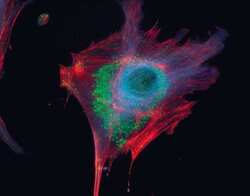
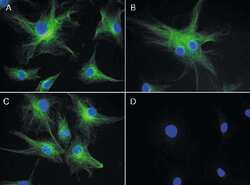
- Immunofluorescent analysis of Alpha-Tubulin was done on 70% confluent log phase HeLa cells. The cells were fixed with 4% paraformaldehyde for 15 minutes, permeabilized with 0.25% Triton X-100 for 10 minutes, and blocked with 5% BSA for 1 hour at room temperature. The cells were labeled with Alpha-Tubulin Mouse monoclonal Antibody (Product # A11126) at 1 µg/mL in 1% BSA and incubated for 3 hours at room temperature and then labeled with Alexa Fluor 488 Rabbit Anti-Mouse IgG Secondary Antibody (Product # A-11059) at a dilution of 1:400 for 30 minutes at room temperature (Panel a: green). Nuclei (Panel b: blue) were stained with SlowFade® Gold Antifade Mountant DAPI (Product # S36938). F-actin (Panel c: red) was stained with Alexa Fluor 594 Phalloidin (Product # A12381). Panel d is a merged image showing cytoplasmic localization. Panel e shows no primary antibody control. The images were captured at 20X magnification.
- Submitted by
- Invitrogen Antibodies (provider)
- Main image

- Experimental details
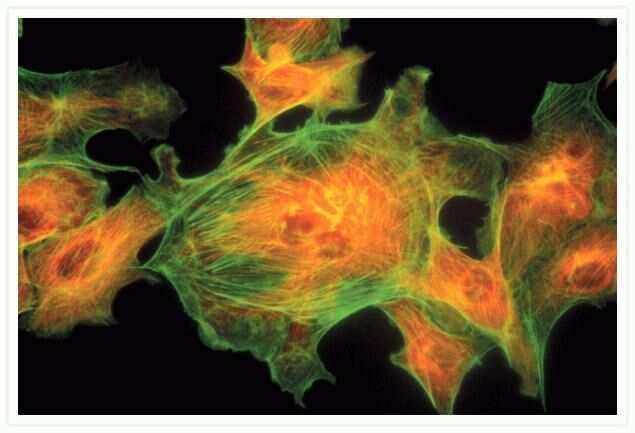
- Bovine pulmonary artery endothelial cells were labeled with Alexa Fluor® 488 phalloidin (Product # A12379) to stain F-actin and our mouse monoclonal anti-a-tubulin antibody (Product # A11126) in combination with Alexa Fluor® 594 dye-conjugated F (ab')2 fragment of goat anti-mouse IgG antibody (Product # A-11020) to stain microtubules. The multiple-exposure image was acquired using bandpass filter sets appropriate for Texas Red® dye and FITC.
- Submitted by
- Invitrogen Antibodies (provider)
- Main image
- Experimental details
- Microtubules of fixed bovine pulmonary artery endothelial cells localized with mouse monoclonal anti-a-tubulin antibody (Product # A11126), which was subsequently visualized with Alexa Fluor 350 goat anti-mouse IgG antibody (Product # A-11045). Next, the F-actin was labeled with Alexa Fluor 594 phalloidin (Product # A12381). Finally, the cells were incubated with Alexa Fluor 488 wheat germ agglutinin (W11261) to stain components of endosomal pathways. The superimposed and pseudocolored images were acquired sequentially using bandpass filter sets appropriate for DAPI, the Texas Red dye and FITC, respectively.

- Submitted by
- Invitrogen Antibodies (provider)
- Main image
- Experimental details
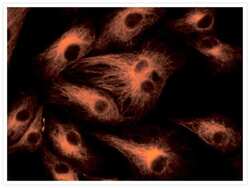
- A bovine pulmonary artery endothelial (BPAE) cell labeled with mouse monoclonal anti-a-tubulin antibody (Product # A11126) in combination with Alexa Fluor® 430 goat anti-mouse IgG antibody (Product # A-11063) to stain microtubules. The image was acquired using a longpass filter set allowing excitation at 455 ± 35 nm and emission at wavelengths greater than 515 nm.

- Submitted by
- Invitrogen Antibodies (provider)
- Main image

- Experimental details
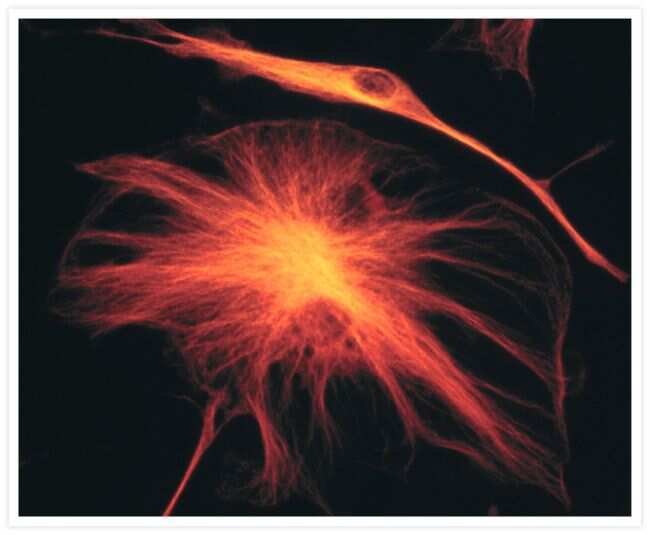
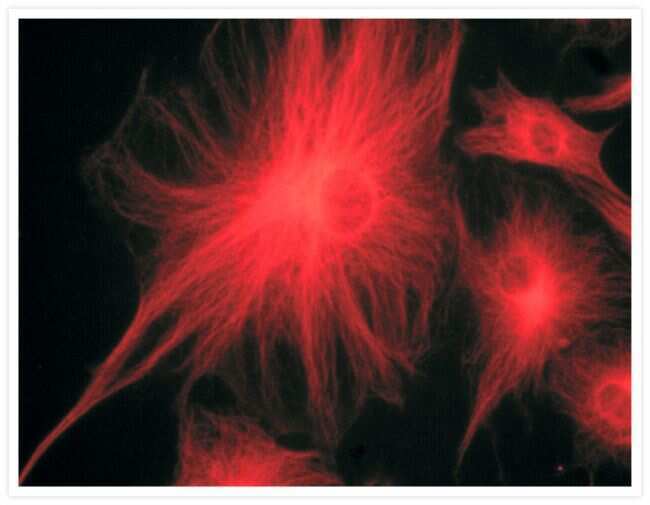
- The microtubules of fixed bovine pulmonary artery endothelial cells were labeled with a mouse monoclonal anti-a-tubulin antibody (Product # A11126), which was visualized with Alexa Fluor® 546 goat anti-mouse IgG antibody (Product # A-11003). The image was acquired using a bandpass filter set appropriate for rhodamine.
- Submitted by
- Invitrogen Antibodies (provider)
- Main image
- Experimental details
- A bovine pulmonary artery endothelial cell labeled with mouse monoclonal anti-a-tubulin antibody (Product # A11126) in combination with Alexa Fluor 532 goat anti-mouse IgG antibody (Product # A-11002) to stain microtubules. The image was acquired using a bandpass filter set (excitation/emission 535 +- 17.5/590 +- 17.5 nm).
- Submitted by
- Invitrogen Antibodies (provider)
- Main image

- Experimental details
- A bovine pulmonary artery endothelial cell labeled with mouse monoclonal anti-a-tubulin antibody (Product # A11126) in combination with Alexa Fluor® 568 goat anti-mouse IgG (Product # A-11004) to stain microtubules. The image was acquired using a bandpass filter set appropriate for X-rhodamine.
- Submitted by
- Invitrogen Antibodies (provider)
- Main image

- Experimental details
- Microtubules of fixed bovine pulmonary artery endothelial cells were labeled with our mouse monoclonal anti-a-tubulin antibody (Product # A11126), detected with the biotin-XX-conjugated F (ab)2 fragment of goat anti-mouse IgG antibody (Product # B11027) and visualized with Alexa Fluor® 488 streptavidin (Product # S-11223). The actin filaments were then labeled with orange-fluorescent Alexa Fluor® 568 phalloidin (Product # A12380), and the cell was counterstained with blue-fluorescent Hoechst 33342 (Product # H1399, H3570, H21492) to image the DNA, and red-fluorescent propidium iodide (Product # P1304MP, P3566, P21493) to image the nucleolar RNA. The multiple-exposure image was acquired using bandpass filters appropriate for the Texas Red® dye, FITC, and DAPI.
- Submitted by
- Invitrogen Antibodies (provider)
- Main image
- Experimental details
- FluoCells® prepared slide #2 (Product # F-14781) showing bovine pulmonary artery endothelial cells probed with anti-bovine a-tubulin mouse monoclonal 236-10501 (Product # A11126) and visualized with BODIPY® FL goat anti-mouse IgG (Product # B-2752). The actin filaments were then labeled with Texas Red®-X phalloidin (Product # T7471) and the nuclei were counterstained with DAPI (Product # D1306, D3571). The multiple-exposure image was acquired using bandpass filters appropriate for Texas Red® dye, FITC and DAPI.

- Submitted by
- Invitrogen Antibodies (provider)
- Main image

- Experimental details
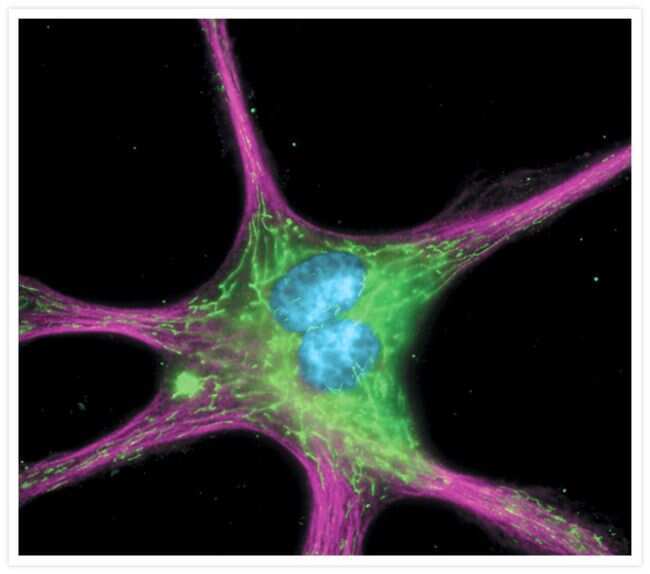
- Bovine pulmonary endothelial cell in early prophase, stained with a combination of fluorescent dyes. The chromosomes were stained with SYTO® 16 green-fluorescent nucleic acid stain (Product # S7578) and the mitochondria were identified with MitoTracker® CMXRos (Product # M-7512). Finally, the cytoskeleton was detected with mouse monoclonal anti-a-tubulin antibody (Product # A11126), which was visualized using blue-fluorescent Alexa Fluor® 350 goat anti-mouse IgG (Product # A-11045). The multiple-exposure image was acquired using filter sets appropriate for Texas Red® dye, FITC and DAPI.

- Submitted by
- Invitrogen Antibodies (provider)
- Main image

- Experimental details
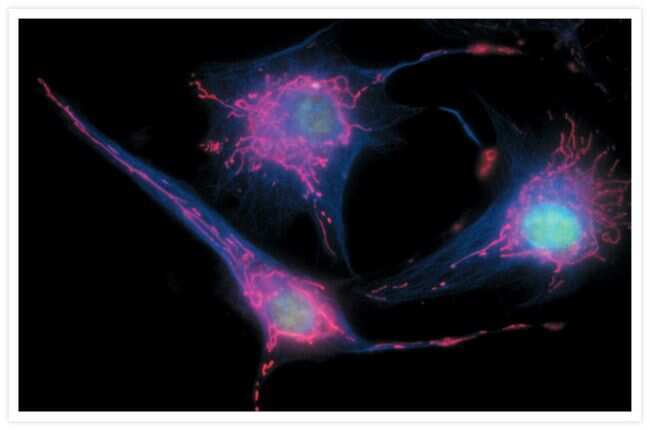
- Bovine pulmonary endothelial cells incubated with the fixable, mitochondrion-selective MitoTracker® Red CMXRos (Product # M-7512). The cells were then formaldehyde-fixed, acetone-permeabilized and counterstained using SYTO® 16 green-fluorescent nucleic acid stain (Product # S7578). Microtubules were labeled with mouse monoclonal anti-a-tubulin antibody (Product # A11126) and visualized with blue-fluorescent Alexa Fluor® 350 goat anti-mouse IgG (Product # A-11045). The multiple-exposure image was acquired using filter sets appropriate for Texas Red® dye, FITC and DAPI.
- Submitted by
- Invitrogen Antibodies (provider)
- Main image
- Experimental details
- Microtubules of fixed bovine pulmonary artery endothelial cells (BPAEC) labeled with mouse monoclonal anti-a-tubulin antibody (Product # A11126), followed by fluorescein goat anti-mouse IgG (Product # F-2761). The orange-fluorescent signal was produced using R-phycoerythrin-labeled anti-fluorescein/Oregon Green® antibody (Product # A-21250).

- Submitted by
- Invitrogen Antibodies (provider)
- Main image

- Experimental details
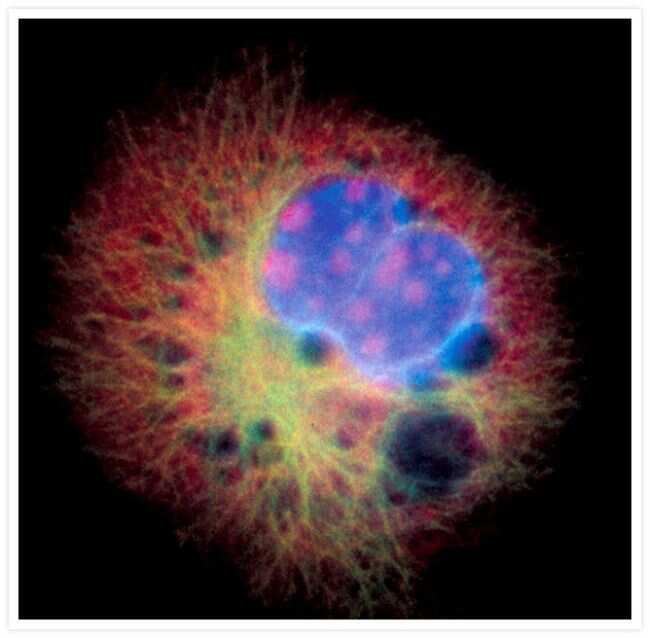
- The cytoskeleton of a fixed and permeabilized bovine pulmonary artery endothelial cell detected using mouse monoclonal anti-alpha-tubulin antibody (Product # A11126), visualized with Alexa Fluor® 647 goat anti-mouse IgG antibody (Product # A-21235) and pseudocolored magenta. Endogenous biotin in the mitochondria was labeled with green-fluorescent Alexa Fluor® 488 streptavidin (Product # S-11223) and DNA was stained with blue-fluorescent DAPI (Product # D1306, D3571, D21490).
- Submitted by
- Invitrogen Antibodies (provider)
- Main image
- Experimental details
- The microtubules of fixed HeLa cells labeled with mouse monoclonal anti-a-tubulin antibody (Product # A11126) and visualized using Alexa Fluor® 633 goat anti-mouse IgG (Product # A-21050), which is pseudocolored magenta. The filamentous actin (F-actin) was then labeled with Alexa Fluor® 680 phalloidin (Product # A22286), which is pseudocolored purple. Finally, the DNA was stained with blue-fluorescent DAPI (Product # D1306, D3571, D21490).

- Submitted by
- Invitrogen Antibodies (provider)
- Main image
- Experimental details
- Fixed and permeabilized bovine pulmonary artery endothelial (BPAE) cells labeled with mouse monoclonal anti-a-tubulin antibody (Product # A11126) and detected using TSA Kit #7 with the HRP conjugate of goat anti-mouse IgG antibody and Alexa Fluor® 350 tyramide (Product # T-20912).

- Submitted by
- Invitrogen Antibodies (provider)
- Main image
- Experimental details
- Reversible binding by DSB-X biotin. Microtubules of fixed bovine pulmonary artery endothelial cells were labeled with mouse monoclonal anti-a-tubulin antibody (Product # A11126), detected with either biotin-XX goat anti-mouse IgG antibody (Product # B-2763, panel A) or DSB-X biotin goat anti-mouse IgG antibody (D20691, panel B) and visualized with green-fluorescent Alexa Fluor 488 streptavidin (Product # S-11223). Nuclei were stained with blue-fluorescent DAPI (D1306, D3571, D21490). After incubating with 10 mM D-biotin (Product # B-1595, Product # B-20656), the binding between the biotinylated antibody is unaltered (panel C), whereas the streptavidin conjugate has been stripped from the DSB-X biotin-labeled antibody (panel D).
- Submitted by
- Invitrogen Antibodies (provider)
- Main image
- Experimental details
- The microtubules of fixed bovine pulmonary artery endothelial cells (BPAEC) localized with mouse monoclonal anti-a-tubulin antibody (Product # A11126), which was visualized with Alexa Fluor 350 goat anti&endash;mouse IgG antibody (Product # A-11045). The image was acquired using a longpass filter set appropriate for DAPI.
- Submitted by
- Invitrogen Antibodies (provider)
- Main image

- Experimental details
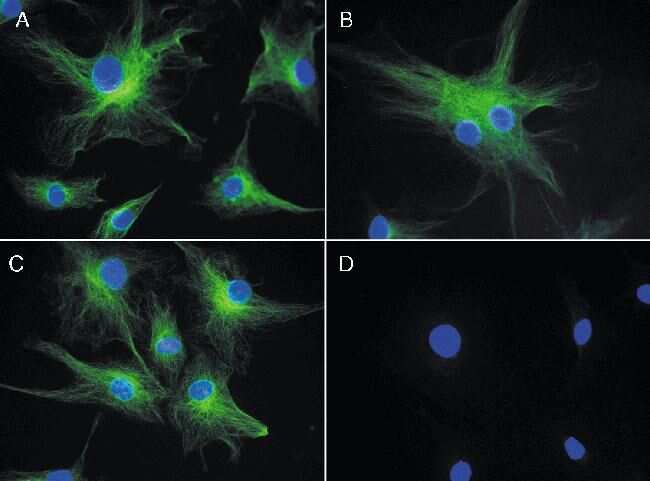
- Fixed and permeabilized muntjac skin fibroblasts stained with Alexa Fluor 488 phalloidin (Product # A12379), an anti-a-tubulin antibody (Product # A11126) and anti-cdc6 peptide antibody. The anti-a-tubulin antibody was prelabeled with the Zenon Alexa Fluor 568 Mouse IgG1 Labeling Kit (Product # Z-25006), and the anti-cdc6 peptide antibody was prelabeled with the Zenon Alexa Fluor 350 Mouse IgG1 Labeling Kit (Product # Z-25000).

- Submitted by
- Invitrogen Antibodies (provider)
- Main image

- Experimental details
- Fixed and permeabilized bovine pulmonary artery endothelial cells stained with Alexa Fluor® 350 phalloidin (Product # A22281), an anti-a-tubulin antibody (Product # A11126) and the anti-cdc6 peptide antibody (Product # A21286). The anti-a-tubulin antibody was labeled with the Zenon® Alexa Fluor® 568 Mouse IgG1 Labeling Kit (Product # Z-25006) and the anti-cdc6 peptide antibody was labeled with the Zenon® Alexa Fluor® 488 Mouse IgG1 Labeling Kit (Product # Z-25002).
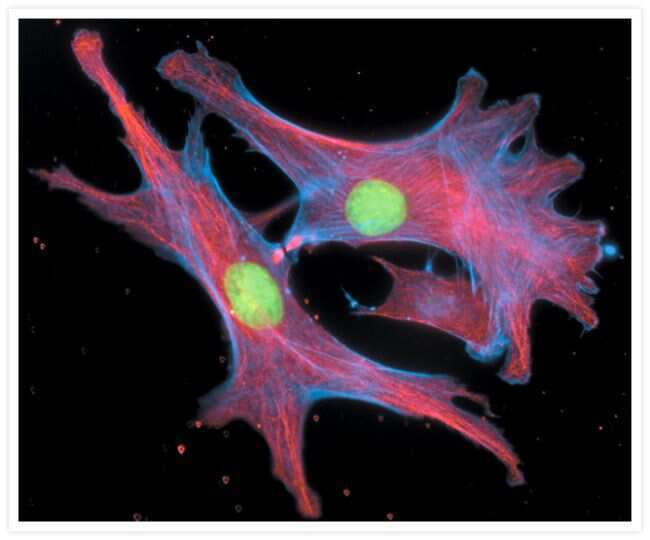
- Submitted by
- Invitrogen Antibodies (provider)
- Main image
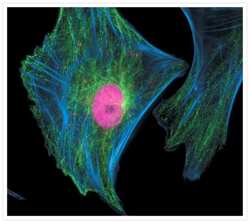
- Experimental details
- Fixed and permeabilized muntjac skin fibroblasts stained with Alexa Fluor® 350 phalloidin (Product # A22281), an anti-a-tubulin antibody (Product # A11126) and an anti-cdc6 peptide antibody (Product # A21286). The anti-a-tubulin antibody was prelabeled with the Zenon® Alexa Fluor® 488 Mouse IgG1 Labeling Kit (Product # Z-25002) and the anti-cdc6 peptide antibody was prelabeled with the Zenon® Alexa Fluor® 647 Mouse IgG1 Labeling Kit (Product # Z-25008).

- Submitted by
- Invitrogen Antibodies (provider)
- Main image

- Experimental details
- A prometaphase muntjac skin fibroblast stained with Alexa Fluor® 350 phalloidin (Product # A22281), an anti-a-tubulin antibody (Product # A11126) and an anti-cdc6 peptide antibody (Product # A21286). The anti-a-tubulin antibody was prelabeled with the Zenon® Alexa Fluor® 488 Mouse IgG1 Labeling Kit (Product # Z-25002) and the anti-cdc6 peptide antibody was prelabeled with the Zenon® Alexa Fluor® 647 Mouse IgG1 Labeling Kit (Product # Z-25008).

- Submitted by
- Invitrogen Antibodies (provider)
- Main image
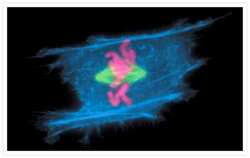
- Experimental details
- A metaphase muntjac skin fibroblast stained with Alexa Fluor® 350 phalloidin (Product # A22281), an anti-a-tubulin antibody (Product # A11126) and an anti-cdc6 peptide antibody (Product # A21286). The anti-a-tubulin antibody was prelabeled with the Zenon® Alexa Fluor® 488 Mouse IgG1 Labeling Kit (Product # Z-25002) and the anti-cdc6 peptide antibody was prelabeled with the Zenon® Alexa Fluor® 647 Mouse IgG1 Labeling Kit (Product # Z-25008).

- Submitted by
- Invitrogen Antibodies (provider)
- Main image
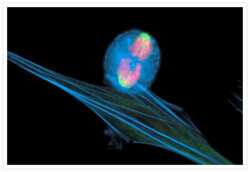
- Experimental details
- An anaphase muntjac skin fibroblast stained with Alexa Fluor® 350 phalloidin (Product # A22281), an anti-a-tubulin antibody (Product # A11126) and an anti-cdc6 peptide antibody (Product # A21286). The anti-a-tubulin antibody was prelabeled with the Zenon® Alexa Fluor® 488 Mouse IgG1 Labeling Kit (Product # Z-25002) and the anti-cdc6 peptide antibody was prelabeled with the Zenon® Alexa Fluor® 647 Mouse IgG1 Labeling Kit (Product # Z-25008).

- Submitted by
- Invitrogen Antibodies (provider)
- Main image

- Experimental details
- Late telophase muntjac cells stained with Alexa Fluor® 350 phalloidin (Product # A22281), an anti-a-tubulin antibody (Product # A11126) and an anti-cdc6 peptide antibody (Product # A21286). The anti-a-tubulin antibody was prelabeled with the Zenon® Alexa Fluor® 488 Mouse IgG1 Labeling Kit (Product # Z-25002), and the anti-cdc6 peptide antibody was prelabeled with the Zenon® Alexa Fluor® 647 Mouse IgG1 Labeling Kit (Product # Z-25008).

- Submitted by
- Invitrogen Antibodies (provider)
- Main image
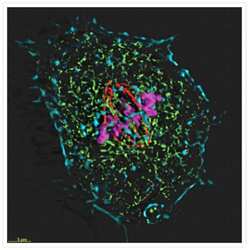
- Experimental details
- Four-color staining of muntjac skin fibroblast with probes for cytoskeletal, nuclear and mitochondrial proteins. Fixed and permeabilized cells were stained with Alexa Fluor® 350 phalloidin (Product # A22281), an anti-Α-tubulin antibody (Product # A11126), an anti-cdc6 peptide antibody (Product # A21286) and Mouse anti ATP Synthase Subunit IF1 Monoclonal Antibody (Product # A-21355). The Mouse anti ATP Synthase Subunit IF1 Monoclonal Antibody was prelabeled with the Zenon® Alexa Fluor® 488 Mouse IgG1 Labeling Kit (Product # Z-25002), the anti-a-tubulin antibody was prelabeled with the Zenon® Alexa Fluor® 568 Mouse IgG1 Labeling Kit (Product # Z-25002), and the anti-cdc6 peptide antibody was prelabeled with the Zenon® Alexa Fluor® 647 Mouse IgG1 Labeling Kit (Product # Z-25008). The image was deconvolved using Huygens software (Scientific Volume Imaging, http://www.svi.nl/).
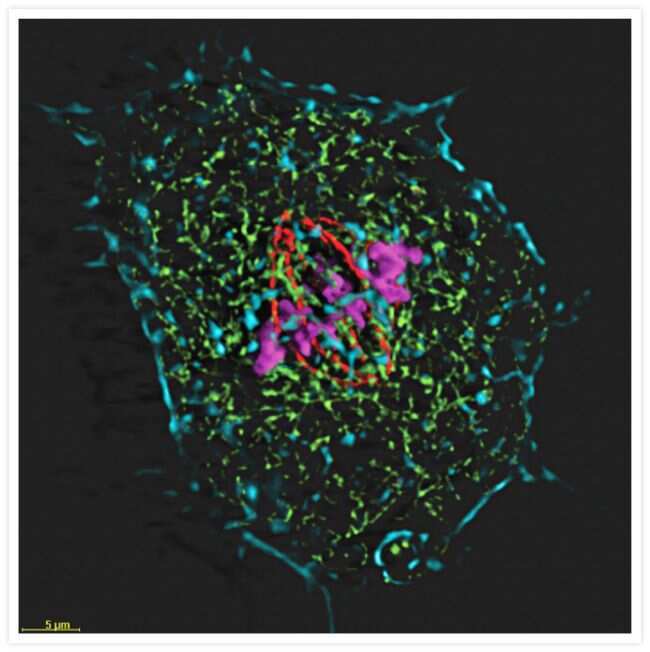
- Submitted by
- Invitrogen Antibodies (provider)
- Main image

- Experimental details
- Fixed and permeabilized muntjac skin fibroblasts stained with an anti-a-tubulin antibody (Product # A11126), an anti-paxillin antibody and an anti-cdc6 peptide antibody (Product # A21286) to label tubulin, adhesion points and the nucleus, respectively. The anti-a-tubulin antibody was prelabeled with the Zenon® FITC Mouse IgG1 Labeling Kit (Product # Z-25042), the anti-paxillin antibody was prelabeled with the Zenon® Alexa Fluor® 488 Mouse IgG1 Labeling Kit (Product # Z-25002) and the anti-cdc6 peptide antibody was prelabeled with the Zenon® Alexa Fluor® 350 Mouse IgG1 Labeling Kit (Product # Z-25000). Signals from FITC and Alexa Fluor® 488 dye were imaged before and after photobleaching for 32 minutes. Signal remaining after 32 minutes was assumed to be that of the Alexa Fluor® 488 dye and was pseudocolored yellow in this image.
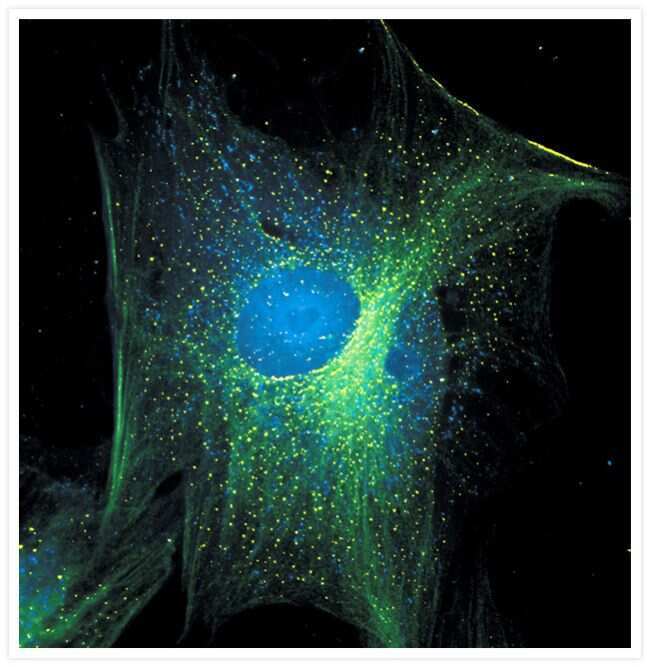
- Submitted by
- Invitrogen Antibodies (provider)
- Main image
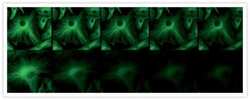
- Experimental details
- A 20-second time series showing enhanced resistance to photobleaching afforded by ProLong® Gold antifade reagent. Fixed bovine pulmonary artery endothelial cells were labeled with anti–α-tubulin (Product # A11126) and visualized with FITC-conjugated goat anti-mouse IgG (Product # F-2761). The samples were mounted in ProLong® Gold antifade reagent (Product # P36930; top) or phosphate-buffered saline (bottom). Images were acquired at 5 second intervals using a 40x/1.3 NA oil immersion objective with continuous illumination from a standard 100 watt Hg-arc lamp.
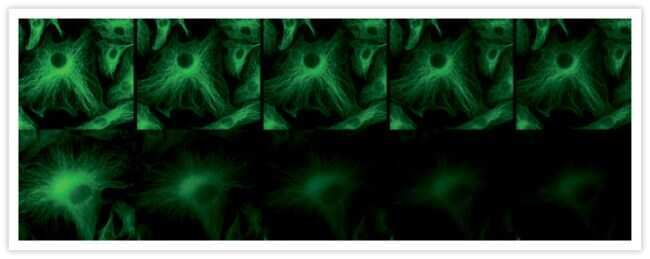
- Submitted by
- Invitrogen Antibodies (provider)
- Main image
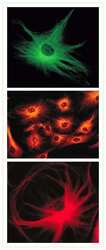
- Experimental details
- Microtubules of bovine pulmonary artery endothelial cells tagged with mouse monoclonal anti-a-tubulin antibody (Product # A11126) and subsequently probed with: Alexa Fluor® 488 Goat Anti-Mouse IgG antibody (Product # A-11001, top panel), Alexa Fluor® 546 Goat Anti-Mouse IgG antibody (Product # A-11003, middle panel) or Alexa Fluor® 594 Goat Anti-Mouse IgG antibody (Product # A-11005, bottom panel). These images were acquired using a FITC bandpass optical filter set, a rhodamine bandpass optical filter set, and a Texas Red bandpass optical filter set, respectively.
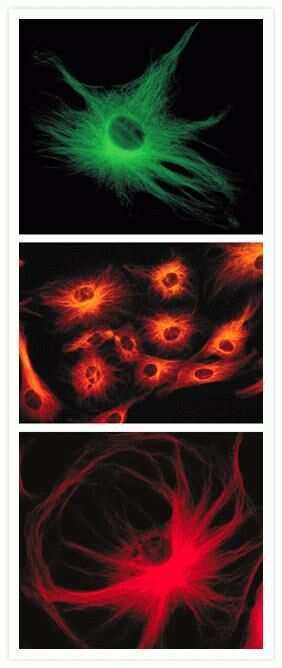
- Submitted by
- Invitrogen Antibodies (provider)
- Main image

- Experimental details
- Microtubules of bovine pulmonary artery endothelial cells that have been labeled with mouse monoclonal anti-a-tubulin antibody (Product # A11126), followed by biotin-XX goat anti-mouse IgG antibody (Product # B-2763), and then visualized with Marina Blue® streptavidin (Product # S-11221). The cells were next treated with RNase, and the chromosomes were labeled with TO-PRO®-3 iodide (Product # T3605). A series of Z-plane images was acquired with a wide-field optical sectioning confocal laser-scanning microscope. A three-dimensional volume rendering was generated from the deconvolved image series.

- Submitted by
- Invitrogen Antibodies (provider)
- Main image
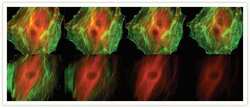
- Experimental details
- Comparison of the photobleaching rates of the Alexa Fluor® 488 and Alexa Fluor® 546 dyes and FITC and Cy3 fluorophores. The cytoskeleton of bovine pulmonary artery endothelial cells (BPAEC) was labeled with (top series) Alexa Fluor® 488 phalloidin (Product # A12379) and mouse monoclonal anti-alpha-tubulin antibody (Product # A11126) in combination with Alexa Fluor® 546 goat anti-mouse IgG antibody (Product # A-11003) or (bottom series) FITC-conjugated phalloidin (F432) and the anti-alpha-tubulin antibody in combination with a commercially available Cy3 goat anti-mouse IgG antibody. The pseudocolored images were taken at 30-second intervals (0, 30, 90, and 210 seconds of exposure from left to right). The images were acquired with bandpass filter sets appropriate for FITC and rhodamine.
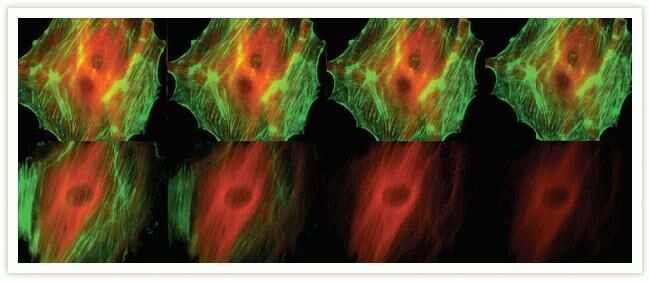
- Submitted by
- Invitrogen Antibodies (provider)
- Main image
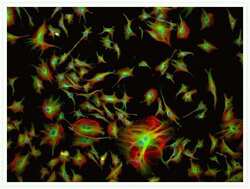
- Experimental details
- Multicolor cytoskeletal staining of a bovine pulmonary artery endothelial cell. Actin filaments were detected using Texas Red®-X phalloidin (Product # T7471). Tubulin was labeled with a primary antibody directed against a-tubulin (Product # A11126) and visualized using green-fluorescent BODIPY® FL goat anti-mouse IgG (Product # B-2752). Nuclei were counterstained with blue-fluorescent DAPI (Product # D1306, D3571, D21490).
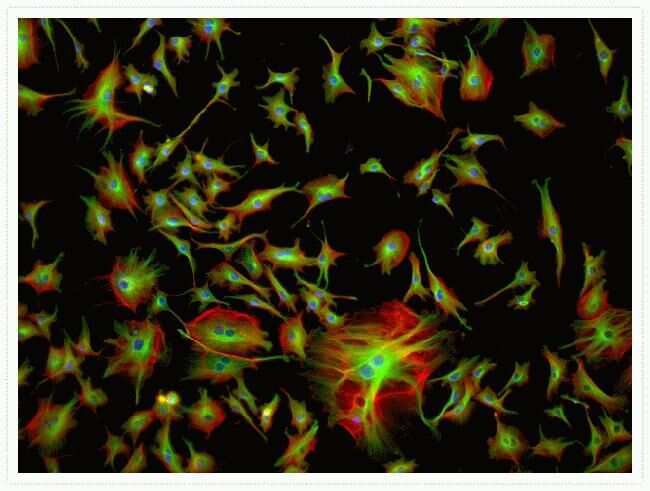
- Submitted by
- Invitrogen Antibodies (provider)
- Main image

- Experimental details
- Microtubules of NIH 3T3 cells labeled with mouse anti-a-tubulin monoclonal IgG1 antibody (Product # A11126) and visualized with blue-fluorescent Alexa Fluor® 405 goat anti-mouse IgG antibody (Product # A-31553). Nuclei were stained with red-fluorescent propidium iodide (Product # P1304MP, P3566, P21493).
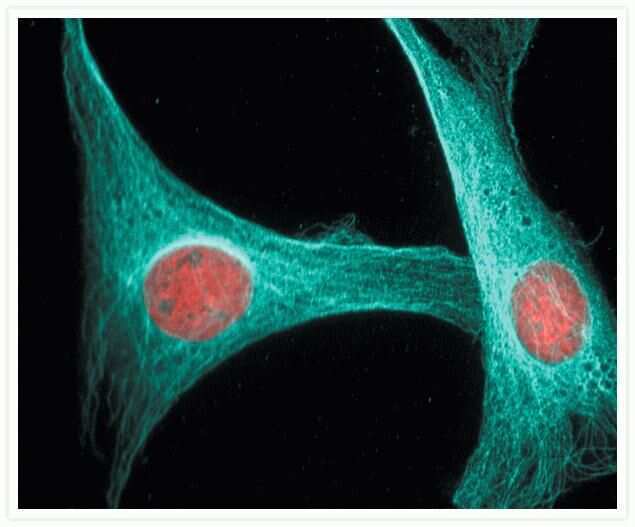
- Submitted by
- Invitrogen Antibodies (provider)
- Main image
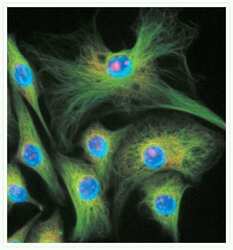
- Experimental details
- Microtubules of fixed bovine pulmonary artery endothelial cells (BPAEC) were localized with mouse monoclonal anti-a-tubulin antibody (Product # A11126), followed by the biotin-XX-conjugated F (ab)2 fragment of goat anti-mouse IgG antibody (Product # B11027) and visualized with green-fluorescent Alexa Fluor® 488 streptavidin (Product # S-11223). The cells were counterstained with blue-fluorescent Hoechst 33342 (Product # H1399, H3570, H21492) to image the DNA and red-fluorescent propidium iodide (Product # P1304MP, P3566, P21493) to image nucleolar RNA. The multiple-exposure image was acquired using bandpass filter sets appropriate for Texas Red® dye, FITC and DAPI.

- Submitted by
- Invitrogen Antibodies (provider)
- Main image
- Experimental details
- A comparison of the photobleaching rates of APC and Cy5 conjugates. The micro-tubules of bovine pulmonary artery endothelial cells were stained with mouse anti-a-tubulin antibody (Product # A11126) in combination with goat anti-mouse IgG labeled antibody with either crosslinked APC (Product # A-865, top series) or the Cy5 dye (bottom series). The samples were exposed to continuous illumination, and the images were acquired at 30-second intervals with a Quantex cooled CCD camera (Photometrics) using filter sets appropriate for both APC and Cy5 dye.
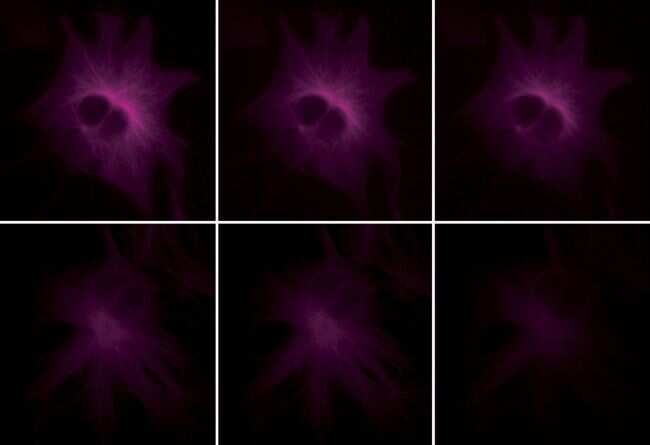
- Submitted by
- Invitrogen Antibodies (provider)
- Main image
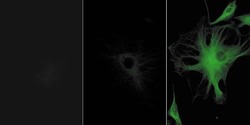
- Experimental details
- Bovine pulmonary artery endothelial cells were labeled with anti-a-tubulin antibody (Product # A11126) in combination with fluorescein goat anti-mouse IgG antibody (Product # F-2761) (left panel). The center panel shows the cells after treatment with Alexa Fluor® 488 rabbit anti-fluorescein/Oregon Green® antibody (Product # A-11090), and the right panel show the cells after additional labeling with the Alexa Fluor® 488 goat anti-rabbit IgG antibody (Product # A-11008). The images were acquired using identical exposure times, and a bandpass filter set appropriate for fluorescein.
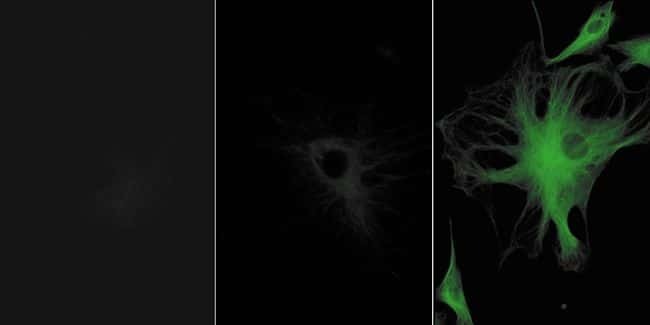
Supportive validation
- Submitted by
- Invitrogen Antibodies (provider)
- Main image
- Experimental details
- A 14 µm coronal section of mouse hippocampus stained with an anti-a-tubulin antibody (Product # A11126) labeled with the Zenon® Alexa Fluor® 488 Mouse IgG1 Labeling Kit (Product # Z-25002). The section was counterstained with the NeuroTrace® 530/615 red fluorescent Nissl stain (Product # N-21482) to visualize neuronal cell bodies and Hoechst 33258 (Product # H1398, H3569, H21491) to stain nuclei.
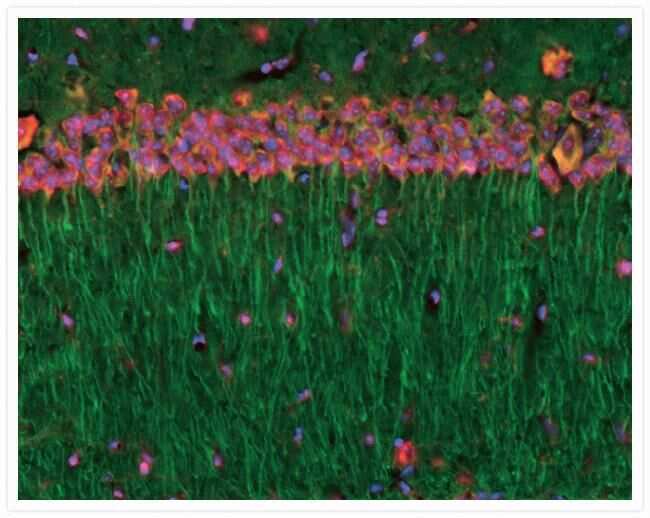
- Submitted by
- Invitrogen Antibodies (provider)
- Main image
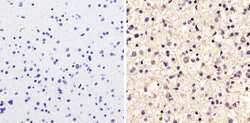
- Experimental details
- Immunohistochemistry analysis of Alpha-Tubulin showing staining in the cytoplasm of paraffin-embedded human astroglioma tissue (right) compared to a negative control without primary antibody (left). To expose target proteins, antigen retrieval was performed using 10mM sodium citrate (pH 6.0), microwaved for 8-15 min. Following antigen retrieval, tissues were blocked in 3% H2O2-methanol for 15 min at room temperature, washed with ddH2O and PBS, and then probed with a Alpha-Tubulin monoclonal antibody (Product # A11126) diluted in 3% BSA-PBS at a dilution of 1:100 overnight at 4ºC in a humidified chamber. Tissues were washed extensively in PBST and detection was performed using an HRP-conjugated secondary antibody followed by colorimetric detection using a DAB kit. Tissues were counterstained with hematoxylin and dehydrated with ethanol and xylene to prep for mounting.
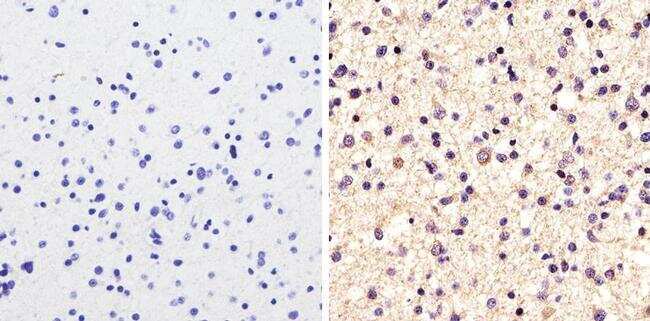
Supportive validation
- Submitted by
- Invitrogen Antibodies (provider)
- Main image

- Experimental details
- Flow cytometry analysis of alpha-Tubulin was done on HeLa cells. Cells were fixed with 70% ethanol for 10 minutes, permeabilized with 0.25% Tritonª X-100 for 20 minutes, and blocked with 5% BSA for 30 minutes at room temperature. Cells were labeled with alpha-Tubulin Mouse Monoclonal Antibody (A11126, red histogram) or with mouse isotype control (pink histogram) at 3-5 µg/million cells in 2.5% BSA. After incubation at room temperature for 2 hours, the cells were labeled with Alexa Fluor¨ 488 Rabbit Anti-Mouse Secondary Antibody (A11059) at a dilution of 1:400 for 30 minutes at room temperature. The representative 10,000 cells were acquired and analyzed for each sample using an Attune¨ Acoustic Focusing Cytometer. The purple histogram represents unstained control cells and the green histogram represents no-primary-antibody control.
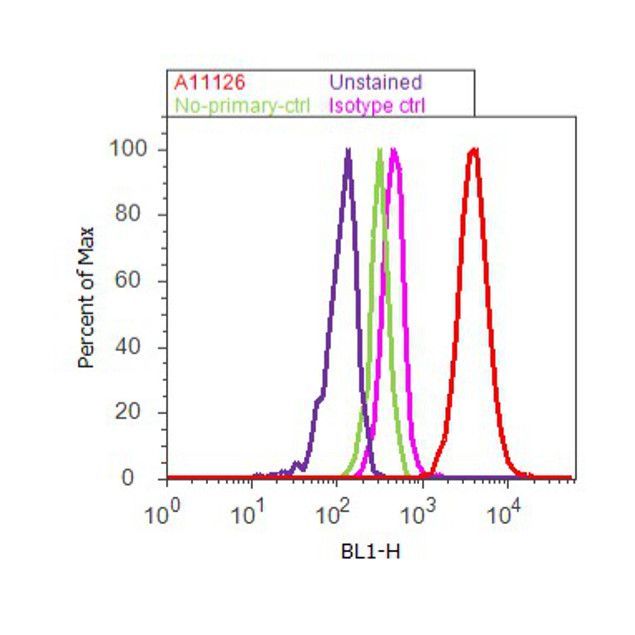
Supportive validation
- Submitted by
- Invitrogen Antibodies (provider)
- Main image
- Experimental details
- NULL

- Submitted by
- Invitrogen Antibodies (provider)
- Main image
- Experimental details
- NULL
- Submitted by
- Invitrogen Antibodies (provider)
- Main image
- Experimental details
- NULL

- Submitted by
- Invitrogen Antibodies (provider)
- Main image
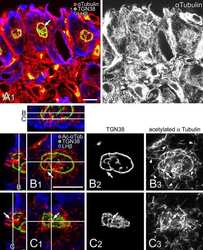
- Experimental details
- NULL
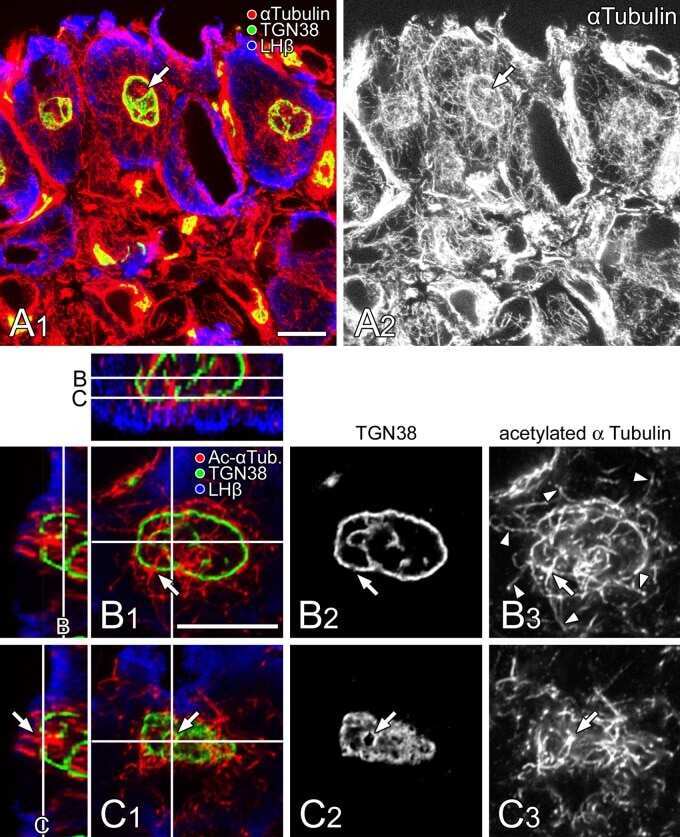
- Submitted by
- Invitrogen Antibodies (provider)
- Main image
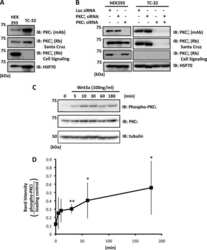
- Experimental details
- NULL

- Submitted by
- Invitrogen Antibodies (provider)
- Main image
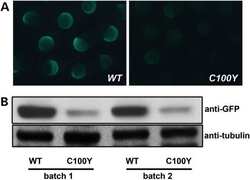
- Experimental details
- NULL
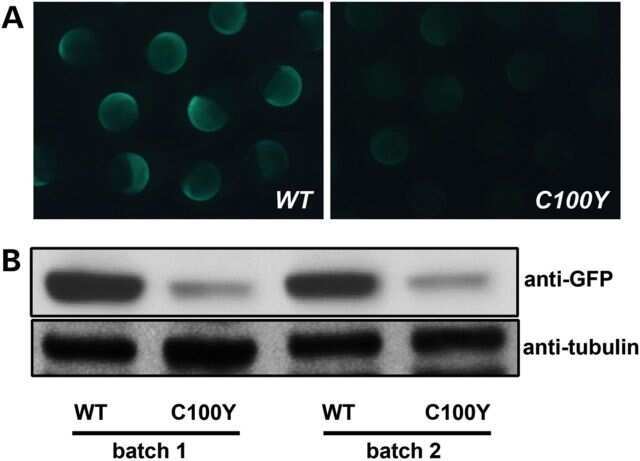
- Submitted by
- Invitrogen Antibodies (provider)
- Main image
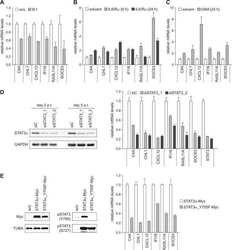
- Experimental details
- NULL
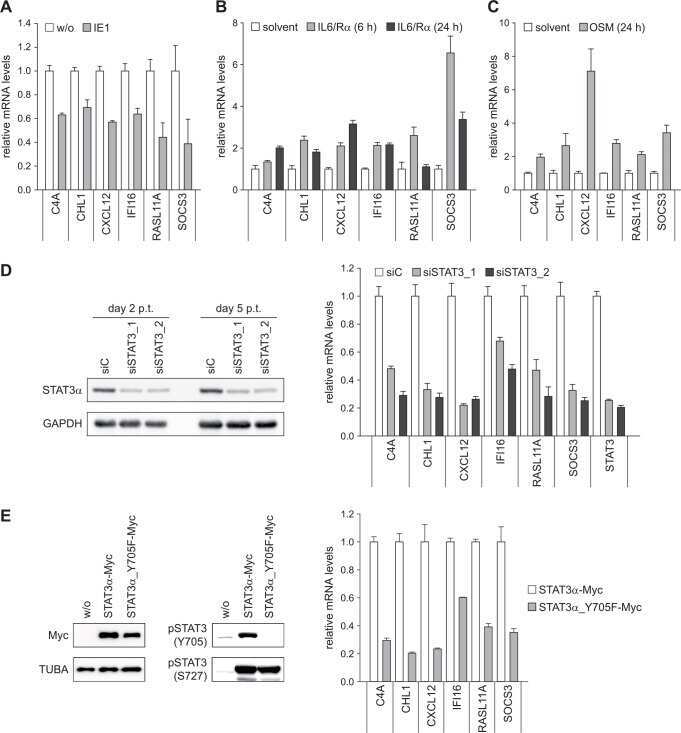
- Submitted by
- Invitrogen Antibodies (provider)
- Main image
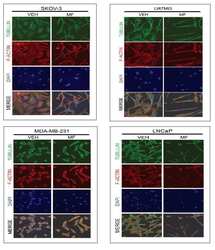
- Experimental details
- NULL
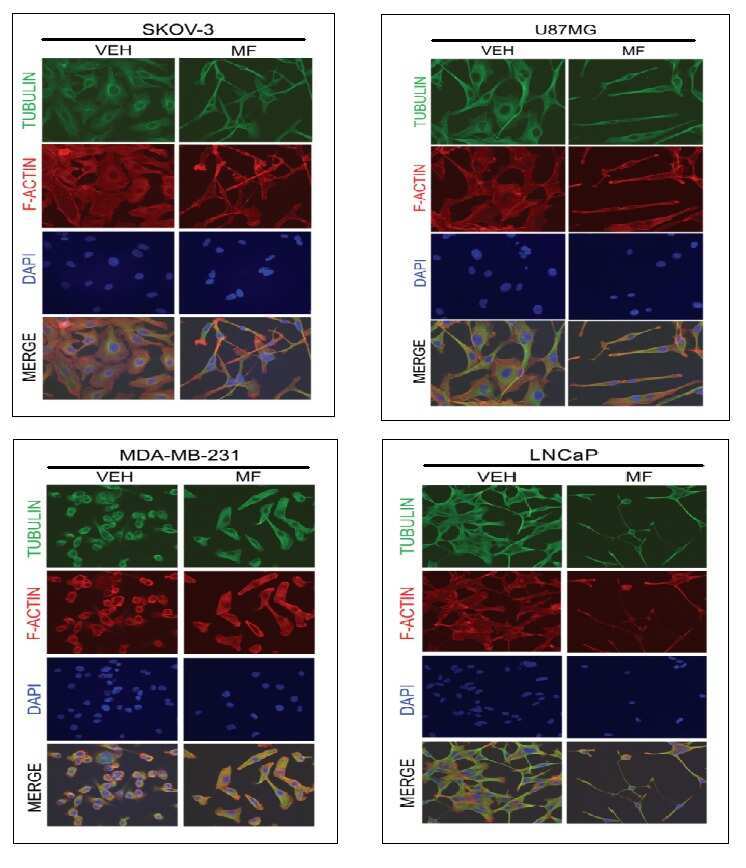
- Submitted by
- Invitrogen Antibodies (provider)
- Main image
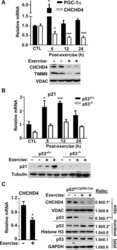
- Experimental details
- NULL
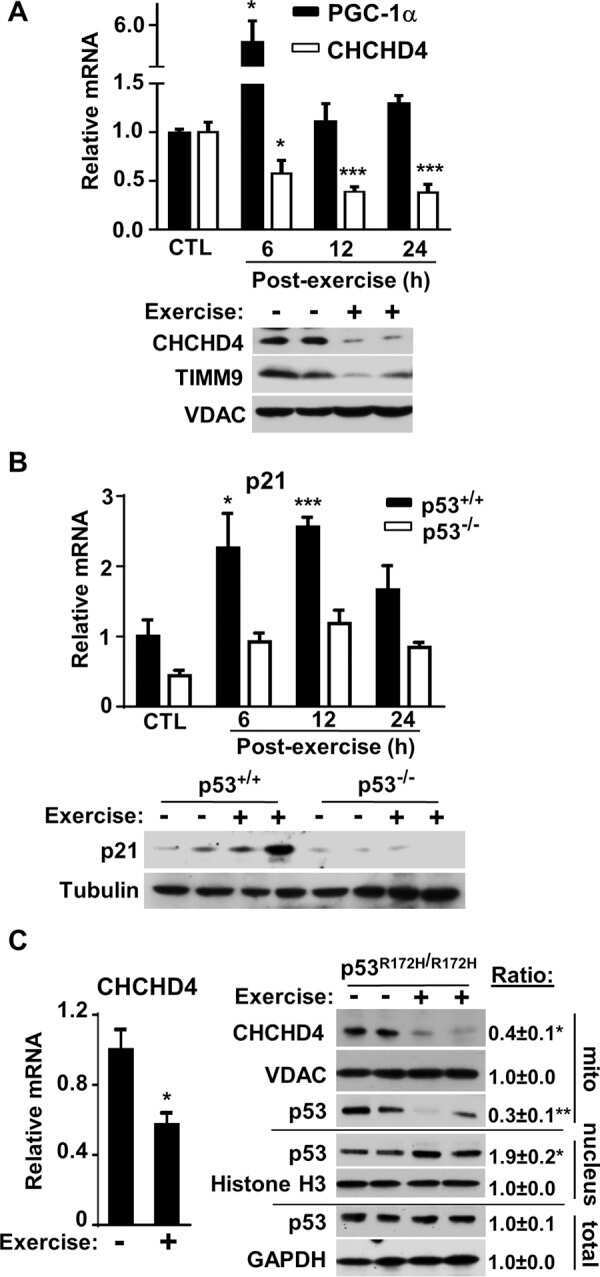
- Submitted by
- Invitrogen Antibodies (provider)
- Main image
- Experimental details
- NULL
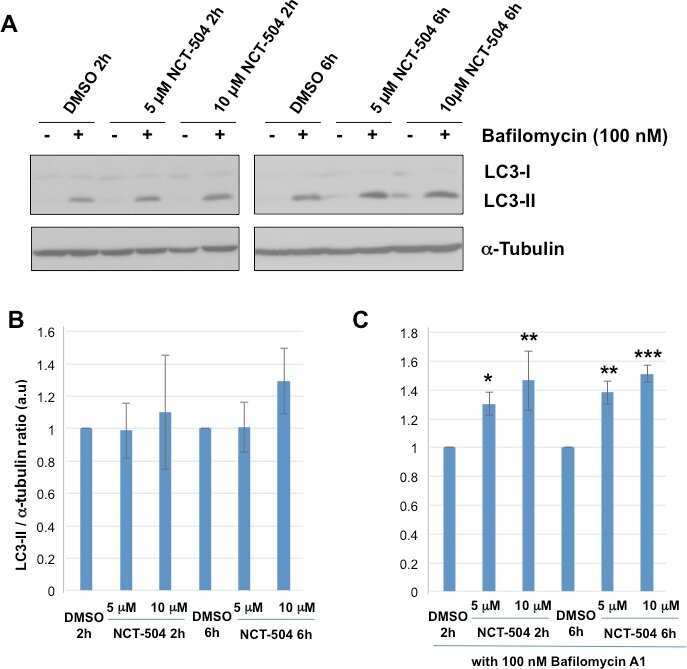
- Submitted by
- Invitrogen Antibodies (provider)
- Main image
- Experimental details
- NULL
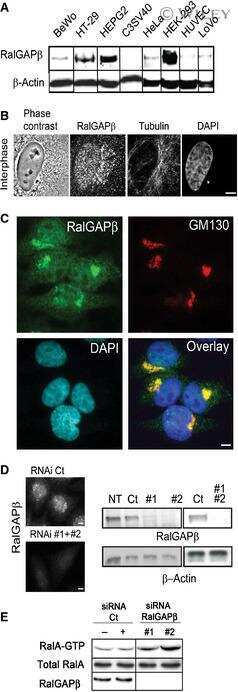
- Submitted by
- Invitrogen Antibodies (provider)
- Main image

- Experimental details
- NULL
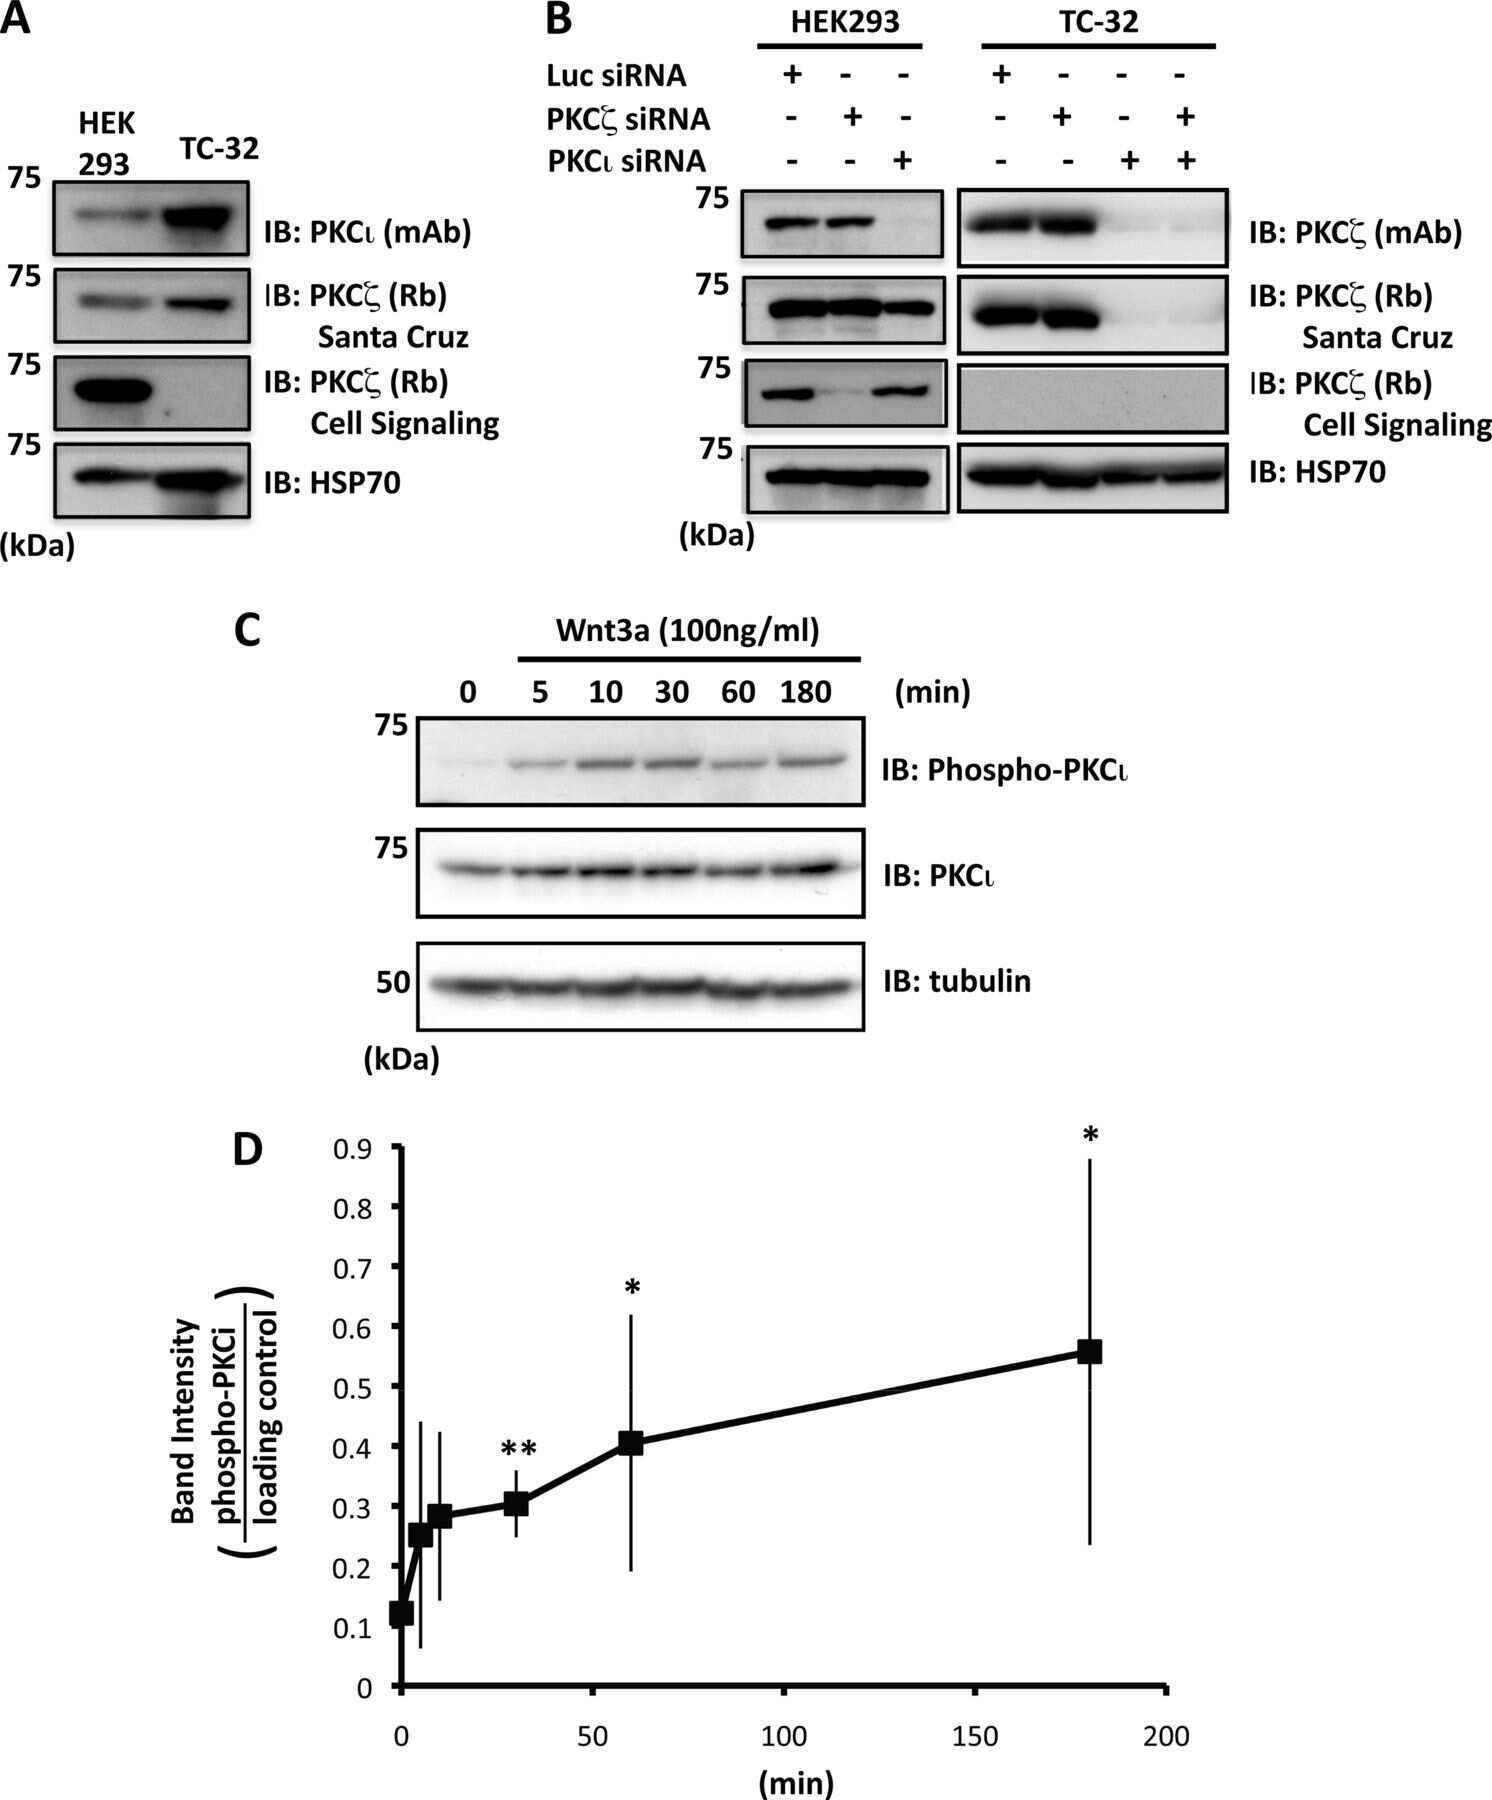
- Submitted by
- Invitrogen Antibodies (provider)
- Main image
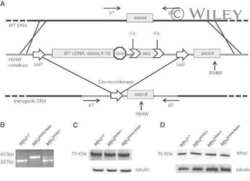
- Experimental details
- NULL
- Submitted by
- Invitrogen Antibodies (provider)
- Main image

- Experimental details
- NULL
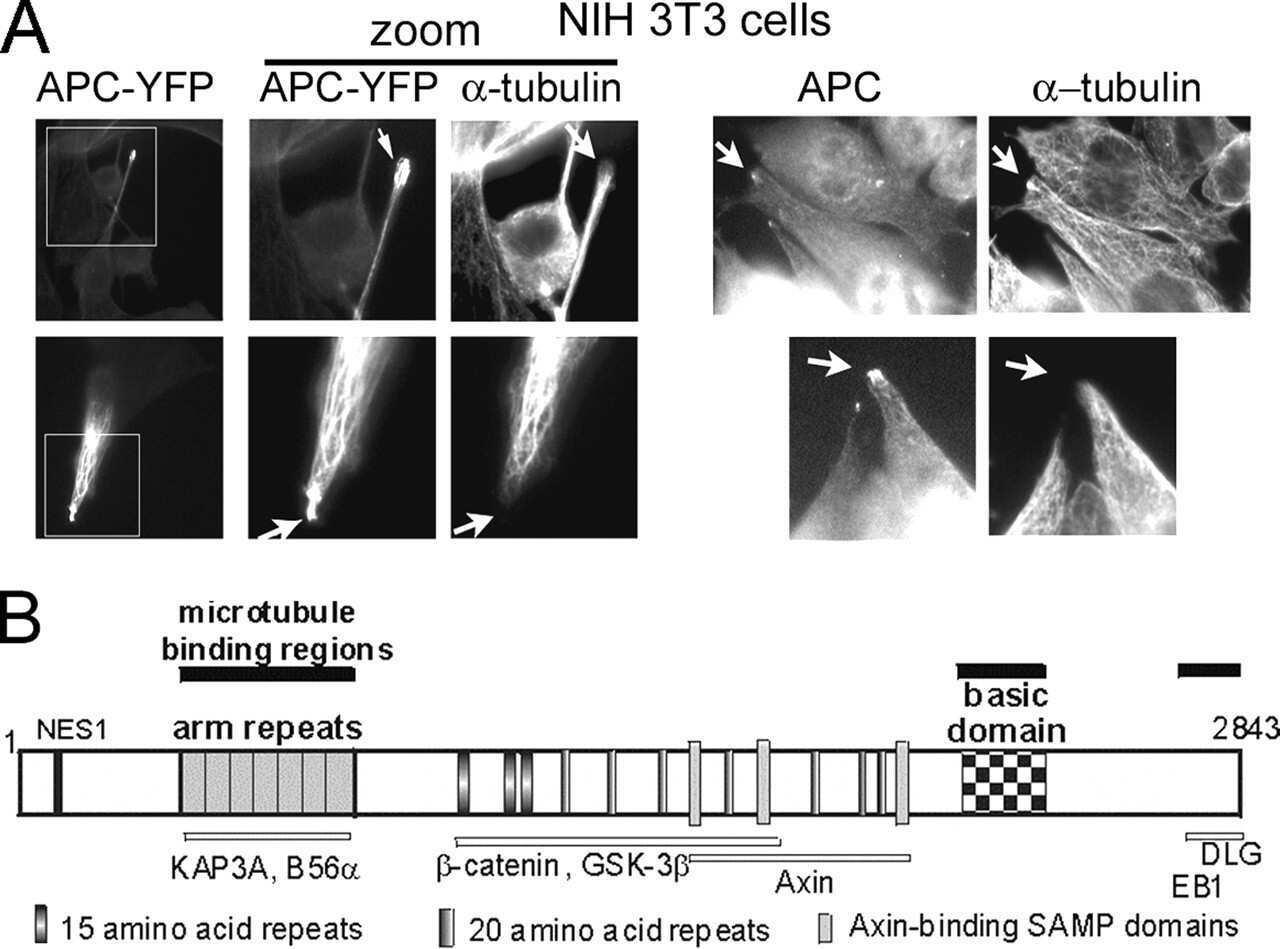
- Submitted by
- Invitrogen Antibodies (provider)
- Main image
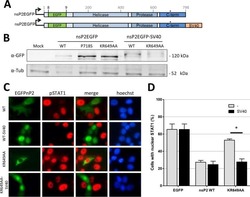
- Experimental details
- NULL
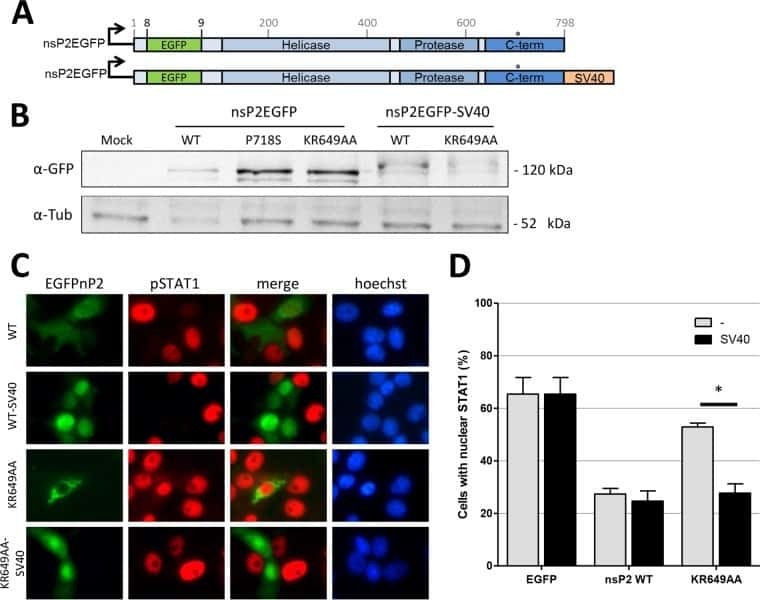
- Submitted by
- Invitrogen Antibodies (provider)
- Main image
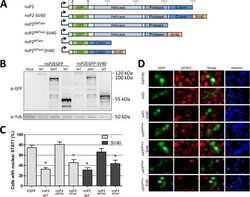
- Experimental details
- NULL
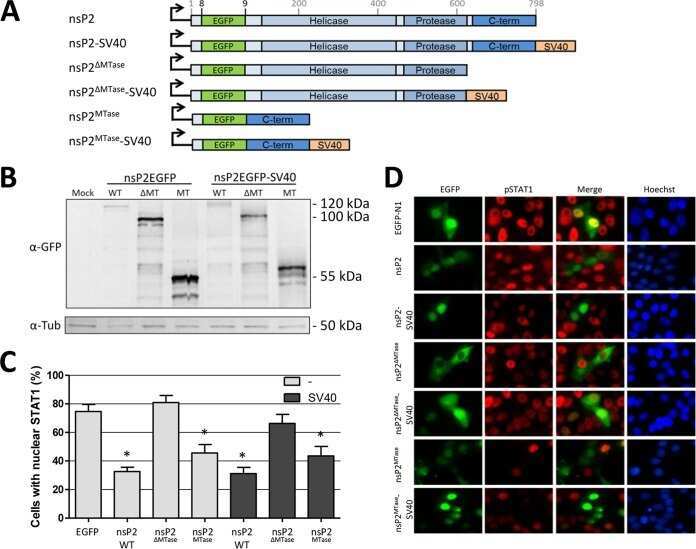
- Submitted by
- Invitrogen Antibodies (provider)
- Main image
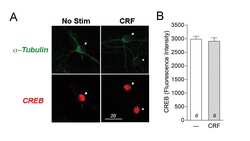
- Experimental details
- NULL
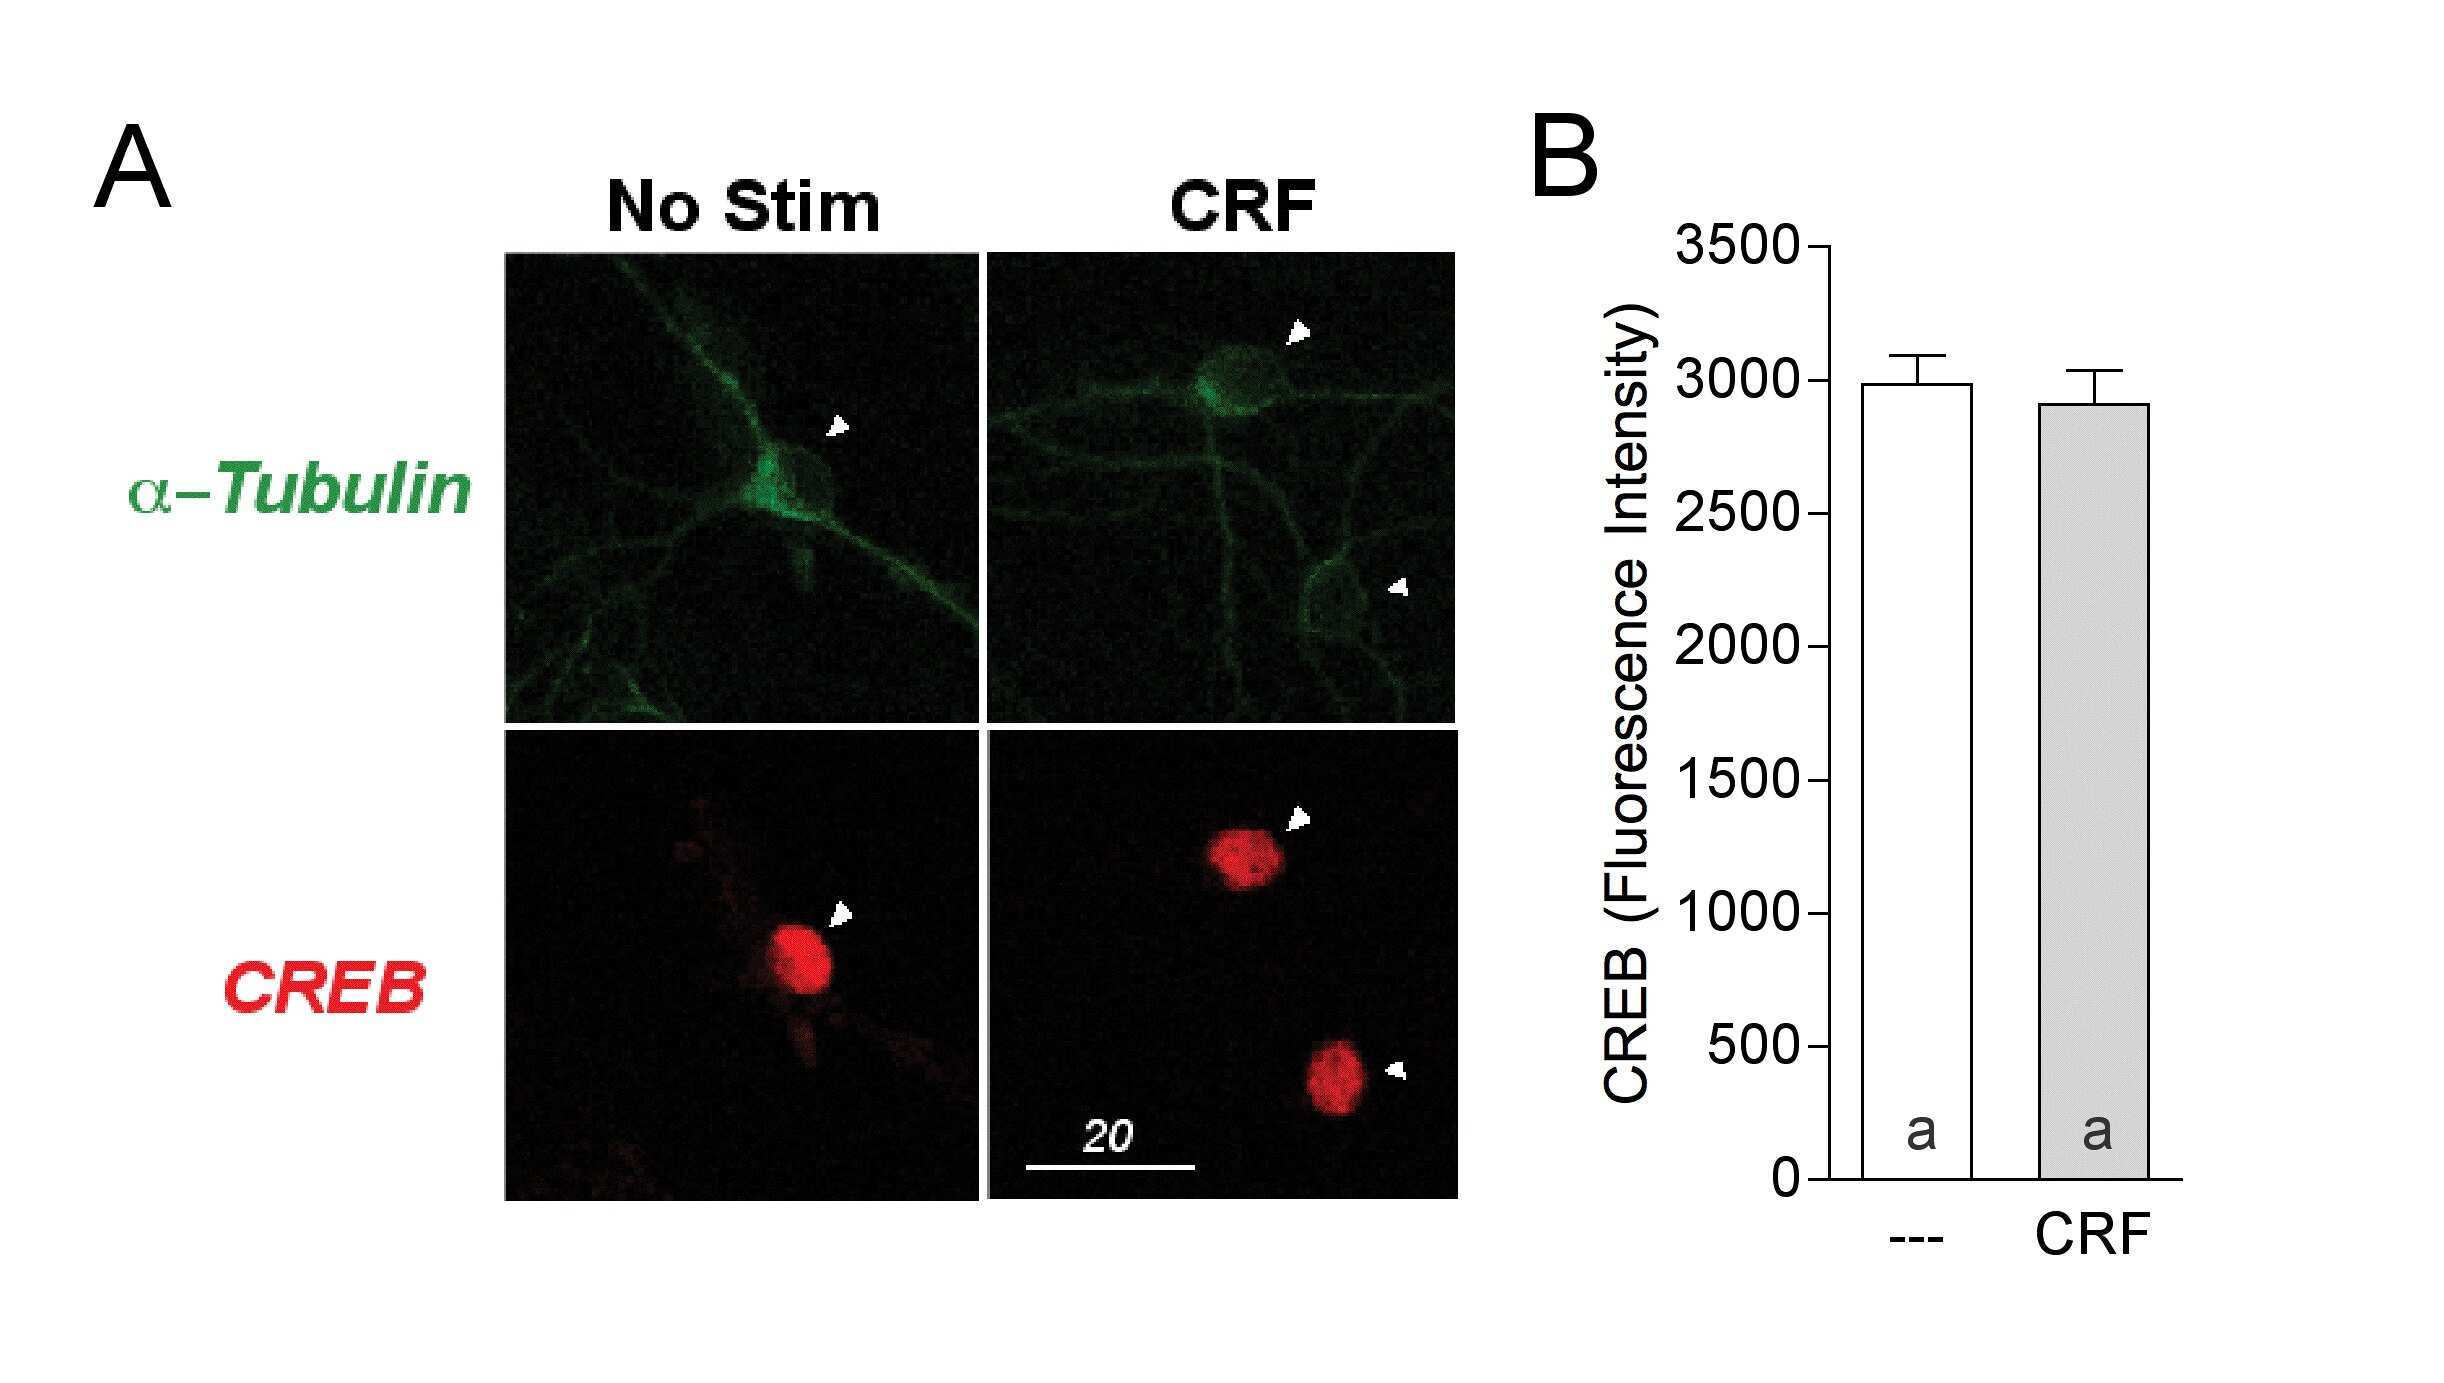
- Submitted by
- Invitrogen Antibodies (provider)
- Main image
- Experimental details
- NULL
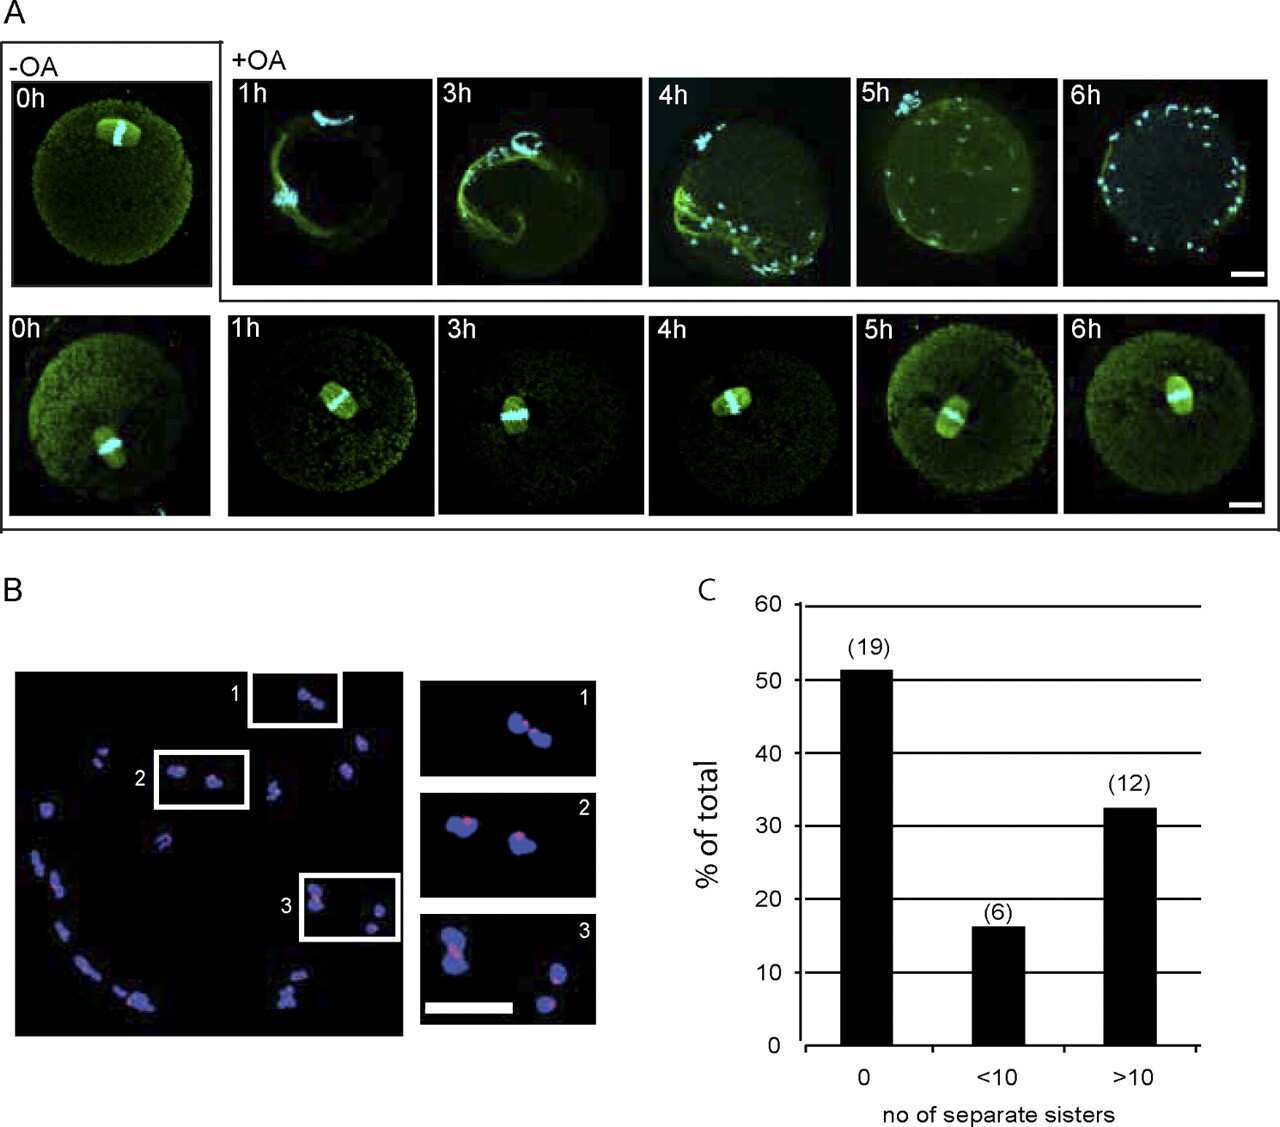
- Submitted by
- Invitrogen Antibodies (provider)
- Main image

- Experimental details
- NULL

- Submitted by
- Invitrogen Antibodies (provider)
- Main image
- Experimental details
- Figure 2 The different expression levels of AURKA in the leader cells and the follower cells. ( A , B ) MDA-MB-231 cells were cultured in microfluidic chip for 2 days and subjected to immunofluorescence staining and analysis (original magnification, x200) with antibodies against alpha-Tubulin (red, A ) and AURKA (green, B ). DAPI (blue) staining was used to visualize the nuclei. Solid arrows point to the leader cells while the hollow arrow points to the follower cells. Scale bar: 100 mum ( A ) and 100 mum ( B ).

- Submitted by
- Invitrogen Antibodies (provider)
- Main image
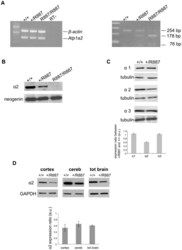
- Experimental details
- Figure 2 In vivo expression of mutant Atp1a2 . Total RNA and protein samples were isolated from brain of wild type (+/+), Atp1a2 +/R887 (+/R887) and homozygous Atp1a2 R887/R887 (R887/R887) mice at E19.5. A. Left panel. Semi quantitative Atp1a2 RT-PCR (254 bp fragment) on brain cDNA. The b-actin fragment (610 bp) is included as in-tube normalizer. Right panel, same Atp1a2 RT-PCR fragments digested by MspI. B. Protein blot of microsomal fraction probed with anti-alpha2 Na,K-ATPase antibody and anti-neogenin as loading control; the alpha2 Na,K-ATPase and neogenin bands appear at the expected size of 110 kDa and 52 kDa, respectively. C. Total brain lysates from adult wild type and Atp1a2 +/R887 mice probed with anti-alpha1, alpha2, and alpha3 Na,K-ATPase antibodies; anti- tubulin as loading control. Densitometric quantization shows a 50% reduction of the heterozygous mutant alpha2 level compared to wild type. Error bars represent +- SD; Student's t test p
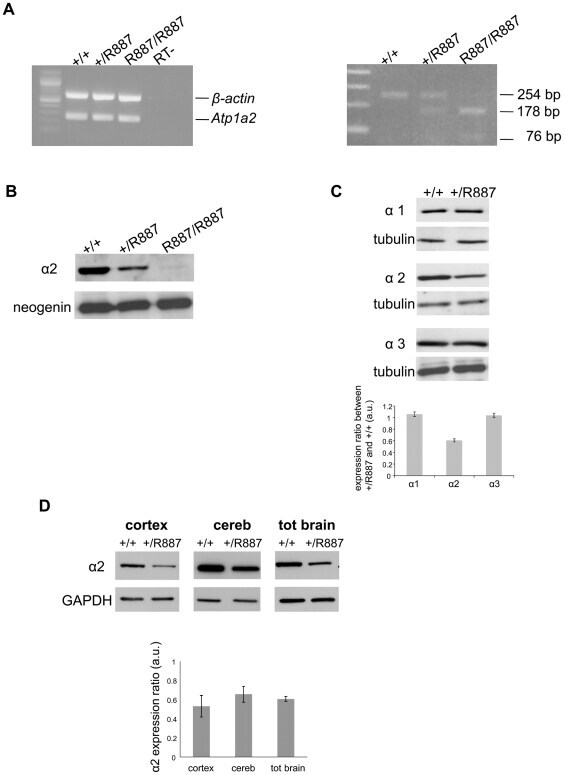
- Submitted by
- Invitrogen Antibodies (provider)
- Main image
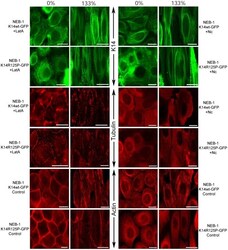
- Experimental details
- Figure 8 Fluorescent images of the K5/K14, F-actin and microtubule networks in NEB-1 K14wt-GFP and NEB-1 K14R125P-GFP keratinocytes fixed at 0% or 133% strain. Cells were treated with 1 ug/mL nocodazole (Nc) to disturb the F-actin network, or were untreated (control). The F-actin network was visualized with rhodamine-phalloidin (100 nM), and alpha-tubulin with immunofluorescence. K14-GFP proteins were expressed and visualized by fluorescence microscopy. Scale bar = 20 um.

- Submitted by
- Invitrogen Antibodies (provider)
- Main image
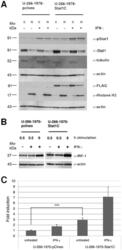
- Experimental details
- Figure 2 Nuclear translocation and transcriptional activity of stably transfected cells. Stably transfected U-266-1970-pcIneo cells and U-266-1970-Stat1C cells were left un-treated or were treated with 1000 U/mL IFN-gamma for 0.5 hours. Nuclear and cytoplasmic protein extracts were prepared. ( A ) Western blot analysis of the nuclear (n) and cytoplasmic (c) protein extracts were performed using the indicated antibodies. The proteins alpha-tubulin and alpha-histone H3 are markers for the cytoplasmic and nuclear fraction respectively. ( B ) Stably transfected U-266-1970-pcIneo or U-266-1970-Stat1C cells were left untreated or were treated with IFN-gamma (1000 U/mL) for the indicated times. Protein lysates were prepared and Western blot analysis was performed using the indicated antibodies. ( C ) The luciferase reporter contruct GBP-luc was cotransfected with hubactp/lacZ vector into U-266-1970-pcIneo cells and U-266-1970-Stat1C cells as described. After 24 hours of treatment with IFN-gamma (1000 U/mL), protein extracts were prepared and luciferase assays were performed. The graph shows fold induction of relative light units (RLU) as the mean of three independent experiments +- SD. Corrections have been made for varying transfection efficiency.
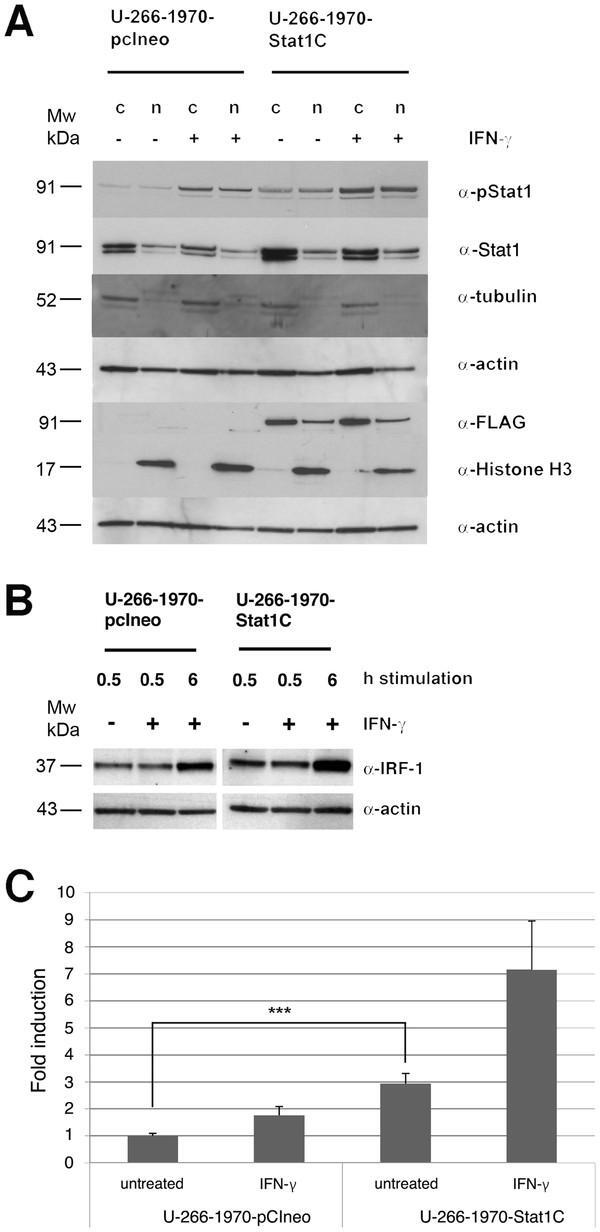
- Submitted by
- Invitrogen Antibodies (provider)
- Main image
- Experimental details
- Figure 5. Activation of MAPK in endometrial cells treated with lipopeptide PAMPs. Endometrial epithelial cells (A) and stromal cells (B) were collected 0, 5, 10, 15, 20, or 25 minutes after treatment with 100 ng/mL PAM or 100 ng/mL FSL-1. The protein from the cells was analyzed by SDS-PAGE and immunoblotted with antibodies against total and phosphorylated forms of p38 (t-p38 and p-p38) and ERK1/2 (tERK1/2 and pERK1/2; #, tERK2; #, pERK2), and alpha-tubulin as visual confirmation of the precision of protein loading and transfer. The image for each cell type is representative of 3 independent experiments for PAM (left panel) or FSL-1 (right panel), and the histograms represent the mean +- SEM of densitometric analysis of the ratio of phosphorylated p-p38 to t-p38, pERK1 to tERK1 or pERK2 to tERK2, expressed as fold activation compared with time 0. Values differ from time 0 when data were analyzed by ANOVA, using the Dunnett pairwise multiple comparison t test: *, P < .05.
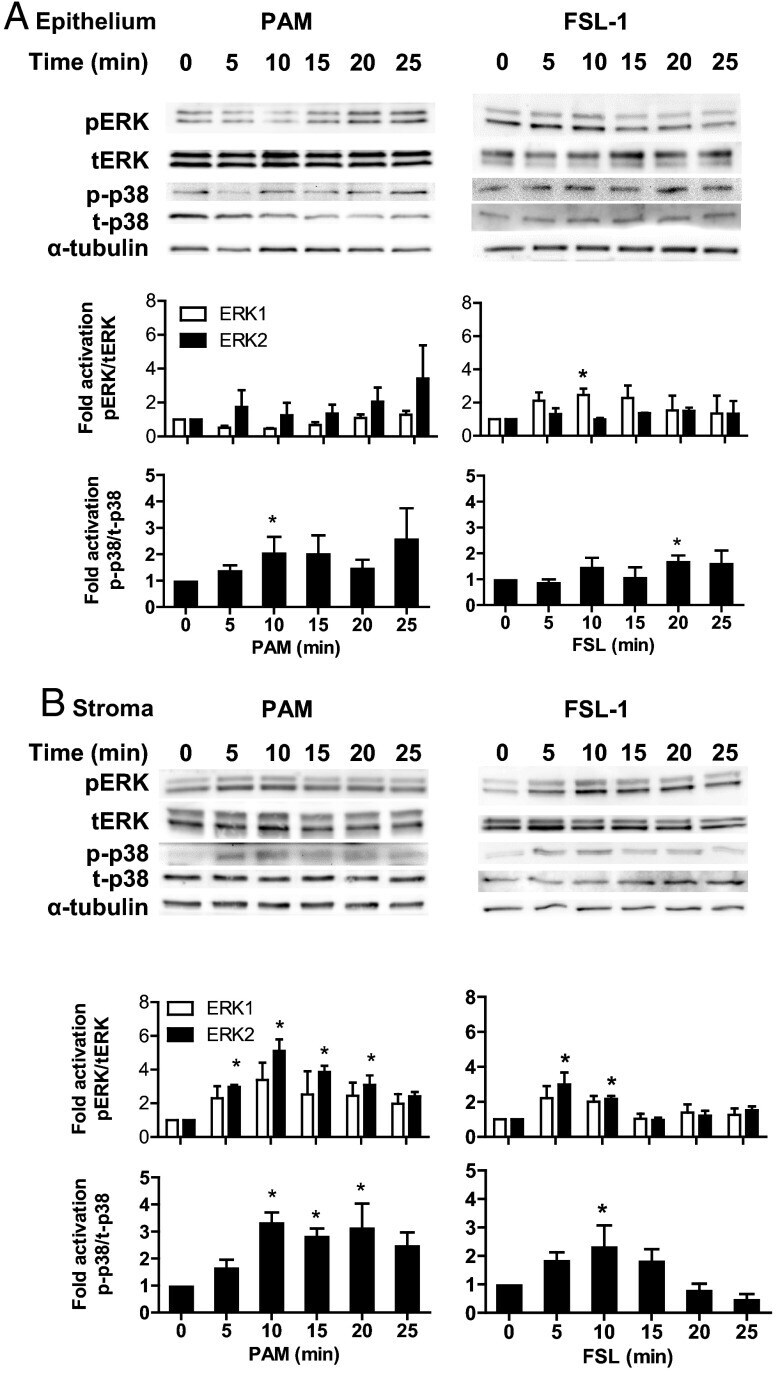
- Submitted by
- Invitrogen Antibodies (provider)
- Main image
- Experimental details
- Figure 1 Setup of combinatorial RNAi screen. A. Western blot showing the extent of ch-TOG protein reduction 42 hr after Doxycycline (Dox) induction in a cell line stably expressing ch-TOG shRNA. beta-actin is used as a loading control. B. Images showing that ch-TOG is depleted from the centrosomes and spindle MTs 42 hr after Dox addition. ch-TOG is in green, alpha-tub in red and DNA in blue in merged images. C. Workflow of RNAi screen. D. Image segmentation workflow to identify mitotic nuclei, segment mitotic cells and detect spindle poles. In yellow is a zoomed image from the final panel to show spindle pole segmentation. Scale bars are 10 mum. E. Graph showing the quantification of validation experiments. Mean +/- standard deviation (STD) of n = 4 is shown. Underneath the graph are representative images taken from the screening data to show the spindle phenotypes of each of the four conditions shown in the graph. alpha-tubulin is in yellow, PHH3 in green, RFP in red and DNA is in blue in merged images. All scale bars represent 10 mum.
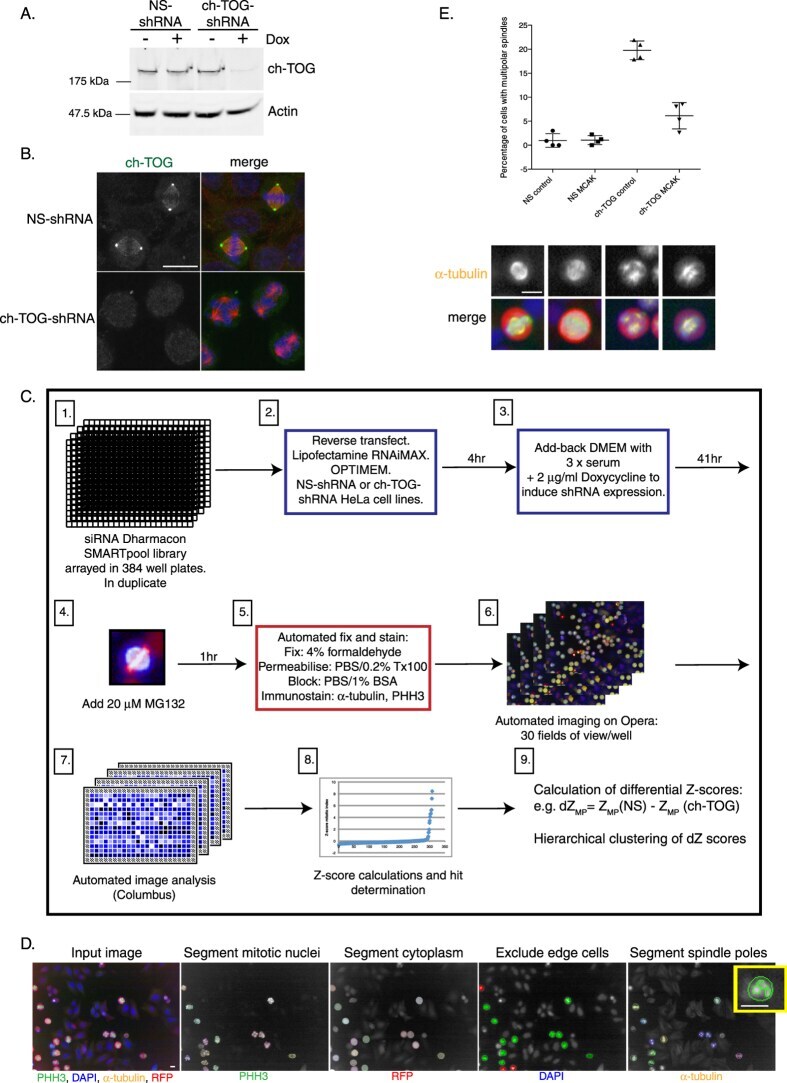
- Submitted by
- Invitrogen Antibodies (provider)
- Main image

- Experimental details
- Figure 2 Hierarchical clustering of differential Z (dZ) scores. Only genes that had a Z-score > +/-1 for changes in either percentage of cells with multipolar spindles or number of spindle poles per cell in ch-TOG shRNA cells are included here. Yellow represents a positive dZ score, blue represents a negative dZ score and darker shading represents a dZ score close to zero. On the right are representative images of alpha-tubulin staining from the screen for some of the genes listed. 'MN' refers to percentage of multinucleate cells. All scale bars represent 10 mum.
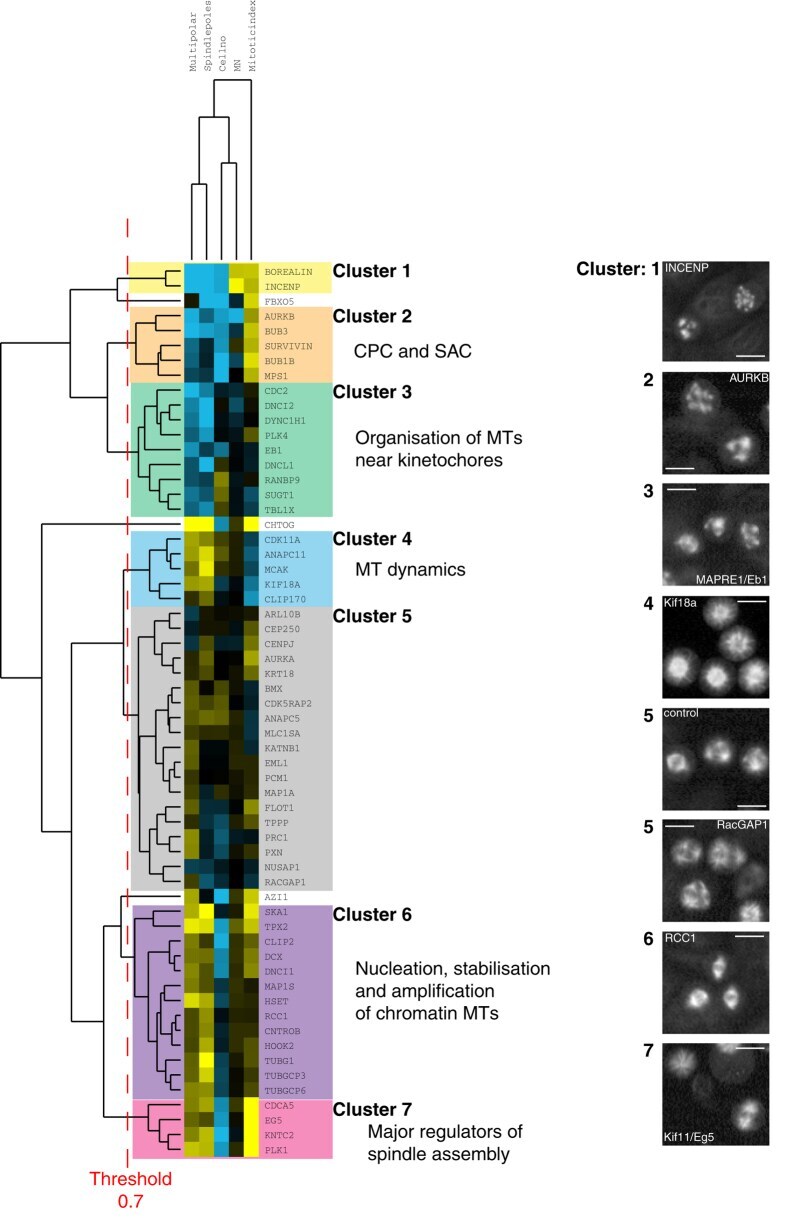
- Submitted by
- Invitrogen Antibodies (provider)
- Main image
- Experimental details
- Figure 3 Suppressing the chromatin-mediated spindle assembly pathway restores bipolar spindles to ch-TOG shRNA cells. A. Representative images of screening data of control, TPX2 and RCC1 siRNA in ch-TOG shRNA cells. alpha-tubulin is shown in green and PHH3 in red in merged images. Scale bar represents 10 mum. Graph shows the fold change in the percentage of cells with multipolar spindles across duplicate plates in the screen. B. Graph showing the validation of screening data with three independent siRNAs targeting TPX2. MCAK siRNA was included as a positive control. n = 3, mean +/- STD are shown. One-way ANOVA followed by Dunnett's test for multiple comparisons: **p
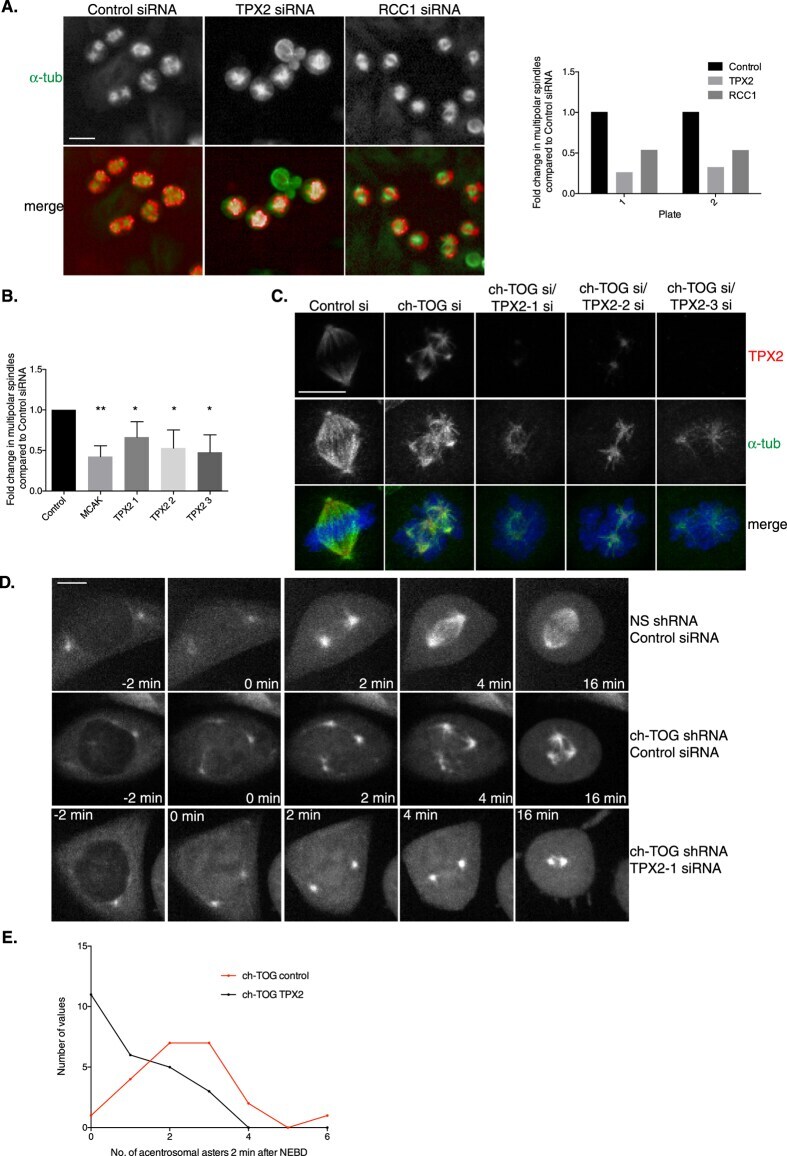
- Submitted by
- Invitrogen Antibodies (provider)
- Main image
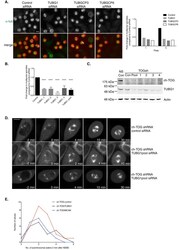
- Experimental details
- Figure 4 Depleting gamma-TuRC components restores bipolar spindle formation to ch-TOG depleted cells. A. Representative images of screening data of control, TUBG1, TUBGCP3 and TUBGCP6 siRNA in ch-TOG shRNA cells. alpha-tubulin is shown in green and PHH3 is shown in red in merged images. Scale bar represents 10 mum. Graph shows the fold change in the percentage of cells with multipolar spindles across duplicate plates in the screen. B. Graph showing the validation of our screening data with four independent siRNAs targeting TUBG1 and a re-test of the TUBG1 pooled siRNA. n = 3, mean +/- STD are shown. One-way ANOVA followed by Dunnett's test for multiple comparisons: ****p
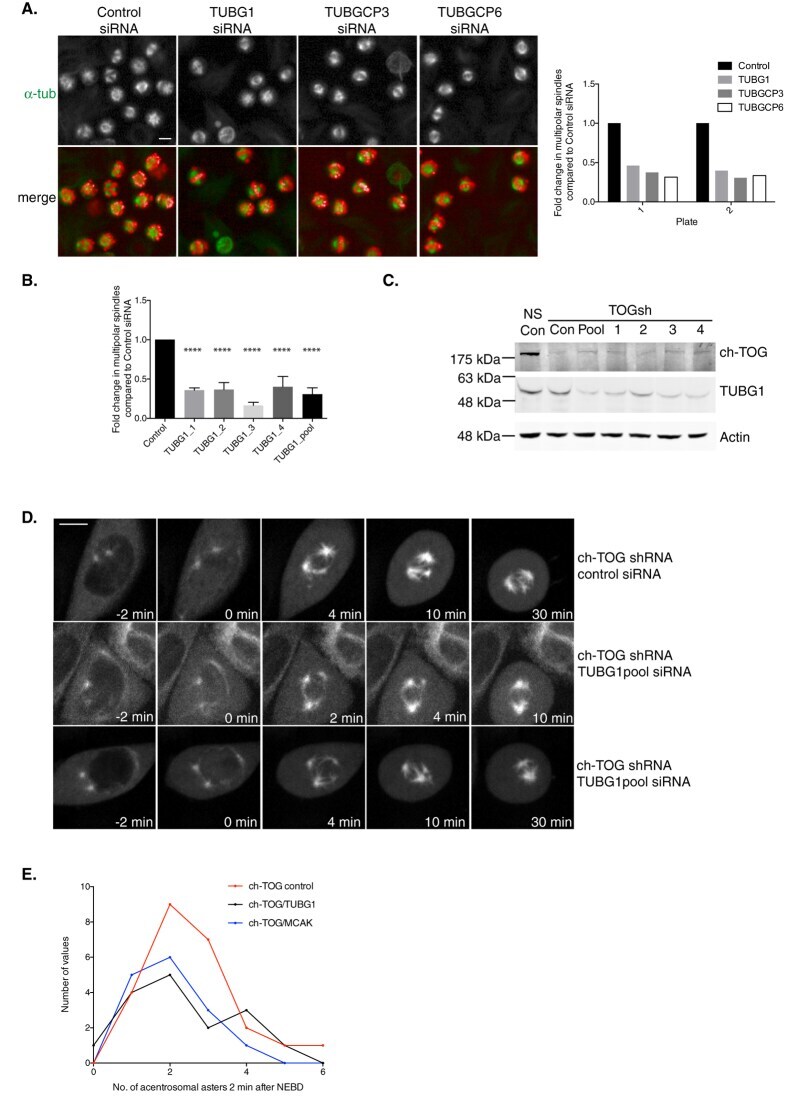
- Submitted by
- Invitrogen Antibodies (provider)
- Main image

- Experimental details
- Figure 5 ch-TOG and HSET interact during mitotic spindle formation. A. Representative images of control and HSET depleted ch-TOG shRNA cells. alpha-tubulin is in green and PHH3 is in red in merged images. Graph shows the fold change in the percentage of cells with multipolar spindles across duplicate plates in the screen. B. Graph showing the validation of our screening data with three independent siRNAs targeting HSET and a re-test of the HSET pooled siRNA. MCAK siRNA was included as a positive control in all experiments. n = 3, mean +/- STD is shown. One-way ANOVA followed by Dunnett's test for multiple comparisons: ****p
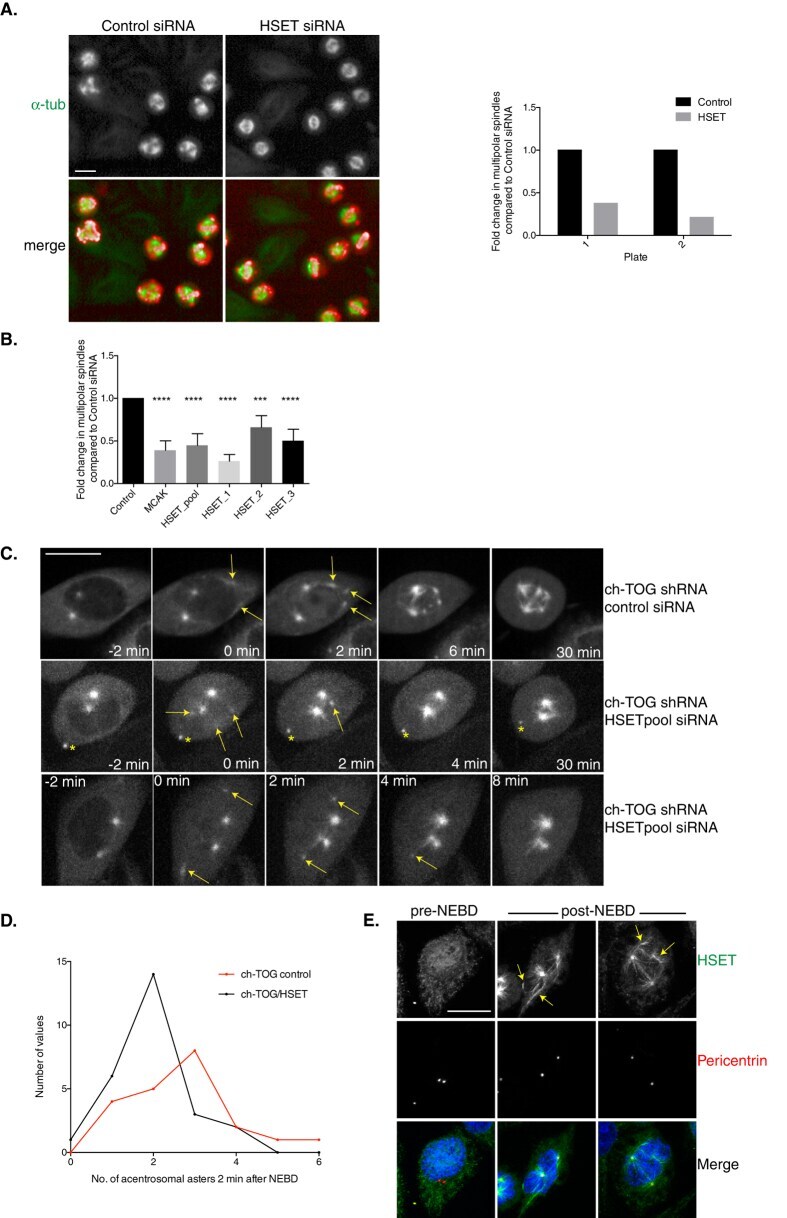
- Submitted by
- Invitrogen Antibodies (provider)
- Main image

- Experimental details
- Figure 6 ch-TOG maintains a balance between microtubule motor activities. A. Representative images of screening data of control, DNCL1, DYNC1H1 and DNCI2 siRNA in ch-TOG shRNA cells. alpha-tubulin is in green and PHH3 is in red in merged images. Scale bar represents 10 mum. Graph shows the fold change in the percentage of cells with multipolar spindles across duplicate plates in the screen. B. Graph showing the validation of our screening data with three independent siRNAs targeting DNCL1. n = 3, mean +/- STD is shown. One-way ANOVA followed by Dunnett's test for multiple comparisons: **p
- Submitted by
- Invitrogen Antibodies (provider)
- Main image
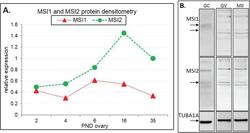
- Experimental details
- Figure 2 Immunoblot analysis of Musashi during ovary maturation. ( A ) Protein densitometry of full-length MSI1 and MSI2 in ovary time-course from post-natal day (PND) 2 through to sexual maturity at PND35. Protein expression relative to TUBA1A. For original immunoblots see Supplemental Figure S2 . n = 1. ( B ) Immunoblot of MSI1 and MSI2 in isolated granulosa cells (GC), germinal vesicle oocytes (GV), and in vitro matured metaphase II oocytes (MII). Positive expression of MSI1 was detected at the appropriate size of 39 kDa for isoform 1 and 34 kDa for isoform 2 (only in oocytes). Positive expression of MSI2 was detected at ~37 kDa. Protein expression was measured relative to TUBA1A loading control at 55 kDa. For immunoblots with molecular weight marker, see Supplemental Figure S2 .
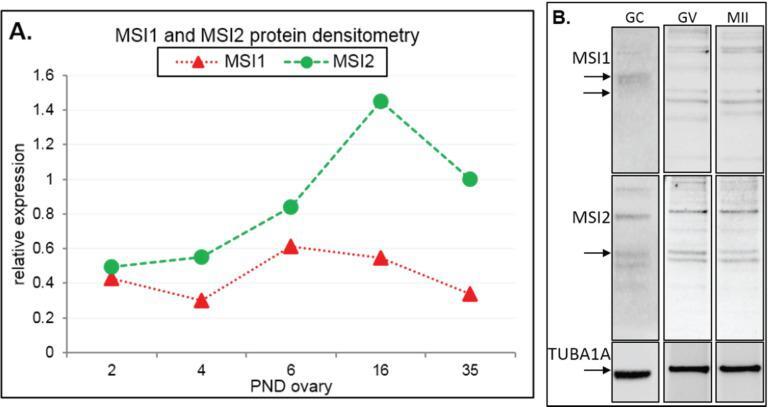
- Submitted by
- Invitrogen Antibodies (provider)
- Main image

- Experimental details
- Figure 6 Assessment of Msi2 Gt/Gt ovarian and oocyte health. ( A ) Immunofluorescence of TUNEL and CASPASE-3 in Msi2 Gt/Gt and Wt adult ovary. Representative images demonstrate an increase in TUNEL (green) and CASPASE-3 (red) in Msi2 Gt/Gt pre-antral (^) and antral ( + ) follicles, verified via quantitative analysis n = 4. Scale bar = 50 mum; ( B ) Msi2 Gt/Gt and Wt MII oocyte quality. MII oocytes collected from the oviductal ampullae of super-ovulated adult mice were fixed and subjected to immunocytochemistry for alpha-tubulin (green) to identify spindles and Hoechst (blue) to identify polar body DNA and oocyte chromosomes. Representative images show typical MII staining pattern in Wt depicting polar body (PB) formation and normal chromosome and spindle alignment (SP). Msi2 Gt/Gt images depict irregular spindle assembly and chromosome alignment and oocyte apoptosis. n = 3 biological replicates, 3 mice/replicate, *: denotes p < 0.05. Scale bar = 20 mum.
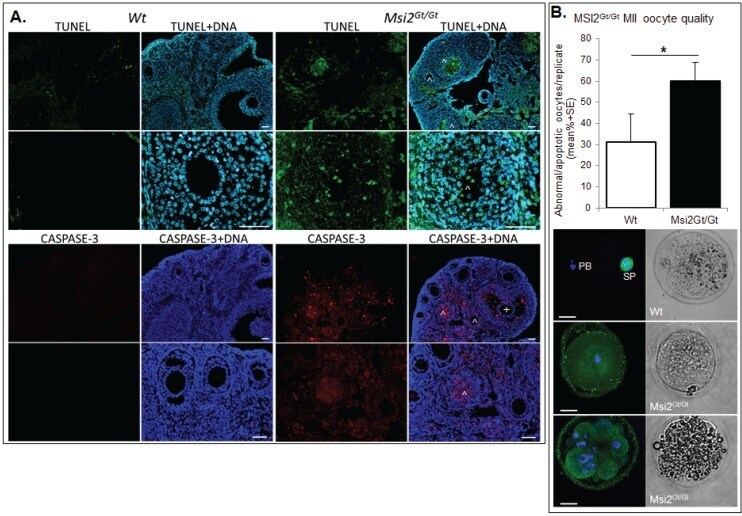
- Submitted by
- Invitrogen Antibodies (provider)
- Main image
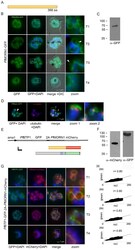
- Experimental details
- Fig. 3. Colocalization of BTP1 with MORN1. (A) Schematic of the structure of MORN1. (B) Localization of P . falciparum ( pf )MORN1-GFP in unfixed parasites. MORN1-GFP reveals a contractile ring structure that moves along the longitudinal axes of the nascent merozoite (T1-T4) with an additional punctate structure that might represent the centrocone (marked with arrowheads). Nuclei were stained with DAPI (blue). Enlargement of selected areas are marked with a white square and referred to as 'zoom' (a fourfold magnification). (C) Western blot analysis of MORN1-GFP-expressing parasites using antibodies against GFP shows a fusion protein of approximately 70 kDa (calculated molecular weight 67 kDa) using late-stage parasite material. (D) Colocalization of MORN1-GFP with alpha-tubulin (red) that highlights the microtubule-organizing centers (MTOCs) at this stage. Although the MORN1-marked ring structure is clearly distinct from the MTOC (zoom 1), there is a close association of the MTOC with the additional MORN1-marked structure (zoom 2). Nuclei were stained with DAPI (blue). (E) Schematic representation of the chimeric (BTP1-GFP)-2A-(MORN1-mCherry) protein that results from the bicistronic expression; the two individual proteins expressed from the entire cassette are shown. (F) Western blot analysis of the (BTP1-GFP)-2A-(MORN1-mCherry)-expressing cell line using antibodies against GFP (alpha-GFP) and mCherry (alpha-mCherry). 2A-mediated skipping results in two individual
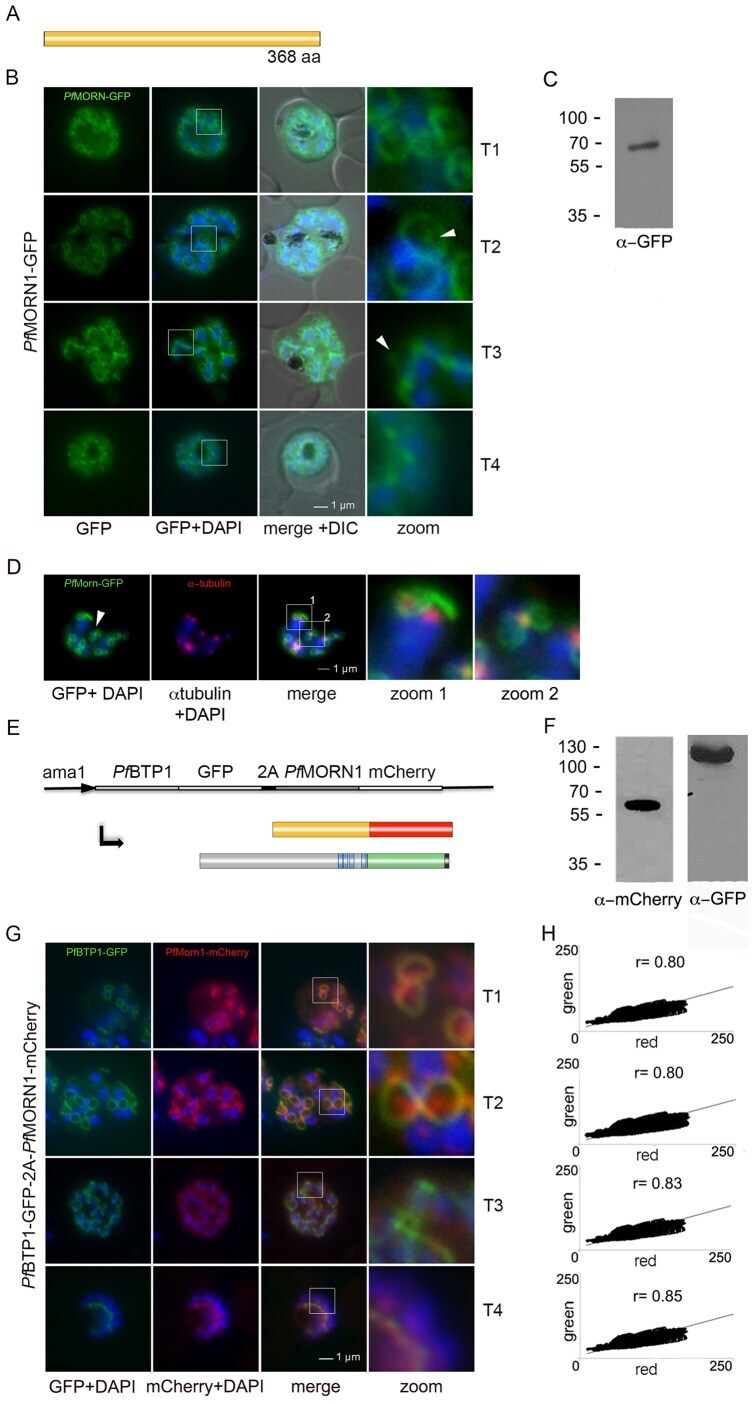
- Submitted by
- Invitrogen Antibodies (provider)
- Main image
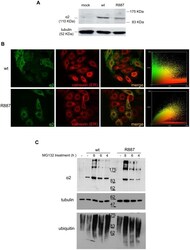
- Experimental details
- Figure 3 In vitro expression and localization of alpha2-ATPase . A. Immunoblot of HeLa cells transfected with pA2-wt-Myc (wt) and pA2-R887-Myc (R887) probed with anti alpha2-ATPase antibody. B. Calnexin (red) and alpha2 ATPase (probed with anti-myc; green) immunofluorescence staining of wt or R887 transfected Hela cells. R887 alpha2 ATPase mostly colocalises with the endoplasmic reticulum. In the right graphs, the scatter plot of red (ch1) vs. green (ch2) colocalization intensities. (wt parameters: Rr 0.369, R 0.6, Ch1:Ch2 0.999; R887 parameters: Rr 0.558, R 0.755, Ch1:Ch2 0.997). C. HeLa cells expressing wt or R887 variant of alpha2 ATPase are treated with the reversible proteasome inhibitor MG132 (10 uM for 4, 6 and 8 hrs). Blots are probed with anti- alpha2 isoform antibody, anti-ubiquitin antibody and anti-tubulin as loading control.

- Submitted by
- Invitrogen Antibodies (provider)
- Main image
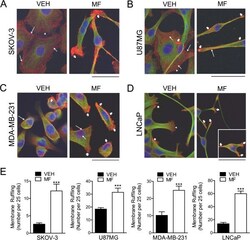
- Experimental details
- Figure 5 Effect of mifepristone on cytoskeletal actin fibers and tubulin filaments. SKOV-3 (A) , U87MG (B) , MDA-MB-231 (C) or LNCaP (D) cells were cultured in the presence of vehicle (VEH) or a cytostatic concentration of mifepristone (MF) for 72 h, following which immunofluorescence was used to visualize the cytoskeletal protein alpha-tubulin. AlexaFluor (r) 594 phalloidin was utilized to visualize F-actin and DAPI to label cell nuclei. Images were taking using confocal microscopy. Scale bar = 50 mum. The inset in panel D represents a cell that was in a different field within the same image and that denotes the characteristic increase in membrane ruffles induced by MF (for the complete image see Additional file 4 : Figure S4). In A-D , long, thin arrows, cortical actin; short, thin arrows, stress fibers; arrowheads, lamellipodia; short, wide arrows, membrane ruffles. Panel E represents the quantification of the membrane ruffles in culture for all cell lines studied in response to MF. Ruffles were counted from confocal microscopy images. We expressed membrane ruffling as number of ruffles counted every 25 cells, after assessing a minimum of 75 cells and a maximum of 250 cells per experimental group, according to the density of the cell culture. *** p < 0.01 vs. VEH (Student's t -test).
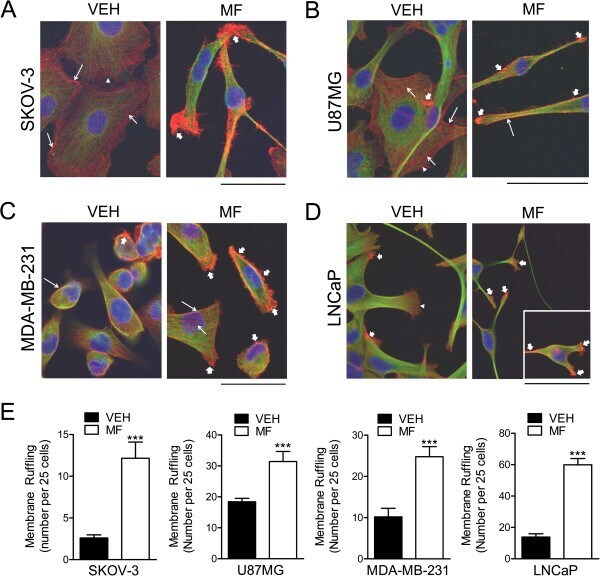
- Submitted by
- Invitrogen Antibodies (provider)
- Main image
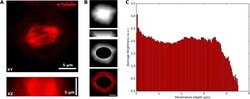
- Experimental details
- Figure 7 Penetration of immunolabeling in REMI media. A STED volume image of a mouse fibroblast cell, partially rounded while undergoing mitosis, demonstrates antibody penetration when alpha-Tubulin is labeled for precisely two hours. ( A ) averaged projections in the lateral and axial dimensions have visually homogeneous labeling. ( B ) labeling can be mapped onto the distance from the exterior of the cell (lateral and axial profiles, top), optionally removing the bright mitotic spindle labeling (bottom). ( C ) A plot of average intensity as a function of depth within the cell demonstrates uniform labeling inward to the edge of the distance map when the nucleus is excluded. Volume size: 20mum x 20mum x 5.5mum. Scale bar: 5 mum.
- Submitted by
- Invitrogen Antibodies (provider)
- Main image
- Experimental details
- Fig. 4 Effects of BME on hepatic metabolic signaling pathway. (A) protein expressions of liver SIRT1 (B), phosphorylated AMPK, ACC (C),SIRT1, Foxo1, PPARalpha and SREBP1c were determined by Western blotting. HFDwas used as a control and beta-actin, alpha- tubulin ware used as a loadingcontrol.
- Submitted by
- Invitrogen Antibodies (provider)
- Main image
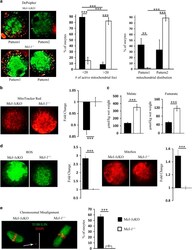
- Experimental details
- Figure 4 Markers of mitochondrial function and chromosomal alignment. ( a ) Mcl-1 cKO ( n =57) and Mcl-1 +/+ ( n =85) MII oocytes were stained with a potential dependent mitochondrial dye (DePsipher). Values in graph (left) represent a proportion (%) of oocytes with few (20) polarized (red) mitochondrial foci+-S.E.M. per Mcl-1 cKO or Mcl-1 +/+ oocytes. Values in graph (right) represent the proportion (%) of oocytes with mitochondrial distribution separated into pattern 1 or pattern 2+-S.E.M. ( b ) Mean intensity of Mcl-1 cKO ( n =68) and Mcl-1 +/+ ( n =52) MII oocytes stained with MitoTracker Red. Values represent average fold change+-S.E.M. of relative fluorescence units (RFUs) per oocyte, normalized to wild type. ( c ) Mcl-1 cKO ( n =15) and Mcl-1 +/+ ( n =15) oocytes were assayed for levels of TCA cycle substrates malate and fumarate. Values represent average metabolite level ( mu mol) per oocyte wet weight (kg)+-S.E.M. ( d ) MII oocytes were stained with DCFDA (green) ( Mcl-1 cKO ( n =20) and Mcl-1 +/+ ( n =17)) or with MitoSox (red) ( Mcl-1 cKO ( n =20) and Mcl-1 +/+ ( n =24)). Values represent average fold change+-S.E.M. of RFUs per oocyte, normalized to wild type. ( e ) MII oocytes were stained with DAPI (red) and anti-tubulin (green) to visualize chromatin and spindle; chromosomal misalignments (white arrow) from Mcl-1 cKO ( n =84) and Mcl-1 +/+ ( n =89) oocytes were quantitated. Values represent percentage of oocytes with misaligned chromosomes/tot

- Submitted by
- Invitrogen Antibodies (provider)
- Main image

- Experimental details
- Figure 5 De Novo Drug Resistance Is Associated with Increased Ciliogenesis and Ciliary Signaling (A) A549 cells were treated with 50 nmol/L trametinib (Tram) or DMSO (vehicle control) for the indicated times, and then fixed and stained with antibodies for acetylated tubulin (green), Arl13B (red), gamma-tubulin (blue/inset), and DAPI (blue). Note that exposure to trametinib promoted a significant increase in cilia, cilia length, and fragmentation. (B) Western blot showing levels of phosphorylated ERK, total ERK, vinculin (loading control), phospho-FRS2, and alpha-tubulin (loading control) in the presence and absence of 50 nM trametinib (Tram) in A549 cells. Note that, after 48 and 72 hr of trametinib exposure, pERK was reduced. Phospho-FRS2 levels increased after 72 hr of trametinib treatment. (C-E) Quantification of ciliated cells (C), cilia length (D), and fragmentation (E) for cells shown in (A). n = 150 cilia. Error bars represent the SD. p < 0.05 unpaired t test. (F) Cell viability in A549 cells after treatment with the MEK inhibitor trametinib in control cells (siCONT) or upon downregulation of the distal appendage protein SCLT1 (siSCLT1). Cell viability was normalized to siCONT DMSO control (0 nM) cells. n = 3, p < 0.0001 for 0 nM, p < 0.008 for 1.56 nM, p < 0.0009 for 6.25 nM, and p < 0.003 for 12.5 nM, unpaired t test. (G) A549 cells transfected with siRNA for SCLT1 (siSCLT1) had reduced ciliated cells compared to siRNA control (siCONT). n = 300. Error bars represent
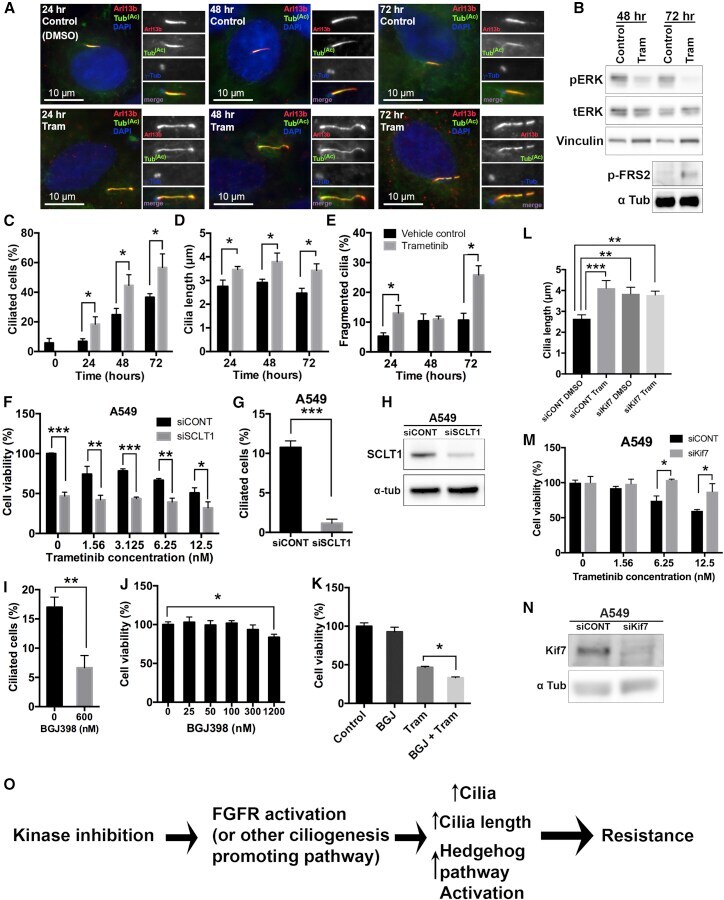
- Submitted by
- Invitrogen Antibodies (provider)
- Main image
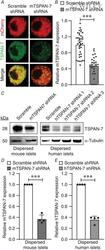
- Experimental details
- 2 Figure Knockdown of islet TSPAN-7 utilizing lentiviral shRNA delivery A , representative mouse islet cell immunofluorescence imaging showing TSPAN-7 KD relative to scramble shRNA controls (mCherry, red; TSPAN-7, green). B , average TSPAN-7 immunofluorescence of mouse islet cells expressing mTSPAN-7 shRNA (dark grey; n = 28 islet cells) relative to scramble shRNA controls (white; n = 37 islet cells); P = 5.0 x 10 -11 . C , representative western blot showing TSPAN-7 KD in dispersed mouse islet cells (upper left) relative to alpha-tubulin (lower left) and representative western blot of TSPAN-7 KD in dispersed human islet cells (upper right) relative to alpha-tubulin (lower right). D , average TSPAN-7 protein in dispersed mouse islet cells expressing mTSPAN-7 shRNA (dark grey; n = 4 mice) relative to scramble shRNA controls (white; n = 4 mice); values normalized to alpha-tubulin protein; P = 0.0005. E , average TSPAN-7 protein in dispersed human islet cells expressing hTSPAN-7 shRNA (light grey; n = 4 islet donors) relative to scramble shRNA controls (white; n = 4 islet donors); hTSPAN-7 shRNA refers to hTSPAN-7 shRNA 3; values normalized to alpha-tubulin protein; P = 0.0003. Statistical analysis was conducted using an unpaired two-sample t test ( B ) or one-sample t tests ( D and E ); uncertainty is expressed as the 95% CI.
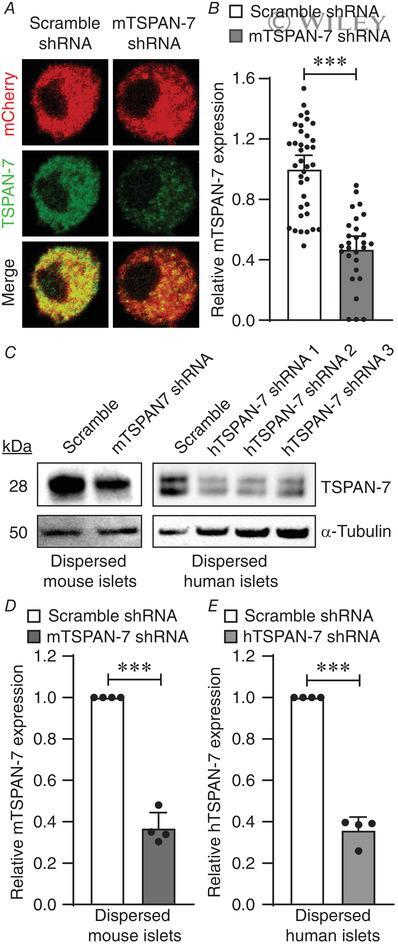
- Submitted by
- Invitrogen Antibodies (provider)
- Main image
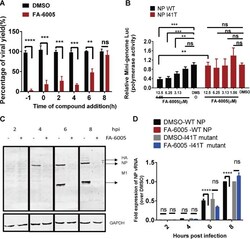
- Experimental details
- FIG 3 FA-6005 inhibits virus transcription and replication. (A) Time-of-addition experiments examining the effect of FA-6005 on various stages of the IAV life cycle. (B) FA-6005 exhibits inhibition of the parental virus NP activity but not the resistant I41T variant virus NP activity in a luciferase (Luc) reporter assay. (C) FA-6005 abolishes viral protein synthesis. MDCK cells were infected with IAVs at an MOI of 10 in the presence of 20 muM FA-6005. DMSO was added as a negative control. hpi, hours postinfection. (D) FA-6005 inhibits viral NP vRNA synthesis. **, results were significantly different from those of each control by Dunnett''s t test ( P < 0.005); ***, results were significantly different from those of each control by Dunnett''s t test ( P < 0.0005); ****, results were significantly different from those of each control by a t test ( P < 0.0001).
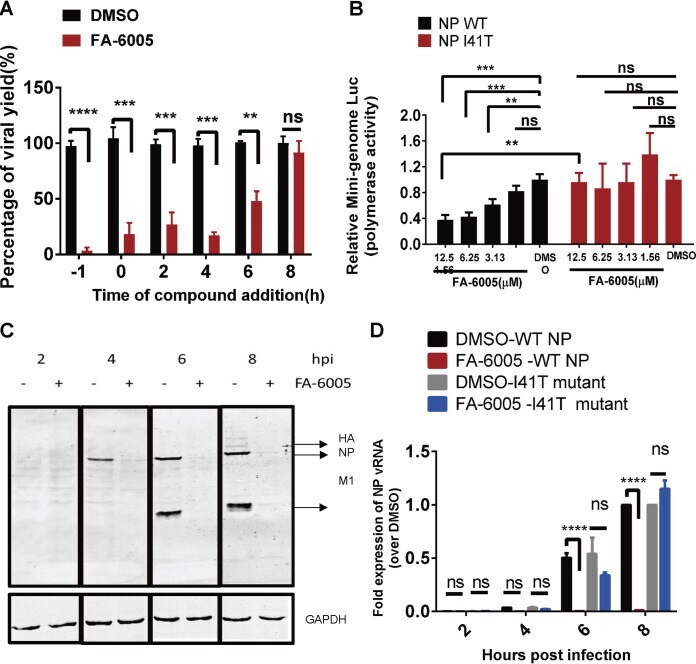
- Submitted by
- Invitrogen Antibodies (provider)
- Main image
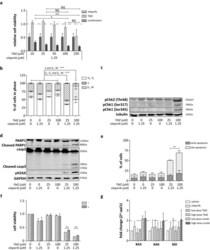
- Experimental details
- Fig. 3 Low-dose olaparib and TMZ combination treatment in DSRCT cells. a Relative cell viability following 120 h simultaneous combination treatment of olaparib (1.25 uM) with increasing concentrations TMZ (10; 25; 50; 100; 250 uM). Dotted line represents the cell viability of vehicle-treated cells. b Cell-cycle arrest, c pChk1/2 expression (*: a-specific antibody binding at ~ 65 kDa), d PARP1 and caspase-3 (casp3) cleavage, DNA damage (gammaH2AX) and e induction of early and late apoptotic cells following 24-h treatment of low-dose (25 uM) and high-dose (100 uM) TMZ combined with olaparib (1.25 uM) in JN-DSRCT-1 cells. f Relative cell viability following 120-h single-agent olaparib (1.25 uM), TMZ (25 or 100 uM) and simultaneous low-dose and high-dose combination treatment in absence (-) and presence (+) of the pan-caspase inhibitor zVAD.FMK. g Pro-apoptotic protein BAX, BAK and BID mRNA expression following 24-h vehicle, single-agent olaparib (1.25 uM), TMZ (25 or 100 uM) and simultaneous low-dose and high-dose combination treatment. Dotted line represents the twofold change threshold. * p value < 0.05, ** p value < 0.01, *** p value < 0.001

- Submitted by
- Invitrogen Antibodies (provider)
- Main image
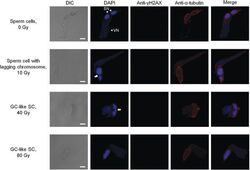
- Experimental details
- Fig. 3 Abnormalities in the sperm nuclei derived from irradiated pollen grains . The male gametes were isolated from the pollen tubes cultured for 24 h. The merged images show nuclei stained with DAPI (pseudocolour: blue), gammaH2AX stained with anti-gammaH2AX antibody followed by secondary antibody (pseudocolour: green) and microtubules stained with anti-alpha-tubulin antibody followed by secondary antibody (pseudocolour: red). The white and yellow arrows indicate lagging chromosome and chromosomal bridges, respectively. VN, vegetative nucleus; SN, sperm nucleus. Bars = 10 mum.
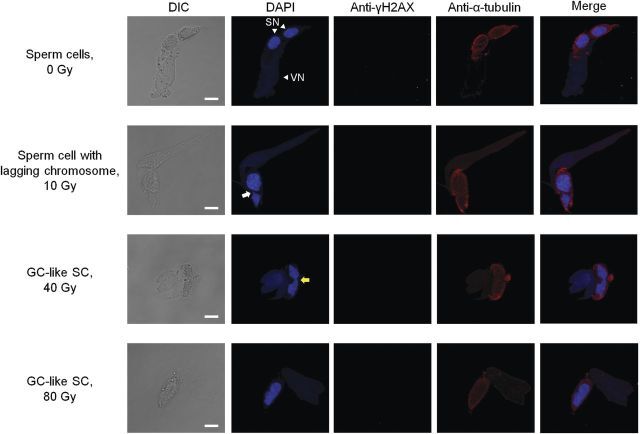
- Submitted by
- Invitrogen Antibodies (provider)
- Main image
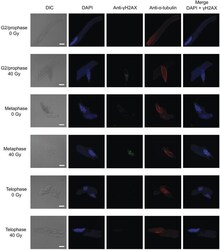
- Experimental details
- Fig. 4 Detection of gammaH2AX in the nuclei of male gametes . The male gametes were isolated from the pollen tubes cultured for 12 h. Merged images show nuclei stained with DAPI (pseudocolour: blue) and gammaH2AX stained with anti-gammaH2AX antibody followed by secondary antibody (pseudocolour: green). Bars = 10 mum.
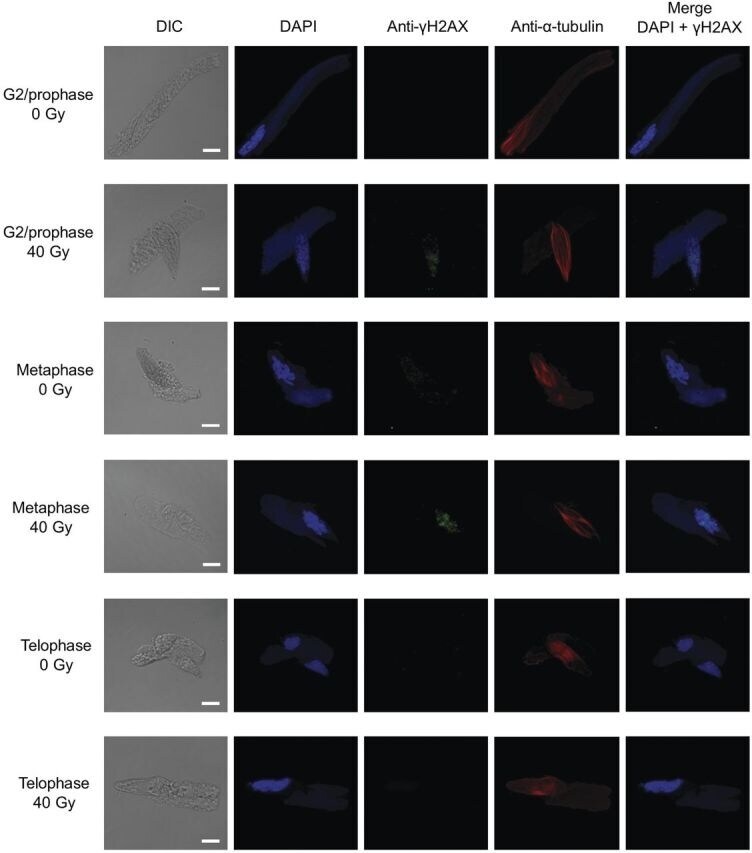
- Submitted by
- Invitrogen Antibodies (provider)
- Main image
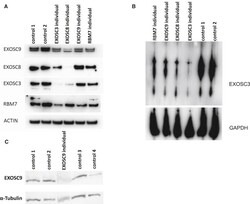
- Experimental details
- Figure 3 The Exosome Complex Is Reduced in Affected Individuals' Fibroblasts (A) Immunoblotting of fibroblasts from affected individuals with variants in different components of the exosome complex (the homozygous c.92G>C in EXOSC3 , the homozygous c.5C>T in EXOSC8 , the homozygous c.41T>C in EXOSC9 [individual 1:II-1], and the homozygous c.236C>G in RBM7 ) shows reduced EXOSC9, but other components of the exosome complex were also reduced. Actin was used as a loading control. (B) Blue native polyacrylamide gel electrophoresis (BN-PAGE) shows that there is a reduction of the assembly of the whole exosome complex in affected individuals' fibroblasts. GAPDH was used as a loading control. (C) Immunoblot on muscle extracts from affected individual 2:II-1 and four controls confirms that EXOSC9 was severely reduced in affected individual 2:II-1.

- Submitted by
- Invitrogen Antibodies (provider)
- Main image

- Experimental details
- Figure 3 Chromosome segregation of mitotic T. gondii -infected BUVEC. Mitotic T. gondii -infected BUVEC and non-infected cells were stained for chromosomes via phosphor-HH3 S10 (green) and for mitotic spindle via alpha-Tubulin (red) and analyzed via confocal microscopy. Arrowhead indicates a disalignment of a chromosome (metaphase), white arrows indicate the presence of more than two-spindle poles in anaphase. Scale bar: 5 um.
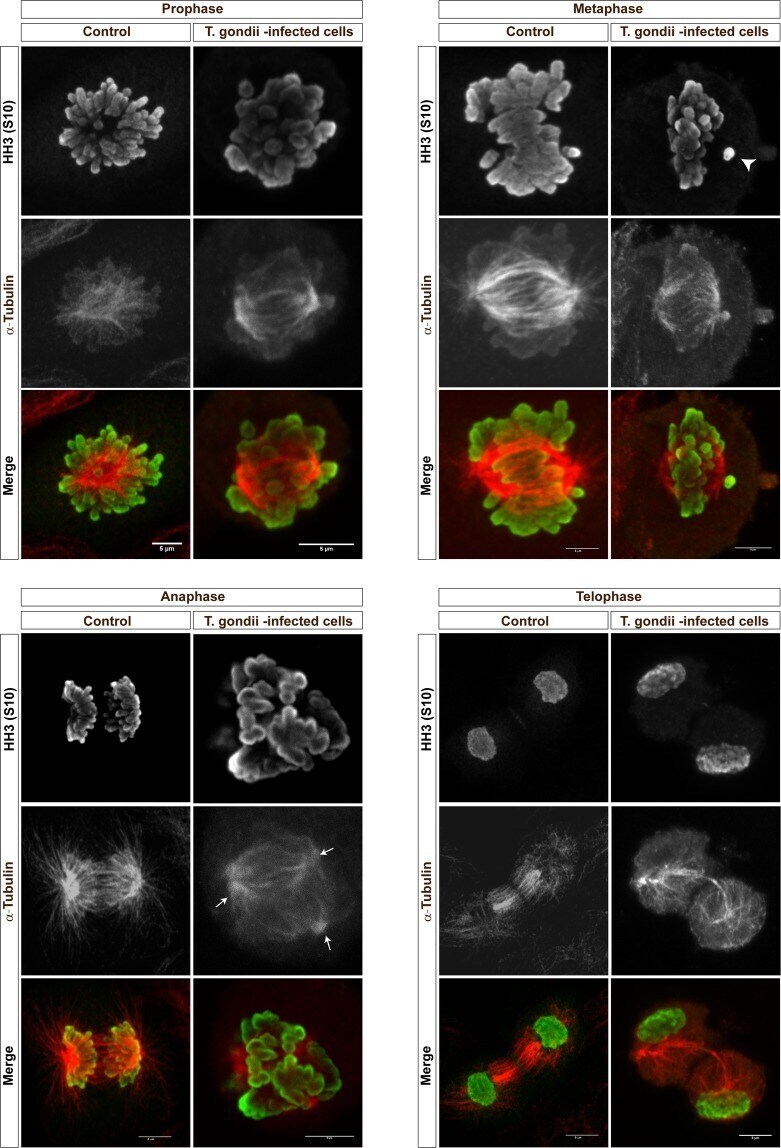
- Submitted by
- Invitrogen Antibodies (provider)
- Main image
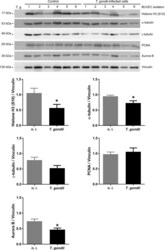
- Experimental details
- Figure 4 Histone H3, alpha-tubulin, gamma-tubulin, PCNA and Aurora B expression in T. gondii -infected BUVEC. Protein extracts from non-infected and T. gondii- infected BUVEC (six biological replicates) were subjected to Western blotting and analyzed for Histone H3 (S10), alpha-tubulin, gamma-tubulin, PCNA and Aurora B expression. Pure T. gondii tachyzoites were analyzed in parallel for control reasons. The density of the protein signals was quantified and graphed as ratio relative to vinculin as housekeeping protein. Bars represent the median +- SEM. Bars represent the median +- SEM. t- test, * p
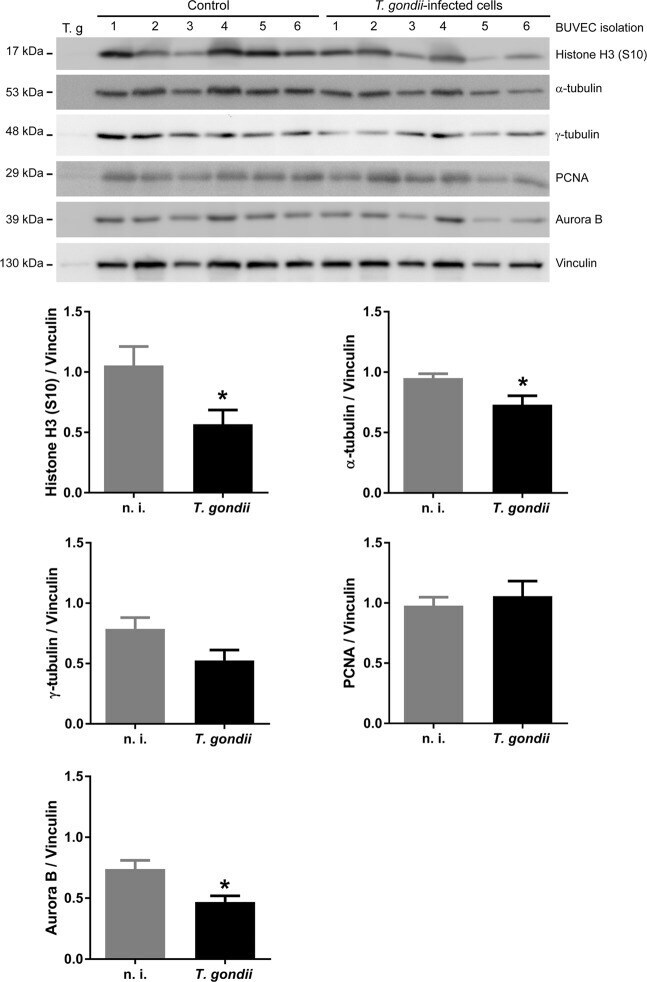
- Submitted by
- Invitrogen Antibodies (provider)
- Main image
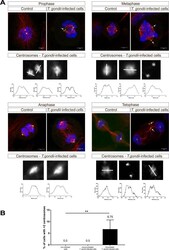
- Experimental details
- Figure 5 Mitotic spindle and centromer formation in T. gondii -infected BUVEC. ( A ) T. gondii -infected BUVEC and control cells were stained for chromosomes by DAPI (blue), for mitotic spindles by alpha-Tubulin (red) and for centromeres by gamma-Tubulin (green) and analyzed via confocal microscopy. Additionally, the intensity of centromer-related signals was assessed and plotted as a graph showing intensity value vs distance (in um). Scale bar represents 5 um. ( B ) The number of centrosomes in mitotic cells, in T.gondii-infected BUVEC and control cells, were counted, and graph as a percentage of the total mitotic cells in the monolayer. Bars represent the median +- SEM. Bars represent the median +- SEM. Nonparametric one-way ANOVA (Kruskal-Wallis post-test), ** p
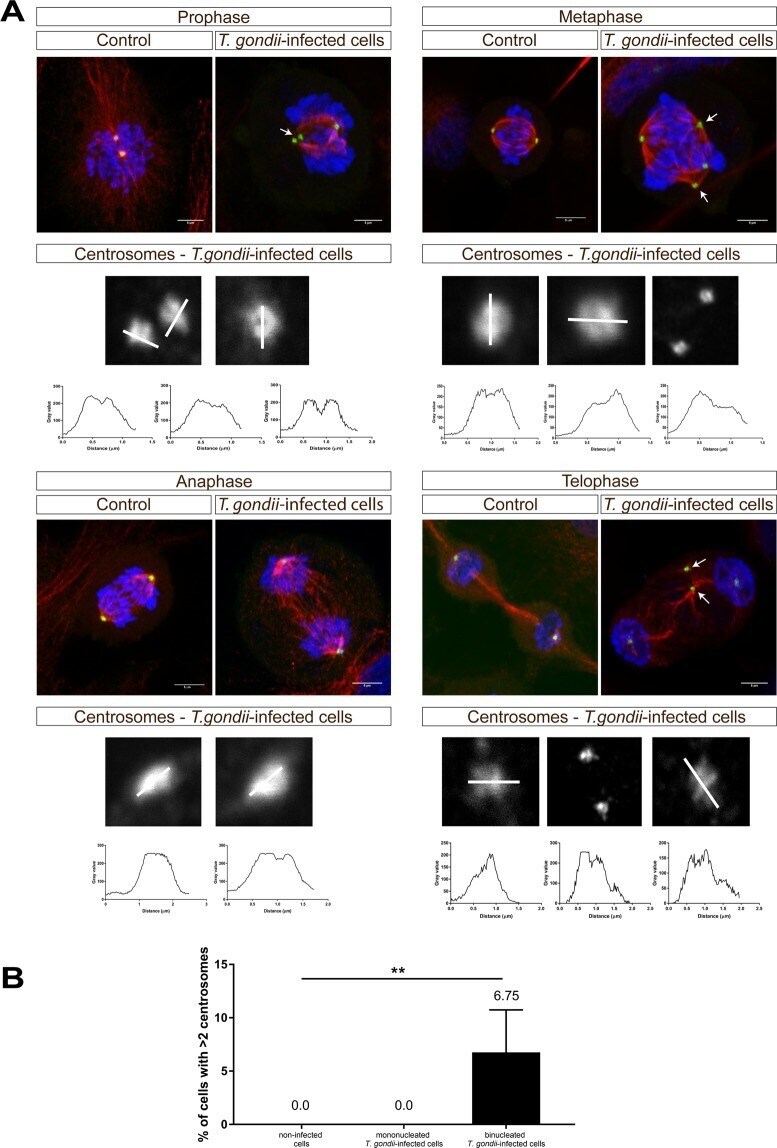
- Submitted by
- Invitrogen Antibodies (provider)
- Main image
- Experimental details
- Fig 4 Western blot analysis of infected cell lysates and sucrose gradient-purified virions. (A, B) Analysis of cell-associated proteins. LLC-MK2 (A) or Vero (B) cells were infected with the indicated rHPIV3-RSV-F vectors or wt rHPIV3 at an MOI of 3 TCID 50 /cell or with wt RSV at an MOI of 3 PFU/cell and incubated for 48 h at 32degC, after which cells were lysed in denaturing and reducing sample buffer and analyzed by Western blotting. RSV F was detected with a mouse anti-RSV F MAb; note that expression of F protein by RSV in LLC-MK2 cells (A) was below the level of detection due to inefficient infection by RSV in that cell type. rHPIV3 N and P proteins were detected with rabbit polyclonal hyperimmune serum against HPIV3 virions; rHPIV3 F was detected with a rabbit hyperimmune serum against recombinant purified F ectodomain; and rHPIV3 HN was detected with a hyperimmune rabbit serum raised against an HN peptide. Tubulin was detected on all blots as a loading control using a mouse anti-tubulin MAb. Secondary antibodies are described in Materials and Methods. Representative blots are shown. (C) Analysis of purified virions. LLC-MK2 cells were infected with the indicated rHPIV3-RSV-F vectors or wt rHPIV3 at an MOI of 0.1 TCID 50 /cell, and Vero cells were infected with RSV at an MOI of 0.1 PFU/cell (LLC-MK2 cells were used for rHPIV3, but Vero cells were used for RSV because they are more permissive) and incubated at 32degC. Culture medium supernatants were collected, clarified
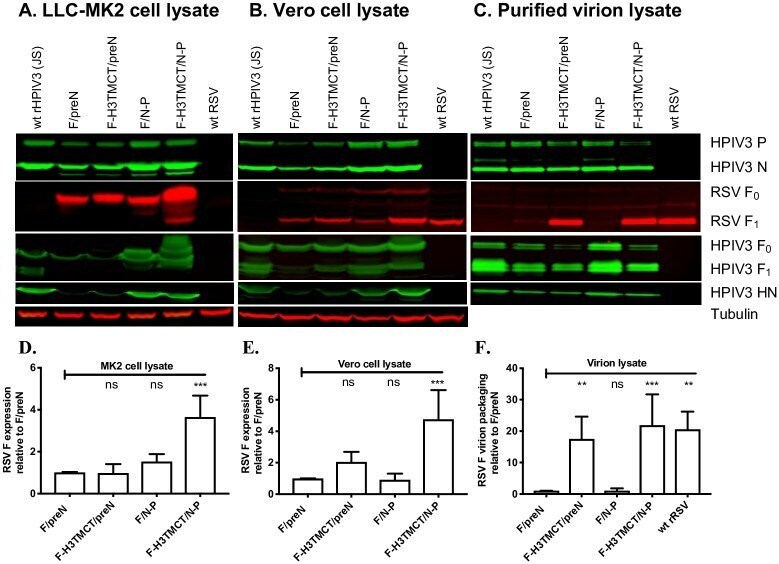
- Submitted by
- Invitrogen Antibodies (provider)
- Main image
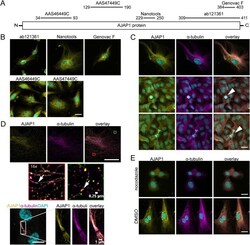
- Experimental details
- Fig. 3. AJAP1 co-localizes with microtubules in HUVECs. (A) Schematic overview of the epitope binding sites for antibodies used to detect AJAP1 in HUVECs. The antibody recognition sites are mapped to the polypeptide chain. The numbers indicate the amino acid positions on the AJAP1 polypeptide chain. (B) Detection of AJAP1 (yellow) using antibodies with different epitope recognition sites shows fibrillar structures in HUVECs. Cell nuclei were counterstained with DAPI (cyan). Scale bar: 25 um. (C) Immunostaining of AJAP1 (Genovac antibody, yellow) and alpha-tubulin (magenta) shows AJAP1's association with microtubules in HUVECs. The microtubule association is independent from the confluence of the culture. HUVECs were grown until confluence and fixed after seven days. AJAP1 is additionally localized to microtubules contributing to the spindle apparatus during cell division (arrowhead). Further, numerous AJAP1-positive puncta are localized in the perinuclear region. Cell nuclei were counterstained with DAPI (cyan). Microscope: Zeiss LSM 780; objective lens: Plan-Apochromat 63x/1.40 Oil DIC M27; scale bar: 25 um. (D) Structured illumination microscopy (SIM) gives a detailed view of the co-localization of AJAP1 and microtubules in HUVECs. AJAP1 localizes in close proximity to the tubular network lining the fibers (arrows). During mitosis and cell division, AJAP1 co-localizes with the spindle apparatus. Microscope: Zeiss Elyra; objective lens: Plan-Apochromat 63x/1.4 Oil DIC M27;
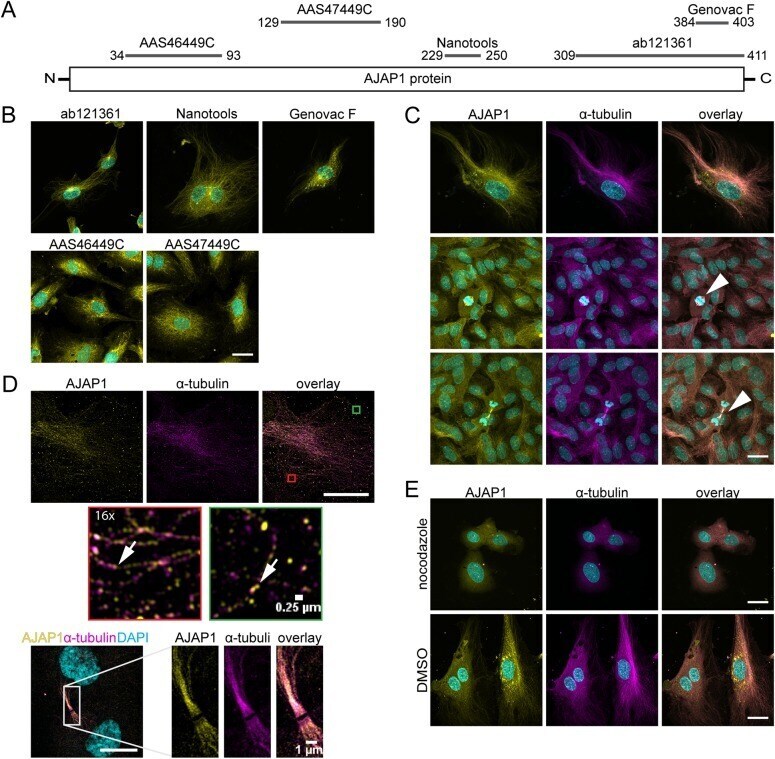
- Submitted by
- Invitrogen Antibodies (provider)
- Main image

- Experimental details
- Figure 9 Immuno-SE-HIM of alpha-tubulin in COS7 cells. The use of Au labels and SE-HIM is essential to distinguish the microtubules of COS7 cells. alpha-tubulin and PDI in COS7 cells cultured on an ASEM dish, were tagged with Alexa Fluor (r) 488-Nanogold and Alexa Fluor (r) 594, respectively. After FM and confirmation of Au labeling by ASEM, dehydrated/dried cells were observed by SE-HIM. (A) FM of alpha-tubulin. (B) FM of PDI in the same region. (C) ASEM, almost corresponding to A. (D) Image of rectangle d in C. (E and F) Image of rectangles e and f in C, respectively. (G-J) SE-HIM. (G) SE-HIM corresponding to A; the boundary between the SiN/Si bilayer and the SiN film can be seen. The nucleus and endoplasmic reticulum are very dark, but there are still bright filaments in the cytoplasm; compare C. (H) Image of rectangle h in G. (I) Image of the rectangle i in G. The filamentous lines are comprised of white dots, i.e., signals from Au sedimentation. (J) Image of rectangle j in G. Microtubules in filopodia were visualized by this method. The SE-HIM and ASEM images appear similar, with the exception of the inversely contrasted organelle. ASEM, atmospheric scanning electron microscopy; Au, gold; FM, fluorescence microscopy; PDI, protein disulfide isomerase; SE-HIM, secondary electron-helium ion microscopy; SiN/Si, silicon nitride/silicon.
- Submitted by
- Invitrogen Antibodies (provider)
- Main image

- Experimental details
- Figure 3 Effect of A9(B8) and erlotinib on EGFR and ERK phosphorylations. Immunoblotting assays were performed to determine the effects of compound and antibody on EGFR or ERK phosphorylation in NCI-H1975 cells. (A) NCI-H1975 cells were treated with A9(B8) in a dose-dependent manner for 6, 12, and 24 hours. Cells without treatment (control) or treated with IgG at a concentration of 1.2 muM (IgG) were utilized as the individual control for the defined time. (B) NCI-H1975 cells were treated with erlotinib in a dose-dependent manner in the presence or absence of 0.3 muM A9(B8) for 12 hours. (C) Relative ratio between p-ERK and ERK in B. IgG at a concentration of 0.3 muM was utilized as the control. Figure 3
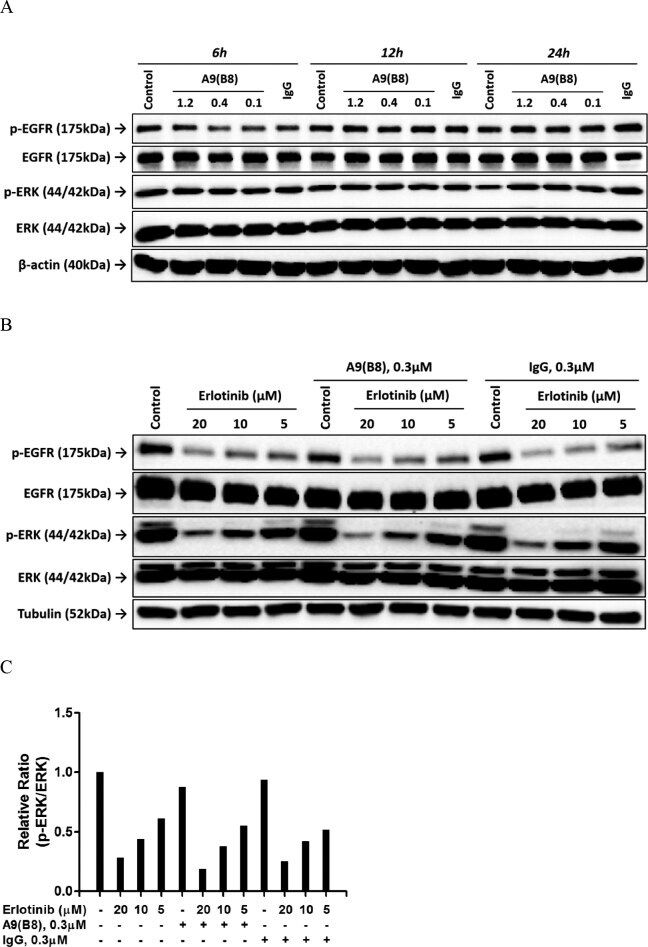
- Submitted by
- Invitrogen Antibodies (provider)
- Main image
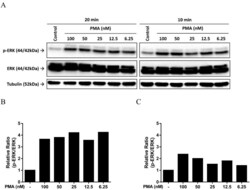
- Experimental details
- Figure 4 PMA stimulated ERK phosphorylation. Immunoblotting assays (A) and the following semiquantitative analysis (B and C) were performed to determine the effects of PMA on ERK phosphorylation in NCI-H1975 cells. NCI-H1975 cells were treated by PMA in a dose-dependent manner for the defined time of 20 minutes (B) or 10 minutes (C). Figure 4

- Submitted by
- Invitrogen Antibodies (provider)
- Main image

- Experimental details
- Fig. 1 Filamentous actin spans the entire microtubule spindle volume in human metaphase II oocytes. a Representative z -projection of a metaphase II oocyte. Microtubules (alpha-tubulin), gamma-tubulin, and actin (phalloidin) merge at the spindle poles; z = 6 sections. Representative of n = 5 oocytes. Scale bar, 10 mum. b Immunofluorescence projections of MII human oocytes stained for chromosomes (Hoechst) and filamentous actin visualized with fluorescent phalloidin, SiR-Actin, and anti-beta-actin antibody; z = 6 sections. Representative of n = 14, 3, and 4 oocytes. Scale bars, 10 mum. c Close-up view of actin (phalloidin) and gamma-tubulin distributions at narrow and broad spindle poles of metaphase II oocytes; z = 6 and 8 sections. Representative of n = 12 oocytes. Scale bars, 5 mum
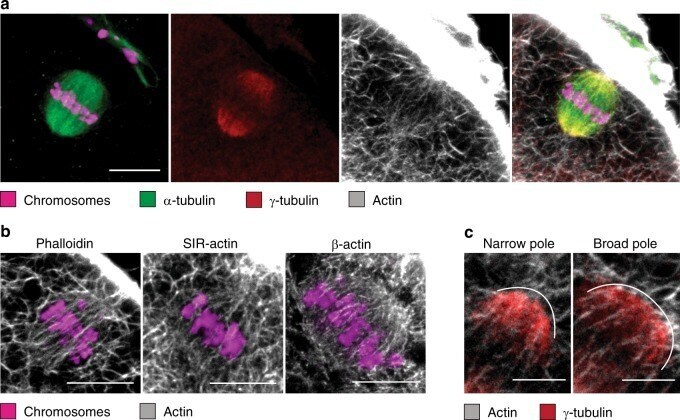
- Submitted by
- Invitrogen Antibodies (provider)
- Main image
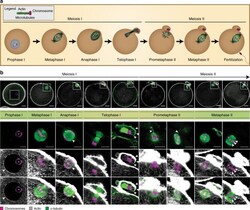
- Experimental details
- Fig. 2 Actin and microtubule dynamics are tightly coupled during oocyte meiosis. a Schematic illustration of the characteristic stages of oocyte meiosis showing chromosome, microtubule, and actin organization at the spindle. b Confocal z -projections of oocytes fixed at different meiotic stages and stained for chromatin (Hoechst), actin (phalloidin), and microtubules (alpha-tubulin). z = number of projected sections; Images are representative of n = number of oocytes per stage. Prophase I: arrowhead points at the membrane of the germinal vesicle and asterisk marks chromatin clustering around the nucleolus; z = 3 sections, n = 10 oocytes. Metaphase I: z = 3 sections, n = 9 oocytes. Anaphase I: arrowhead highlights the spindle midzone, asterisk marks a lagging chromosome; z = 11 sections, n = 1 oocyte. Telophase I: arrowheads highlight regions of chromatin anchorage; z = 3 and 6 sections, n = 6 oocytes. Prometaphase II: arrowheads mark microtubules projecting towards the polar body; z = 8 and 11 sections, n = 7 oocytes. Metaphase II: arrowheads highlight actin fibers overlapping with microtubules; z = 6 and 8 sections, n = 15 oocytes. Scale bars are 20 mum (overview) and 10 um (inset)
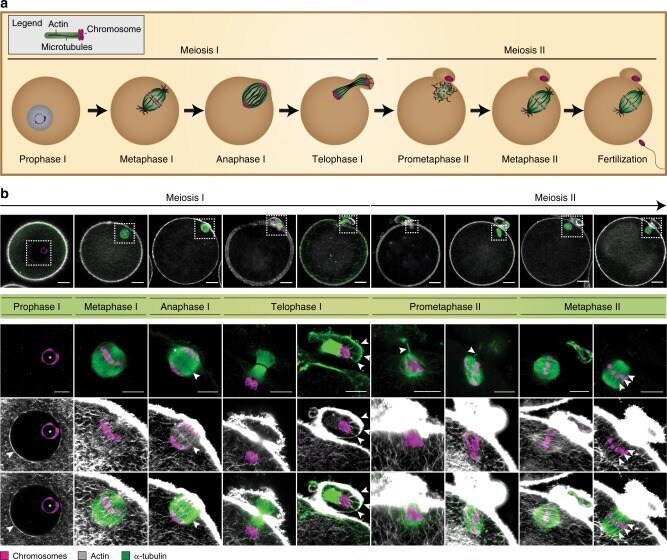
- Submitted by
- Invitrogen Antibodies (provider)
- Main image
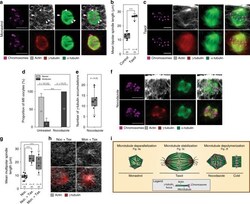
- Experimental details
- Fig. 3 Disruption of microtubules promotes multipolar spindle formation and causes spindle actin reorganization. a Representative z -projections of monastrol-treated MII oocytes showing actin (phalloidin) and microtubules (alpha-tubulin) as indicated by arrowheads (upper panel); gamma-tubulin and microtubule colocalization (lower panel); z = 3 sections. Representative of n = 4 oocytes. b Mean length of bipolar spindles in untreated and taxol-treated MII oocytes. c Localization of chromosomes (Hoechst), actin (phalloidin), alpha-tubulin (upper panel), and gamma-tubulin (lower panel) in taxol-treated MII oocytes; z = 27 sections. Representative of n = 6 oocytes. d Frequency of bipolar and multipolar spindles in untreated and nocodazole-treated MII oocytes. e Number of distinct gamma-tubulin accumulations in nocodazole-treated MII oocytes. f Immunofluorescence images showing chromosomes (Hoechst), actin (phalloidin), and microtubules (alpha-tubulin) at the multipolar spindles of oocytes treated with nocodazole (upper panel); gamma-tubulin at multipoles (lower panel); z = 10 sections. Representative of n = 5 (upper panel) and n = 4 (lower panel) oocytes. g Mean distance between spindle multipoles in oocytes treated with nocodazole alone and oocytes consecutively treated with nocodazole and taxol or monastrol and taxol. h Immunofluorescence images showing actin (phalloidin) and gamma-tubulin at the poles of multipolar spindles in MII oocytes consecutively treated with nocodazole a

- Submitted by
- Invitrogen Antibodies (provider)
- Main image

- Experimental details
- Figure 4 Regulation of Microtubule Organization by CLEC-2 via LL5beta (A) Representative western blots showing LL5beta expression in FRC cell lines. (B) Expression of LL5beta mRNA relative to control FRCs by qPCR. Error bars represent means and SDs of 2 biological replicates. (C) Immunofluorescence of FRC cell lines in vitro . Maximum z stack projections. Scale bars, 10 mum. (D) Quantification of LL5beta coverage in FRC cell lines as a percentage of the total perimeter. Each dot represents 1 cell. Error bars represent means and SDs. **** p < 0.00005, one-way ANOVA, Tukey's multiple comparisons test. (E) alpha-Tubulin intensity in the cortical area (10 mum from the edge) of FRC cell lines. Each dot represents 1 cell. Error bars represent means and SDs. **** p < 0.00005, one-way ANOVA, Tukey's multiple comparisons test. NS, not significant. (F) alpha-Tubulin intensity in the cortical area (10 mum from the edge) in LL5beta + and negative areas in control FRCs relative to the total area. Black dots represent cells and blue dots represent cell areas. Error bars represent means and SDs. * p < 0.05, one-way ANOVA, Tukey's multiple comparisons test. (G) Expression of LL5beta mRNA by qPCR in LL5beta siRNA transfected FRCs (n = 2). Error bars represent means and SDs. (H) alphaTubulin intensity in the cortical area (10 mum from the edge). Each dot represents 1 cell. Error bars represent means and SDs. ** p < 0.005, *** p < 0.0005, one-way ANOVA, Tukey's multiple comparisons test. (I) Re
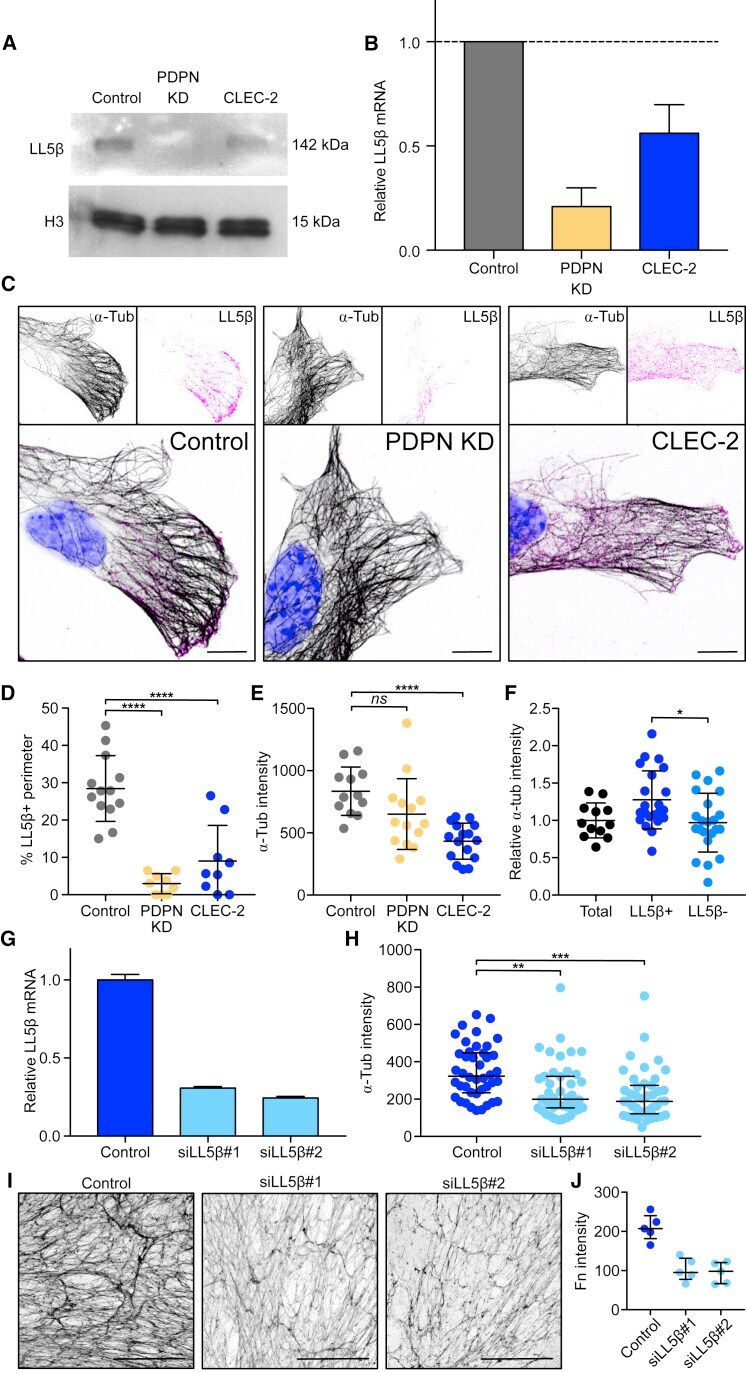
- Submitted by
- Invitrogen Antibodies (provider)
- Main image
- Experimental details
- Figure 5 Focal Adhesion, Microtubule Organization, and Contractility in FRCs (A and B) Representative immunofluorescence of FCR cell lines untreated and control FRCs treated with Y-27632 ROCK inhibitor. (A) Maximum z stack projections of representative images are shown. Scale bars, 5 mum. (B) Quantification of FA length from p-paxillin staining and LL5beta coverage as a percentage of the total perimeter. Dots represent FAs (top) or single cells (bottom) from 2 biological replicates. ** p < 0.005, **** p < 0.00005, one-way ANOVA, Tukey's multiple comparisons test. Error bars represent SDs. (C) Immunofluorescence of FRC/DC cocultures control or CD11c DeltaCLEC-2 BMDCs. Maximum z stack projections. Scale bars, 20 mum. (D) Quantification of FA length and alpha-tubulin intensity in the cortical area (10 mum from the edge). Dots represent FAs (top) or single cells (bottom) from 3 biological replicates. * p < 0.05, ** p < 0.005, **** p < 0.00005, one-way ANOVA, Tukey's multiple comparisons test. NS, not significant. Error bars represent SDs. (E) Representative immunofluorescence of cryosections of naive and inflamed LNs immunized with IFA/OVA. Maximum z stack projections. Scale bars, 20 mum. Asterisks and arrowheads indicate conduit-associated and conduit-independent surfaces, respectively, of FRCs. (F) Quantification of the indicated conduit components within the PDPN network. Each dot represents the median gray intensity of a different region of interest from 5 biological replicat