 Explore
 Validate
 Learn
Learn Western blot
 Flow cytometry
Antibody data
- Antibody Data
- Antigen structure
- References [0]
- Comments [0]
- Validations
- Western blot [2]
- Immunocytochemistry [3]
- Other assay [3]
Submit
Validation data
Reference
Comment
Report error
- Product number
- PA5-19489 - Provider product page

- Provider
- Invitrogen Antibodies
- Product name
- alpha Tubulin Polyclonal Antibody
- Antibody type
- Polyclonal
- Antigen
- Synthetic peptide
- Description
- PA5-19489 targets alpha Tubulin in immunofluorescence, immunohistochemistry (paraffin), and Western blot applications and shows reactivity with chicken, Indian muntjac, Chinese hamster, human, fruit fly, rat, African Green Monkey, and mouse samples. Perform heat mediated antigen retrieval via the pressure cooker method before beginning immunohistochemistry staining protocol. The PA5-19489 immunogen is synthetic peptide conjugated to KLH derived from within residues 400 to the C-terminus of Human alpha Tubulin. PA5-19489 detects alpha Tubulin which has a predicted molecular weight of approximately 50 kDa.
- Reactivity
- Human, Mouse, Rat
- Host
- Rabbit
- Isotype
- IgG
- Vial size
- 50 µg
- Concentration
- 0.9 mg/mL
- Storage
- -20°C or -80°C if preferred
No comments: Submit comment
Supportive validation
- Submitted by
- Invitrogen Antibodies (provider)
- Main image
- Experimental details
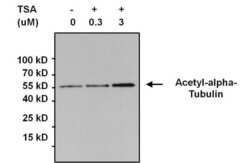
- Immunoprecipitation of acetylated alpha-Tubulin was performed using whole cell lysates from cells left untreated (DMSO only) or cells treated with 0.3uM or 3uM Trichostatin A (TSA) for 16 hours. Antigen-antibody complexes were formed by incubating 500 µg of lysate with 3 µg of an Acetyl Lysine monoclonal antibody (Product # MA1-2021) overnight on a rocking platform at 4°C. The immune complexes were captured on 50 µL Protein A/G Agarose (Product # 20421), washed extensively, and eluted with 5X Lane Marker Reducing Sample Buffer (Product # 39000). Samples were resolved on a 4-20% Tris-HCl polyacrylamide gel, transferred to a PVDF membrane, and blocked with 5% BSA/TBS-0.1%Tween for at least 1 hour. The membrane was probed with an alpha-Tubulin polyclonal antibody (Product # PA5-19489) at a dilution of 1:1000 overnight rotating at 4°C, washed in TBST, and probed with Clean-blot IP Detection Reagent (Product # 21230) at a dilution of 1:2000 for at least 1 hour. Chemiluminescent detection was performed using SuperSignal West Pico (Product # 34087).

- Submitted by
- Invitrogen Antibodies (provider)
- Main image

- Experimental details
- Western blot analysis was performed on whole cell extracts (30 µg lysate) of A-431 (Lane 1), COS-7 (Lane 2), MDCK (Lane 3), NIH/3T3 (Lane 4), HT-29 (Lane 5), Neuro-2a (Lane 6) and tissue extract of Rat Brain (Lane 7). The blot was probed with Rabbit Anti-alpha Tubulin Polyclonal Antibody (Product # PA5-19489, 0.5 µg/mL) and detected by chemiluminescence using Goat anti-Rabbit IgG (H+L) Superclonal™ Secondary Antibody, HRP conjugate (Product # A27036, 0.25 µg/mL, 1:4000 dilution). A 52 kDa band corresponding to alpha Tubulin was observed across the cell lines and tissue tested. Known quantity of protein samples were electrophoresed using Novex® NuPAGE® 4-12 % Bis-Tris gel (Product # NP0322BOX), XCell SureLock™ Electrophoresis System (Product # EI0002) and Novex® Sharp Pre-Stained Protein Standard (Product # LC5800). Resolved proteins were then transferred onto a nitrocellulose membrane with iBlot® 2 Dry Blotting System (Product # IB21001). The membrane was probed with the relevant primary and secondary Antibody following blocking with 5 % skimmed milk. Chemiluminescent detection was performed using Pierce™ ECL Western Blotting Substrate (Product # 32106).

Supportive validation
- Submitted by
- Invitrogen Antibodies (provider)
- Main image

- Experimental details
- Immunofluorescence analysis of alpha Tubulin was performed using 70% confluent log phase LNCaP cells. The cells were fixed with 4% paraformaldehyde for 10 minutes, permeabilized with 0.1% Triton™ X-100 for 10 minutes, and blocked with 1% BSA for 1 hour at room temperature. The cells were labeled with Alpha Tubulin Rabbit Polyclonal Antibody (Product # PA5-19489) at 2 µg/mL in 0.1% BSA and incubated for 3 hours at room temperature and then labeled with Goat anti-Rabbit IgG (H+L) Superclonal™ Secondary Antibody, Alexa Fluor® 488 conjugate (Product # A27034) at a dilution of 1:2000 for 45 minutes at room temperature (Panel a: green). Nuclei (Panel b: blue) were stained with SlowFade® Gold Antifade Mountant with DAPI (Product # S36938). F-actin (Panel c: red) was stained with Rhodamine Phalloidin (Product # R415, 1:300). Panel d represents the merged image showing cytoplasmic localization. Panel e shows the no primary antibody control. The images were captured at 60X magnification.

- Submitted by
- Invitrogen Antibodies (provider)
- Main image

- Experimental details
- Immunofluorescence analysis of alpha Tubulin was performed using 70% confluent log phase NIH/3T3 cells. The cells were fixed with 4% paraformaldehyde for 10 minutes, permeabilized with 0.1% Triton™ X-100 for 10 minutes, and blocked with 1% BSA for 1 hour at room temperature. The cells were labeled with Alpha Tubulin Rabbit Polyclonal Antibody (Product # PA5-19489) at 2 µg/mL in 0.1% BSA and incubated for 3 hours at room temperature and then labeled with Goat anti-Rabbit IgG (H+L) Superclonal™ Secondary Antibody, Alexa Fluor® 488 conjugate (Product # A27034) at a dilution of 1:2000 for 45 minutes at room temperature (Panel a: green). Nuclei (Panel b: blue) were stained with SlowFade® Gold Antifade Mountant with DAPI (Product # S36938). F-actin (Panel c: red) was stained with Rhodamine Phalloidin (Product # R415, 1:300). Panel d represents the merged image showing cytoplasmic localization. Panel e shows the no primary antibody control. The images were captured at 60X magnification.

- Submitted by
- Invitrogen Antibodies (provider)
- Main image

- Experimental details
- Immunofluorescent staining of HeLa cells using Product # PA5-19489, anti-Alpha Tubulin antibody. The cells were fixed with methanol (100%) for 5 minutes and exposed to the primary antibody at a concentration of 1 µg/mL for 1 hour at room temp. The secondary antibody was a 448 fluorescence conjugated Goat anti-rabbit IgG (green) at a dilution of 1:1000. A WGA- 594 fluorescent conjugated stain was used to label plasma membranes (red) and the nuclei stain was DAPI (blue).

Supportive validation
- Submitted by
- Invitrogen Antibodies (provider)
- Main image

- Experimental details
- NULL

- Submitted by
- Invitrogen Antibodies (provider)
- Main image
- Experimental details
- NULL

- Submitted by
- Invitrogen Antibodies (provider)
- Main image

- Experimental details
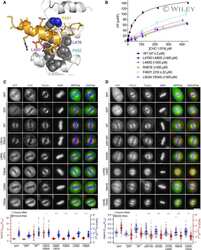
- Figure 3. Partial rescue of mitotic defects in RT112 cells upon mild overexpression of TACC3. ( a ) Western blot analysis of TACC3 expression level from different promoters (pCMV versus pTACC3 or pPGK promoter) using alpha-GFP or alpha-TACC3 antibodies. alpha-Tubulin was used as the loading control. pCMV, promoter of cytomegalovirus; pTACC3, promoter of TACC3; pPGK, promoter of phosphoglycerate kinase. ( b ) Representative micrographs of the amount of GFP-TACC3 overexpression under pCMV and pTACC3. Scale bar, 10 um. ( c , d ) RT112 cells co-expressing H2B-mCherry with GFP or GFP-TACC3 under pTACC3, synchronized by a double thymidine block. Movies were started 3 h post-release and imaged every 3 min for the next 12 h. Proportions of cells with various mitotic phenotypes are shown ( c ). Categories are as described for all other figures. Cumulative histograms of mitotic progression of all cells ( d ). Prometaphase-metaphase timing is shown for the conditions indicated. GFP: n = 3, 111 cells. GFP-TACC3: n = 3, 95 cells. The full mitotic progression dataset is shown in the electronic supplementary material, figure S1.
