 Explore
 Validate
 Learn
Learn Immunocytochemistry
Antibody data
- Antibody Data
- Antigen structure
- References [0]
- Comments [0]
- Validations
- Immunocytochemistry [3]
- Other assay [17]
Submit
Validation data
Reference
Comment
Report error
- Product number
- 322588 - Provider product page

- Provider
- Invitrogen Antibodies
- Product name
- alpha Tubulin Monoclonal Antibody (B-5-1-2), Alexa Fluor 488
- Antibody type
- Monoclonal
- Antigen
- Other
- Reactivity
- Human, Mouse, Rat
- Host
- Mouse
- Conjugate
- Green dye
- Isotype
- IgG
- Antibody clone number
- B-5-1-2
- Vial size
- 100 µg
- Concentration
- 0.5 mg/mL
- Storage
- Maintain refrigerated at 2-8°C for up to 1 month. For long term storage store at -20°C
No comments: Submit comment
Supportive validation
- Submitted by
- Invitrogen Antibodies (provider)
- Main image

- Experimental details
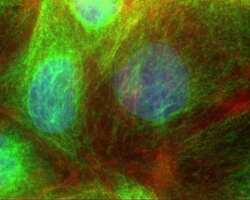
- Immunofluorescence analysis of Alpha tubulin was performed using 70% confluent log phase HeLa cells. The cells were fixed with 4% paraformaldehyde for 10 minutes, permeabilized with 0.1% Triton™ X-100 for 10 minutes, and blocked with 1% BSA for 1 hour at room temperature. The cells were labeled with alpha tubulin (B-5-1-2) Alexa Fluor 488 Mouse Monoclonal Antibody, (Product # 322588) at 2µg/mL in 0.1% BSA and incubated for 3 hours at room temperature (Panel a: green). Nuclei (Panel b: blue) were stained with SlowFade® Gold Antifade Mountant with DAPI (Product # S36938). F-actin (Panel c: red) was stained with Rhodamine Phalloidin (Product # R415, 1:300). Panel d represents the merged image showing cytoplasmic localization. Panel e shows the isotype control. The images were captured at 60X magnification.
- Conjugate
- Green dye

- Submitted by
- Invitrogen Antibodies (provider)
- Main image
- Experimental details
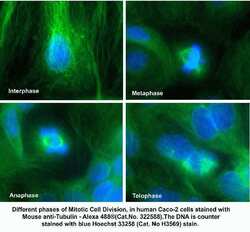
- Human Caco-2 cells stained with Mouse anti-a-Tubulin - Alexa Fluor® 488 (Product # 322588) showing cytoskeleton, and mitotic spindle. The DNA is counter stained with blue Hoechst 33258 (Product # H3569) stain, and actin is stained with Alexa Fluor® 568 Phalloidin (Product # A12380).
- Conjugate
- Green dye

- Submitted by
- Invitrogen Antibodies (provider)
- Main image
- Experimental details
- Immunofluorescent analysis of alpha Tubulin using a monoclonal antibody (Product # 322588).
- Conjugate
- Green dye

Supportive validation
- Submitted by
- Invitrogen Antibodies (provider)
- Main image
- Experimental details
- NULL
- Conjugate
- Green dye
- Submitted by
- Invitrogen Antibodies (provider)
- Main image
- Experimental details
- NULL
- Conjugate
- Green dye

- Submitted by
- Invitrogen Antibodies (provider)
- Main image
- Experimental details
- NULL
- Conjugate
- Green dye

- Submitted by
- Invitrogen Antibodies (provider)
- Main image

- Experimental details
- NULL
- Conjugate
- Green dye
- Submitted by
- Invitrogen Antibodies (provider)
- Main image

- Experimental details
- NULL
- Conjugate
- Green dye

- Submitted by
- Invitrogen Antibodies (provider)
- Main image

- Experimental details
- NULL
- Conjugate
- Green dye
- Submitted by
- Invitrogen Antibodies (provider)
- Main image
- Experimental details
- NULL
- Conjugate
- Green dye

- Submitted by
- Invitrogen Antibodies (provider)
- Main image

- Experimental details
- Fig. 6 Microtubule structure at the NMJ. To study microtubule architecture underlying the NMJ, intact myofibers from the flexor digitorum brevis muscle (FDB) of wild type (WT) and dystrophic ( mdx ) mice were isolated and plated. a The NMJ was identified with alpha-Bungarotoxin (BTX, red inset) and the associated microtubule structures (green) were examined by labeling of alpha-tubulin. Labeling shows disorganization of the normal microtubular latticed structure in the mdx myofiber, as described by others. Interestingly, the microtubule network density was also significantly decreased at the NMJ in mdx muscle. White inset panel shows binarization at the region of interest ( dotted box ). b Quantification was performed on binary images of alpha-tubulin immunohistochemistry ( n = 2 animals, 5 fibers per genotype; * p < 0.05). Scale bar equals 10 um
- Conjugate
- Green dye

- Submitted by
- Invitrogen Antibodies (provider)
- Main image

- Experimental details
- Figure 2 Cytoskeletal alterations account for the macrothrombocytopenia. ( a ) Confocal microscopy images of immunostained bone marrow sections. Scale bars, 50 mum (left panel. Scale bars, 15 mum (right panel). MKs, proplatelets and platelets are identified by GPIb staining (green). Endoglin staining (red) labels vessels; 4',6-diamidino-2-phenylindole (DAPI) stains nuclei (blue). ( b ) Quantification of bone marrow MKs per visual field (328 x 246 mum). Values are mean+-s.d. ( n =6; each 20 visual fields were analysed). ( c ) MK localization was quantified as their distance from bone marrow sinusoids. Values are mean+-s.d. ( n =6; 300 MKs). Wilcoxon-Mann-Whitney test; *** P
- Conjugate
- Green dye

- Submitted by
- Invitrogen Antibodies (provider)
- Main image

- Experimental details
- Figure 3 Altered localization and accelerated degradation of NMMIIA in MKs. ( a ) Confocal microscopy images of immunostained bone marrow sections. Scale bars, 10 mum. MKs, proplatelets and platelets are identified by GPIb staining (green). NMMIIA is highlighted in cyan. Endoglin staining (red) labels vessels; 4',6-diamidino-2-phenylindole (DAPI) stains nuclei (grey). ( b ) Quantification of NMMIIA distribution in primary bone marrow MKs in situ . Cytopl, homogeneous cytoplasmic distribution; cortex+cyotpl, homogeneous cytoplasmic distribution and some accumulation of NMMIIA at the cell cortex; cortex, accumulation of NMMIIA at the cell cortex; absent, no NMMIIA staining was detected. Values are mean+-s.d. ( n =5; 150 MKs). ( c - g ) Localization of NMMIIA (cyan) in proplatelet-forming foetal liver-derived MKs on day 4 of culture ( c ) and on collagen I (50 mug ml -1 ) spread (3 h) bone marrow-derived MKs ( d - g ). The MK cytoskeleton was stained for alpha-tubulin (green) and F-actin (red). DAPI, blue. ( e ) Quantification of the relative NMMIIA content on confocal microscopy images of spread MKs. Values are mean+-s.d. ( n =5; 50 MKs per condition). Pretreatment of bone marrow-derived MKs with 25 muM blebbistatin ( e , f ) or 2.5 mM MgCl 2 ( e , g ) prevented the degradation of NMMIIA ( b ) and restored its localization to podosomes. Scale bars, 10 mum ( a , b ). Scale bars, 25 mum ( c , d ). ( h ) Bone marrow-derived MKs of WT and Trpm7 fl/fl-Pf4Cre mice were cultured
- Conjugate
- Green dye

- Submitted by
- Invitrogen Antibodies (provider)
- Main image

- Experimental details
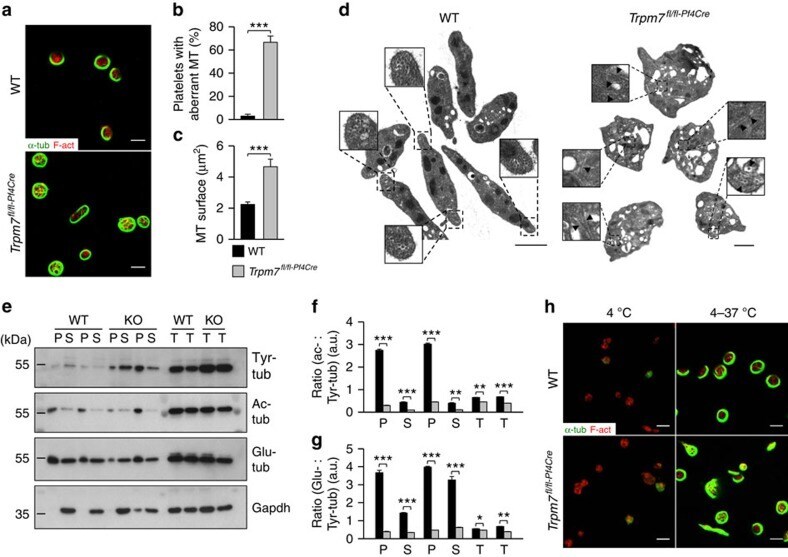
- Figure 5 Altered cytoskeletal organization in Trpm7 fl/fl-Pf4Cre platelets. ( a ) Confocal images of resting platelets. The platelet cytoskeleton was stained for alpha-tubulin (green) and F-actin (red). Scale bars, 3 mum. ( b , c ) Quantification of platelets with aberrant ( b ) microtubules (MT) and the MT surface per platelet ( c ). Values are mean+-s.d. ( n =5; 200 platelets). ( d ) Transmission electron microscopy (TEM) analysis of resting Trpm7 fl/fl-Pf4Cre platelets revealed an anarchic organization of microtubules (arrow heads in inlays). Scale bar, 1 mum. ( e ) Tubulin cytoskeleton of resting platelets was isolated by ultracentrifugation of Triton X-100 lysates and immunoblotted to detect dynamic Tyr-tubulin and post-translational modifications of the microtubules by the analysis of acetylated (ac)- or detyrosinated (Glu)-tubulin. Gapdh served as loading control. Insoluble fraction (pellet, P); soluble fraction (supernatant, S); total protein (T). ( f , g ) Densitometry revealed a markedly reduced ratio of stable acetylated ( f ) and detyrosinated ( g ) microtubules to highly dynamic Tyr microtubules in Trpm7 fl/fl-Pf4Cre platelets. Values are mean+-s.d. ( n =6) ( h ) Platelets were incubated for 3.5 h at 4 degC and if indicated rewarmed at 37 degC, fixed on PLL-coated slides and stained for F-actin (red) and alpha-tubulin (green). All images are representative of at least five animals. Unpaired Student's t -test; *** P
- Conjugate
- Green dye
- Submitted by
- Invitrogen Antibodies (provider)
- Main image

- Experimental details
- Figure 6 Deregulated [Mg 2+ ] i accounts for the altered cytoskeletal organization. ( a ) Resting control platelets were incubated for 3 h at 4 degC in Tyrode's-HEPES buffer supplemented with the indicated reagents. After rewarming to 37 degC platelets were fixed, allowed to adhere to PLL-coated coverslips and were stained for alpha-tubulin (green) and F-actin (red). ( b , c ) Quantification of microtubule (MT) morphology ( b ) and surface ( c ) revealed that decreasing [Mg 2+ ] i (EDTA) but not [Ca 2+ ] i (EGTA or BAPTA) in WT platelets reproduces the cytoskeletal alterations found in Trpm7 fl/fl-Pf4Cre platelets. Values are mean+-s.d. ( n =5; 200 platelets). ( d - f ) Rewarming of chilled and blebbistatin-pretreated (25 muM) Trpm7 fl/fl-Pf4Cre platelets restored cytoskeletal organization. Scale bars, 3 mum. Values are mean+-s.d. ( n =6; 200 platelets). ( g ) The ratio of polymerized actin in activated versus resting platelets was determined. Platelet stimulation was achieved using A+U, 10 muM ADP and 1 muM U46619; Thr, 0.01 U ml -1 thrombin; CRP, 1 mug ml -1 collagen-related peptide; Rhd, 0.1 mug ml -1 rhodocytin. Values are mean+-s.d. ( n =6). ( h ) The relative spread surface area of untreated or blebbistatin-treated (25 muM) platelets was determined using F-actin staining as a measure. Values are mean+-s.d. ( n =6; 200 platelets). All images are representative of at least five animals. Unpaired Student's t -test; *** ,### P
- Conjugate
- Green dye

- Submitted by
- Invitrogen Antibodies (provider)
- Main image

- Experimental details
- Figure 7 A human genetic variant in TRPM7 causes macrothrombocytopenia. ( a ) A heterozygous p.C721G variant of TRPM7 was identified by whole-exome sequencing in an index patient. Sanger sequencing confirmed that this variant (M) cosegregated with the macrothrombocytopenia (blue coloration) in the family pedigree. Open symbols indicate that no macrothrombocytopenia was observed. +/M indicates that the family member was a carrier of the TRPM7 variant. +/+ indicates that no variant was detected at that locus and no symbol that genotyping was not performed. ( b ) Total platelet cation content of healthy controls and patients 3, 5 and 6 was determined by inductively coupled mass spectrometry. Values are mean+-s.d. ( n =5 controls versus 3 patients). ( c ) Whole-cell patch clamp measurements on mock-transfected HEK293 ( n =8), and cells overexpressing WT TRPM7 ( n =13) or the p.C721G variant ( n =13) revealed impaired channel activity. Measurements were conducted in absence of extracellular Mg 2+ to enhance current sizes. Currents were elicited by a ramp protocol from -100 to +100 mV over 50 ms acquired at 0.5 Hz. Left panel: inward current amplitudes were extracted at -80 mV, outward currents at +80 mV and plotted versus time of the experiment. Values are normalized to cell size as pA pF -1 and represent mean+-s.e.m. The depletion of intracellular Mg 2+ leads to the development of characteristic TRPM7-like currents in WT TRPM7 overexpressing HEK293 cells, whereas TRPM7 currents w
- Conjugate
- Green dye

- Submitted by
- Invitrogen Antibodies (provider)
- Main image
- Experimental details
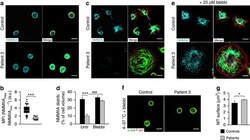
- Figure 8 Altered NMMIIA activity accounts for the aberrant cytoskeletal organization. ( a ) Poly- L -lysine-immobilised resting platelets were permeabilized and stained for F-actin (red) alpha-tubulin (green), NMMIIA (cyan) and analysed by confocal microscopy. ( b ) Image analysis revealed an altered distribution of NMMIIA in platelets from patients with variants in TRPM7 as compared with healthy controls. Box plots display first and third quartiles and whiskers mark minimum and maximum values unless exceeding 1.5 x interquartile range (IQR) of at least 70 platelets; symbols represent outliers and the horizontal line displays median ( n =3 controls versus patient 3). Wilcoxon-Mann-Whitney test; *** P
- Conjugate
- Green dye

- Submitted by
- Invitrogen Antibodies (provider)
- Main image

- Experimental details
- Fig. 1 The effect of ACV treatment on proliferation and morphometric features of MCF7 cells. a Relative cell number of MCF7 cells proliferation. Cells were counted at 0, 24, 48 and 72 h post treatment. b Caspase-3 activity (ng/10^6 cells) in MCF7 cells treated with ACV. c Annexin V staining of apoptotic MCF7 cells. Left panel is bright field images; right panel is Annexin V staining images. Green is cells stained with FITC Annexin V. Magnification 10X on Microscope Cell Observer SD Carl Zeiss with CMOS ORCA-Flash 4.0 V2. d Nuclei and cytoskeleton staining of MCF7 cells. Blue is nuclei stained by DAPI; green is cytoskeleton stained with anti- alpha tubulin antibody. Magnification 20X on Microscope Cell Observer SD Carl Zeiss with CMOS ORCA-Flash 4.0 V2. For better visualization color enhancement was applied using ZEN software (for current images only)
- Conjugate
- Green dye

- Submitted by
- Invitrogen Antibodies (provider)
- Main image

- Experimental details
- Figure 6 Detection of differentiated cells in NHBE pseudostratified epithelial layer generated from passage 1 cultures. Immunofluorescence for ( A ) Ciliated cells (alpha-tubulin, green), ( B ) goblet cells (MUC5B, green), ( C ) goblet cells (MUC5AC, red), ( D ) ZO-1 tight junctions (red), nuclear stain (DAPI - blue); and staining for ( E ) periodic acid-Schiff/alcian blue for mucus producing goblet cells.
- Conjugate
- Green dye

- Submitted by
- Invitrogen Antibodies (provider)
- Main image

- Experimental details
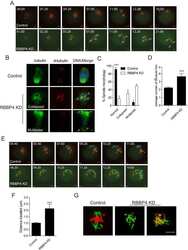
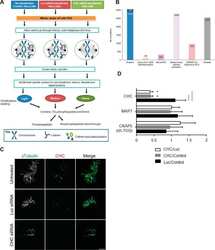
- Fig 2 Dynamic organization of LANA nuclear bodies through mitotic cell division. (A) Live cell imaging of RFP-LANA in iSLK cell line combined with Phase contrast during a 30 min interval through mitotic cell division. Scale bar = 10 mum. (B) Zoom and 3D reconstruction of confocal images of LANA bodies formed during live cell imaging in iSLK cells. Scale bar = 5 mum. (C) Confocal images of RFP-LANA from 3 orthogonal viewpoints at intervals across cell division. Relative time (min:sec) is indicated below each frame. Scale bar = 20 mum. (D) Confocal fixed images of mitotic RFP-LANA (red), alpha-tubulin (green) and Dapi (blue) in iSLK cells. Scale bar = 5 mum. (E) Deconvolved confocal images as shown in panel D with Dapi (i), alpha-tubulin (ii), RFP-LANA (iii), and merge (iv).
- Conjugate
- Green dye
