 Explore
 Validate
 Learn
LearnMA1-80017
antibody from Invitrogen Antibodies
Targeting: TUBA1C
bcm948, MGC10851, MGC14580, TUBA6
 Western blot
 ELISA Immunocytochemistry Immunoprecipitation Immunohistochemistry Radioimmunoassay Other assay
Antibody data
- Antibody Data
- Antigen structure
- References [0]
- Comments [0]
- Validations
- Western blot [2]
- Immunocytochemistry [1]
- Other assay [42]
Submit
Validation data
Reference
Comment
Report error
- Product number
- MA1-80017 - Provider product page

- Provider
- Invitrogen Antibodies
- Product name
- alpha Tubulin Monoclonal Antibody (YL1/2)
- Antibody type
- Monoclonal
- Antigen
- Other
- Description
- This clone recognizes the alpha subunit of tubulin, specifically binding tyrosylated Tubulin (Tyr-Tubulin). The epitope recognized by this antibody appears to be a linear sequence requiring an aromatic residue at the C terminus, with the two adjacent amino acids being negatively charged (represented by Glu-Glu-Tyr in Tyr-Tubulin). MA1-80017 is predicted to react with amphibia, birds, and echinoderm based on sequence homology. Does not react with nephrotoma suturalis. This antibody is suitable for use as a loading control.The antibody has been used in epitope tagging procedures to detect proteins tagged with a C-terminal Gly-Gly-Phe epitope. These sequence requirements have been reported to result in some cross-reactivity with other proteins in certain circumstances, including E. coli rec A and oxidized actin.
- Reactivity
- Human, Mouse, Rat, Canine, Drosophila, Porcine, Rabbit, Xenopus, Yeast
- Host
- Rat
- Isotype
- IgG
- Antibody clone number
- YL1/2
- Vial size
- 500 µg
- Concentration
- 1 mg/mL
- Storage
- Store at 4°C short term. For long term storage, store at -20°C, avoiding freeze/thaw cycles.
No comments: Submit comment
Supportive validation
- Submitted by
- Invitrogen Antibodies (provider)
- Main image
- Experimental details
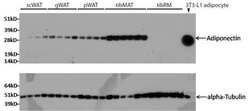
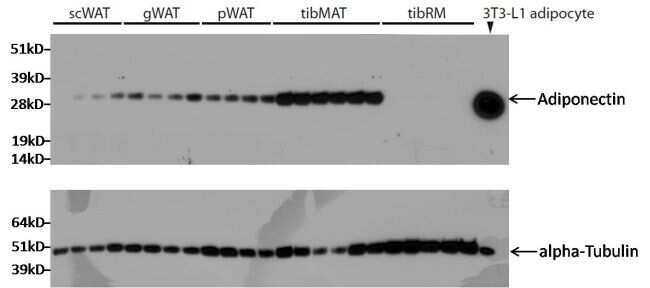
- Western blot analysis of adiponectin was performed by loading 8.4 µg of rabbit subcutaneous white adipose tissue (scWAT), gonadal white adipose tissue (gWAT), perirenal white adipose tissue (pWAT), tibia marrow adipose tissue (tibMAT), tibia red marrow (tibRM), and 3T3-L1 positive control adipocyte lysates per well onto an SDS-PAGE gel. Proteins were transferred to a PVDF membrane and blocked with 5% milk in TBST for 1 hour at room temperature. The membrane was probed with an adiponectin monoclonal antibody (Product # MA1-054) at a dilution of 1:1000 in 2.5% milk in TBST for 16 h at 4°C, washed in TBST, and probed with an HRP-conjugated mouse IgG secondary antibody at a dilution of 1:5000 for 1 hour at room temperature. As a loading control, lysates were probed with an alpha-Tubulin monoclonal antibody (Product # MA1-80017) at a dilution of 1:2000, followed by an HRP-conjugated rat IgG secondary antibody at a dilution of 1:5000 for 1 hour at room temperature. Detection was performed using a chemiluminescent substrate. Data courtesy of the Innovators Program.
- Submitted by
- Invitrogen Antibodies (provider)
- Main image

- Experimental details
- Western blot analysis was performed on whole cell extracts (30µg lysate) of A549 (Lane 1), COS-7 (Lane 2), MDCK (Lane 3), C2C12 (Lane 4), PC-3 (Lane 5), PC-12 (Lane 6), RSC96 (Lane 7), tissue extracts of Mouse Lung (Lane 8), Rat Stomach (Lane 9) and Mouse Prostate (Lane 10). The blot was probed with Anti-alpha Tubulin Mouse Monoclonal Antibody (Product # MA1-80017, 2µg/mL) and detected by chemiluminescence using Goat anti-Mouse IgG (H+L) Superclonal™ Secondary Antibody, HRP conjugate (Product # A28177, 0.25µg/mL, 1:4000 dilution). A 52 kDa band corresponding to alpha Tubulin was observed across the cell lines and tissues tested. Known quantity of protein samples were electrophoresed using Novex® NuPAGE® 4-12 % Bis-Tris gel (Product # NP0322BOX), XCell SureLock™ Electrophoresis System (Product # EI0002) and Novex® Sharp Pre-Stained Protein Standard (Product # LC5800). Resolved proteins were then transferred onto a nitrocellulose membrane with iBlot® 2 Dry Blotting System (Product # IB21001). The membrane was probed with the relevant primary and secondary Antibody following blocking with 5 % skimmed milk. Chemiluminescent detection was performed using Pierce™ ECL Western Blotting Substrate (Product # 32106).

Supportive validation
- Submitted by
- Invitrogen Antibodies (provider)
- Main image

- Experimental details
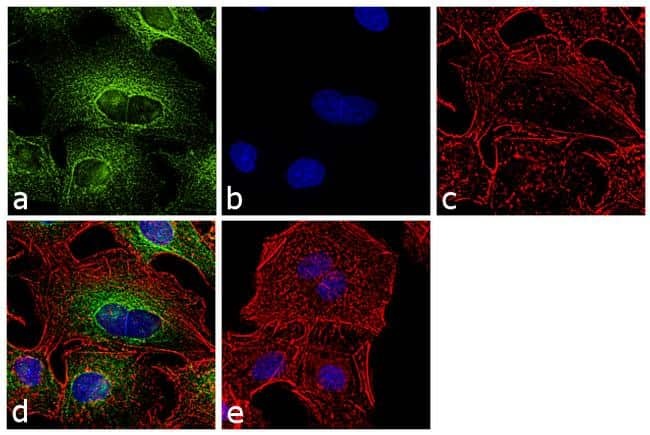
- Immunofluorescence analysis of alpha Tubulin was performed using 70% confluent log phase LNCaP cells. The cells were fixed with 4% paraformaldehyde for 10 minutes, permeabilized with 0.1% Triton™ X-100 for 10 minutes, and blocked with 1% BSA for 1 hour at room temperature. The cells were labeled with alpha Tubulin (YL1/2) Rat Monoclonal Antibody at 2µg/mL in 0.1% BSA and incubated for 3 hours at room temperature and then labeled with Goat anti-Rat IgG (H+L) Cross-Adsorbed Secondary Antibody, Alexa Fluor 488 (Product # A-11006) at a dilution of 1:2000 for 45 minutes at room temperature (Panel a: green). Nuclei (Panel b: blue) were stained with SlowFade® Gold Antifade Mountant with DAPI (Product # S36938). F-actin (Panel c: red) was stained with Rhodamine Phalloidin (Product # R415, 1:300). Panel d represents the merged image showing cytoplasmic localization. Panel e shows the no primary antibody control. The images were captured at 60X magnification.
Supportive validation
- Submitted by
- Invitrogen Antibodies (provider)
- Main image

- Experimental details
- NULL

- Submitted by
- Invitrogen Antibodies (provider)
- Main image

- Experimental details
- NULL

- Submitted by
- Invitrogen Antibodies (provider)
- Main image

- Experimental details
- NULL
- Submitted by
- Invitrogen Antibodies (provider)
- Main image

- Experimental details
- NULL

- Submitted by
- Invitrogen Antibodies (provider)
- Main image
- Experimental details
- NULL

- Submitted by
- Invitrogen Antibodies (provider)
- Main image

- Experimental details
- NULL
- Submitted by
- Invitrogen Antibodies (provider)
- Main image

- Experimental details
- NULL

- Submitted by
- Invitrogen Antibodies (provider)
- Main image

- Experimental details
- NULL

- Submitted by
- Invitrogen Antibodies (provider)
- Main image

- Experimental details
- NULL

- Submitted by
- Invitrogen Antibodies (provider)
- Main image

- Experimental details
- NULL

- Submitted by
- Invitrogen Antibodies (provider)
- Main image

- Experimental details
- NULL

- Submitted by
- Invitrogen Antibodies (provider)
- Main image

- Experimental details
- NULL

- Submitted by
- Invitrogen Antibodies (provider)
- Main image
- Experimental details
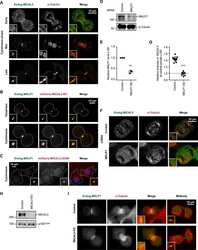
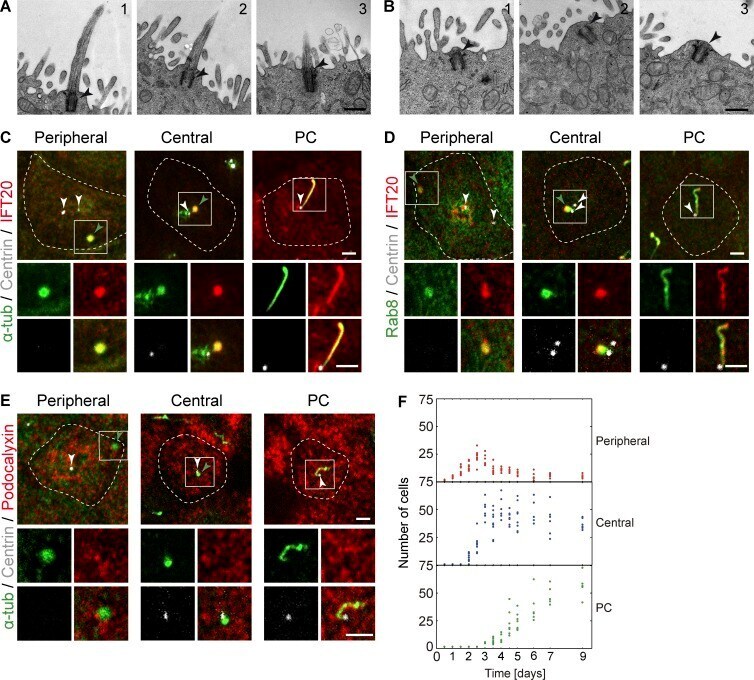
- Figure 1. IFT20 and Rab8 concentrate at peripheral and central structures in nonciliated MDCK cells. (A and B) EM micrographs showing three representative examples of PCs (A) and apical centrosomes (B). No ciliary pocket (A) or vesicles surrounding the centrosome (B) were observed in 14 cilia and 16 apical centrosomes examined, respectively. The arrowhead marks the centrosome. Bars, 500 nm. (C-E) Cells grown for 4 d were stained for IFT20 and alpha-tubulin (C), Rab8 and IFT20 (D), and podocalyxin and alpha-tubulin (alpha-tub; E). The position of the centrosome was monitored by expression of dsRed-centrin. The projection of one to three apical planes of one representative example of each of the distributions patterns is shown. The dashed line indicates the cell contour. The enlargement shows the fluorescent signal in the boxed region for the proteins analyzed. White arrowheads point to the centrosome or to each of the two centrioles if they are separated, and green arrowheads point to the peripheral and central structures. Bars, 2 um. (F) The number of cells with peripheral or central structures or a PC was measured at the indicated times after cell plating. Each dot represents the result from a microscope field. Three independent experiments were performed ( n = 207-847 cells per time point; two to five fields per time point and per experiment).
- Submitted by
- Invitrogen Antibodies (provider)
- Main image

- Experimental details
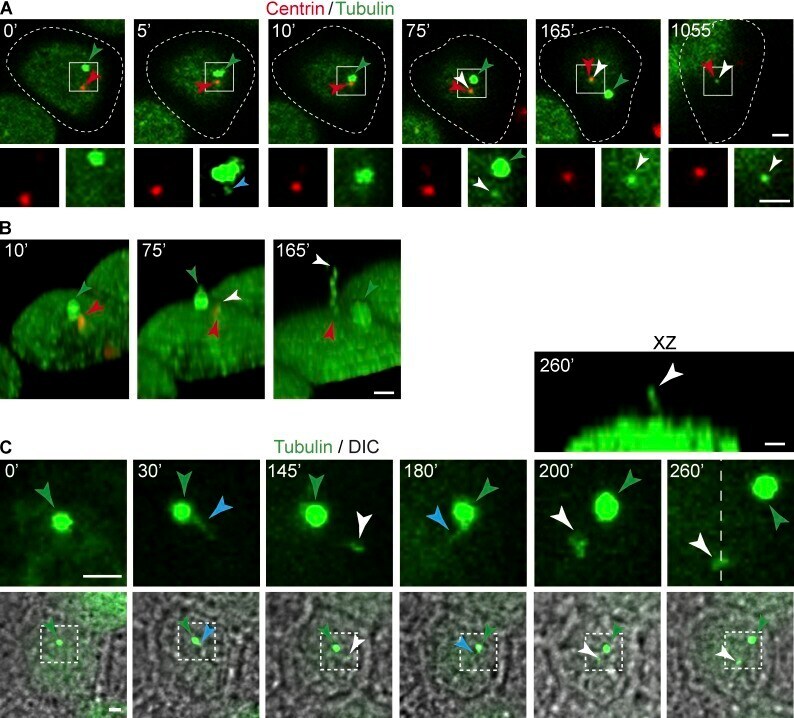
- Figure 5. A primary cilium forms once the midbody remnant becomes proximal to the centrosome. (A-C) Videomicroscopic analysis of PC formation. (A) XY projection of GFP-tubulin and dsRed-centrin during PC formation (top). The enlargements show the fluorescent signal in the boxed region for the proteins analyzed (bottom). The blue and white arrowheads indicate a microtubular connection between the midbody remnant and the centrosome and a nascent cilium, respectively. The green and red arrowheads point to the midbody remnant and the centrosome, respectively. The dashed line indicates the cell contour. (B) 3D reconstruction of some of the images shown in A. (C) XY projection of GFP-tubulin and their corresponding differential interference contrast (DIC) images during PC formation (bottom). The enlargement of the boxed region shows the distribution of tubulin at apical planes (middle). Nascent cilia are visualized in the XY projections as dots because they are perpendicular to the substrate. Green arrowheads point to the midbody remnant. The blue and white arrowheads indicate a microtubular extension similar to that observed in A and a nascent cilium, respectively. An XZ image of the cells after 260 min is included to show that the new profile that appears close to the midbody remnant (white arrowhead) is a nascent cilium (top). The dotted line indicates the plane used for the confocal XZ image. Bars, 2 um.
- Submitted by
- Invitrogen Antibodies (provider)
- Main image
- Experimental details
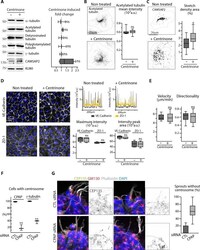
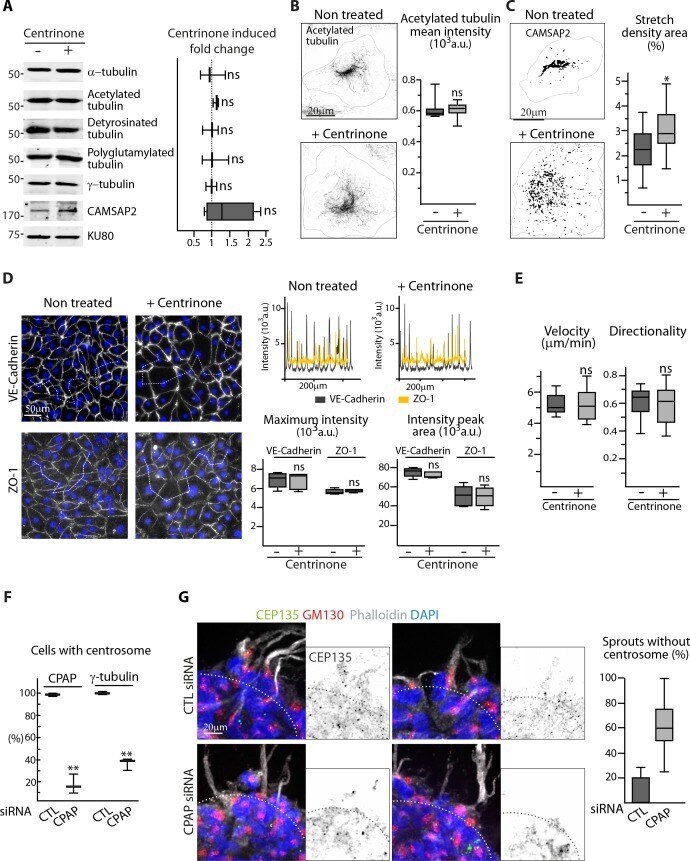
- Figure 1--figure supplement 2. The centrosome is not essential for angiogenic migration and sprouting. ( A ) Western blots of total extract from HUVECs treated or not treated with centrinone were used to quantify the levels of alpha-tubulin and CAMSAP2 protein expression as well as of tubulin post-translational modifications (acetylated, detyrosinated and polyglutamylated tubulin); Ku80 antibody was used as loading control, n = 3 independent experiments and n = 4 for CAMSAP2. ( B,C ) Staining of control or centrinone-treated HUVECs for acetylated MT ( B ) or CAMSAP2 ( C ). Z-maximum projections of STED ( B ) or thresholded ( C ) confocal images and quantification of the average fluorescence intensity of acetylated tubulin ( B ), n = 25 cells for each condition, and of the proportion of CAMSAP2-occupied cell area ( C ), n = 20 cells for each condition, are shown. ( D ) VE-Cadherin and ZO-1 stainings were used for analyzing cell-cell junctions in control or centrinone-treated HUVECs. Fluorescence intensity profiles across cell-cell junctions (dashed line) were plotted (one example is shown in the top right for VE-Cadherin in grey and ZO-1 in yellow) and used to quantify the average maximum signal intensity and peak area, n = 307 and 326 junctions (VE-Cadherin) and 222 and 159 junctions (ZO-1) in five different fields. ( E ) Cell tracking analysis was performed on phase-contrast live images to quantify the velocity and the directionality of cell movement during wound healing ass
- Submitted by
- Invitrogen Antibodies (provider)
- Main image
- Experimental details
- Figure 2--figure supplement 1. CAMSAP2 is required for maintaining non-centrosomal MTs and cell migration in ECs. ( A ) Plots showing the number per cell and length of CAMSAP2 stretches in HUVECs treated and stained as in Figure 2A , n = 30 cells per condition. ( B ) Western blots of total extracts of HUVECs 48 hr after transfection with control or two independent siRNAs against CAMSAP2 using antibodies against CAMSAP2 and Ku80 as loading control. ( C ) Quantification of the average fluorescence intensity of alpha-tubulin, n = 25 cells per condition, and of the density of EB3 comets, n = 19 and 21 cells, based on staining in control and CAMSAP2-silenced HUVECs. Data for control condition are the same as in Figure 1A and C . ( D ) Staining for alpha-tubulin (white/red) and centrosome (gamma-tubulin, green) in HUVECs after transfection with control or CAMSAP2 siRNAs. Overlays for the boxed regions are shown. Heat maps corresponding to the radial and non-radial MT network were built as described in the Methods based on the orientation of the MTs in relation to the centrosome. ( E ) Western blots of extracts of HUVECs treated as in ( D ) were used to quantify the levels of alpha-tubulin and CAMSAP2 expression and the levels of tubulin post-translational modifications (acetylated, detyrosinated and polyglutamylated tubulin); Ku80 antibody was used as loading control, n = 3 independent experiments. ( F ) Staining of HUVECs treated as in ( D ) for EB1 or EB3 (green), centrosome or G

- Submitted by
- Invitrogen Antibodies (provider)
- Main image
- Experimental details
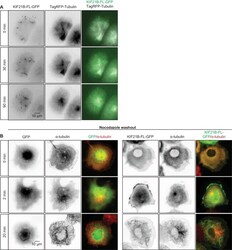
- Figure 1--figure supplement 1. Effects of KIF21B expression on MT organization and regrowth in cells ( A ) Time-lapse imaging of transiently transfected COS-7 cells expressing KIF21B-FL-GFP and TagRFP-tubulin. Yellow dashed lines in the overlay indicate the cell edge. ( B ) Nocodazole washout experiments of COS-7 cells expressing GFP or KIF21B-FL-GFP. Cells were transiently transfected with the indicated proteins and treated with 5 muM nocodazole for 2 hr. Subsequently, nocodazole was washed out and cells were fixed at the indicated time points. Antibodies against alpha-tubulin were used for cell staining. Yellow dashed lines in the overlay indicate the cell edge. DOI: http://dx.doi.org/

- Submitted by
- Invitrogen Antibodies (provider)
- Main image
- Experimental details
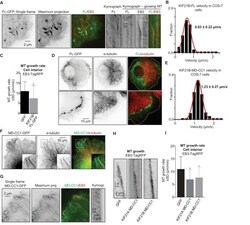
- Figure 1. KIF21B inhibits MT growth in cells. ( A ) COS-7 cells were transiently transfected with KIF21B-FL-GFP and EB3-TagRFP-T and imaged using TIRF microscopy. Represented are a single-frame, maximum intensity projection of 500 frames for the GFP channel and an overlay of a single GFP frame in green and TagRFP-T in red. Kymographs illustrate the motility of KIF21B along the MT and its significant accumulation at a stationary but not a growing MT plus end. ( B ) Histogram of KIF21B-FL-GFP kinesin velocities in COS-7 cells is shown with black bars. Red line shows fitting with a normal distribution. n = 378 in 10 cells in two independent experiments. ( C ) Quantification of MT growth rate, measured by tracking EB3 labeled comets in cell interior. Three to ten MTs per cell were analyzed; n = 183 in 21 cells for GFP control, n = 214 in 12 cells for KIF21B-FL-GFP expressing cells, two independent experiments, p

- Submitted by
- Invitrogen Antibodies (provider)
- Main image

- Experimental details
- Figure 6--figure supplement 2. ( A ) COS-7 cells transiently transfected with the indicated KIF21B-GFP deletion constructs and stained for alpha-tubulin. ( B ) MT pelleting assay of taxol-stabilized MTs incubated with KIF21B-FL-GFP. Coomassie-stained SDS-PAGE of supernatant and pellet fractions of MTs alone or MTs incubated with KIF21B-FL-GFP are shown. ( C ) Electron micrograph of a negatively stained taxol-stabilized MT control specimens. ( D ) Gallery of electron micrographs of negatively stained taxol-stabilized MT specimens obtained in the presence of KIF21B-FL-GFP. ( E ) High-magnification views of taxol-stabilized MT ends decorated with KIF21B-FL-GFP. ( F ) Gallery of electron micrographs of negatively stained GMPCPP-MT specimens obtained in the presence of KIF21B-FL-GFP. DOI: http://dx.doi.org/

- Submitted by
- Invitrogen Antibodies (provider)
- Main image

- Experimental details
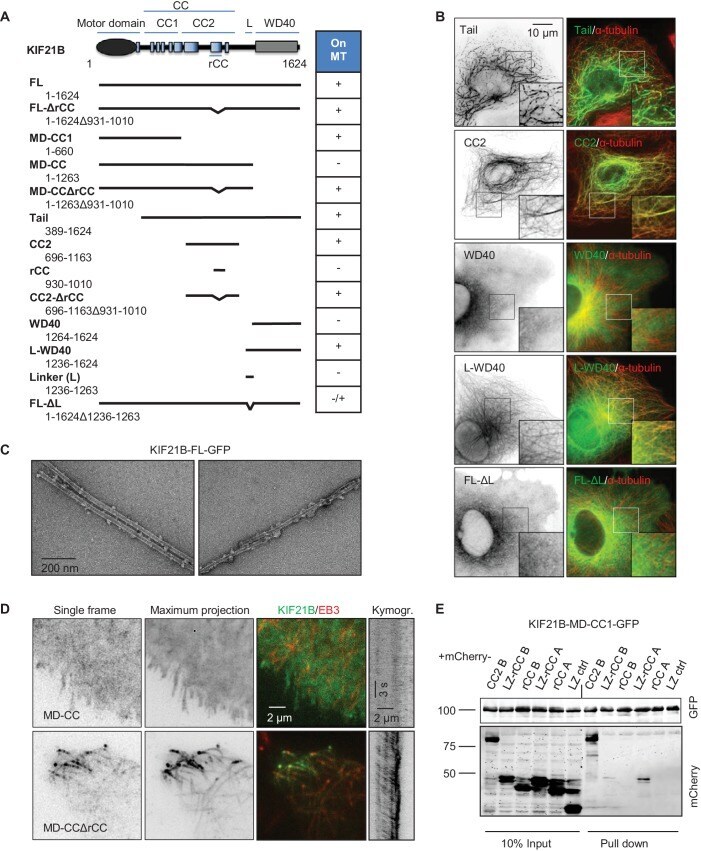
- Figure 6. Mapping of the MT-binding domains in the tail of KIF21B. ( A ) Overview of deletion mutants used in this study. Colocalization of the GFP-tagged KIF21B deletion mutants with MTs in transiently transfected COS-7 cells is indicated. +, localization to MTs, -, diffuse distribution, -/+, diffuse in most cells, with occasional MT localization observed in some cells. ( B ) COS-7 cells were fixed one day after transient transfection with the indicated constructs and stained for alpha-tubulin. ( C ) Electron micrographs of negatively stained taxol-stabilized MTs in complex with KIF21B-FL-GFP. ( D ) Live imaging of COS-7 cells transiently transfected with KIF21B-MD-CC-GFP or MD-CCDeltarCC-GFP and EB3-TagRFP-T. Represented are a single-frame, maximum intensity projection of 500 frames for the GFP channel, an overlay of single GFP frame in green and TagRFP-T in red and a kymograph along one of the EB3-labeled MTs showing kinesin motility. ( E ) Streptavidin pull down assay with the extracts of HEK293T cell expressing BirA, KIF21B-MD-CC1-GFP-TEV-Bio and the indicated mCherry-labeled proteins. A and B stand for KIF21A and KIF21B; LZ, leucine zipper from GCN4 used for dimerization. The other abbreviations are explained in panel A . The results were analyzed by Western blotting with the antibodies against the GFP- and mCherry. DOI: http://dx.doi.org/ Figure 6--figure supplement 4--source data 1. An excel sheet with numerical data on the quantification of far-UV CD spectra (inset)
- Submitted by
- Invitrogen Antibodies (provider)
- Main image

- Experimental details
- 1 Figure NPCs with centrosome defects delay in mitosis Representative whole mount images of WT and Cep63 T/T brains at P60. Scale bar = 0.2 cm. Telencephalon area of WT and Cep63 T/T brains. WT littermates N = 4, Cep63 T/T N = 7; two-tailed Mann-Whitney t -test. Representative whole mount images of WT and Sas4 cKO brains at P14. Scale bar = 0.2 cm. Telencephalon area of WT and Sas4 cKO brains. WT littermates N = 8, Sas4 cKO N = 7; two-tailed Mann-Whitney t -test. Black circles represent Nestin-Cre + animals. Representative images of E14.5 WT, Cep63 T/T , and Sas4 cKO cortices stained with antibodies against alpha-tubulin (green), gamma-tubulin (red), and DAPI (blue). Magenta arrows indicate dead cells; white and yellow arrows indicate cells with bipolar and monopolar spindles, respectively. Insets showing zoomed in view of DAPI and 2 representative cells. Dashed lines showing the orientation of the cleavage plane relative to the ventricular surface. Scale bar = 25 mum. Graph showing the percentage of bipolar, monopolar, and multipolar cells at the ventricular surface of E14.5 cortices. WT n = 201 cells, N = 3 embryos; Cep63 T/T n = 312 cells, N = 3 embryos; Sas4 cKO n = 296 cells, N = 3 embryos; #, chi-square test with *, post hoc analysis, comparisons are made to WT . E14.5 cortices stained with antibodies against Ki67 (red) and phosphorylated-Histone H3 (PH3, yellow). Insets showing zoomed in view of cells in the ventricular zone (VZ) and sub-ventricular zone (SVZ). Scale b

- Submitted by
- Invitrogen Antibodies (provider)
- Main image
- Experimental details
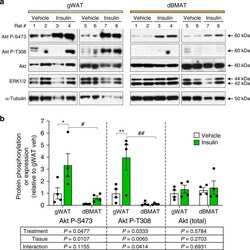
- Fig. 4 BMAT resists insulin-stimulated Akt T308 phosphorylation. Male Sprague-Dawley rats at 13- to 15-weeks of age were fasted overnight prior to intra-peritoneal injection of saline ( n = 4) or 0.75 U/kg insulin ( n = 4). Tissues were isolated 15 min post-injection and total protein isolated as described in the ""Methods"". a Expression of the indicated proteins was determined by immunoblotting, with ERK1/2 and alpha-Tubulin used as loading controls. b Quantification of protein expression from ( a ). Expression of Akt P-S473 and Akt P-T308 was normalised to total Akt. Expression of total Akt was normalised to the average of ERK1/2 and alpha-Tubulin. Data are presented relative to gWAT of vehicle-treated rats as mean +- SEM. For each protein readout the influence of treatment or tissue, and interactions between these, was determined by two-way ANOVA, with p values shown beneath the graph. Significant effects of treatment (within each tissue) or tissue (within each treatment) were further assessed by multiple comparisons and are indicated as follows: insulin vs vehicle, * P < 0.05), ** P < 0.01; gWAT vs. dBMAT, # P < 0.05) or ## P < 0.01. Source data and full scans of immunoblots are provided as a Source Data file.

- Submitted by
- Invitrogen Antibodies (provider)
- Main image

- Experimental details
- Figure 4 Naive ES Cells Remain Connected after Division (A) Representative confocal image of a naive ES cell colony stained for alpha-tubulin (black, inverted contrast). A maximum Z projection is shown. Scale bar: 10 mum. (B) Representative time-lapse of a fluorescence recovery after photobleaching (FRAP) experiment in ES cells expressing cytoplasmic GFP, the two cells at the top are sister cells. GFP intensity levels are displayed. Photobleaching is performed at 0 s in the sister cell on the right (red lightning bolt). GFP intensity is then monitored in the bleached cell (dark gray box), the sister cell (red box) and an unconnected neighbor (blue box). One Z plane is shown, time in seconds, scale bar: 10 mum. (C) Left panel: plot showing the mean GFP intensity over time (smoothed over a 4 point, ~4.5 s, window) in the boxes in the cells depicted in (B) Dotted lines highlight minimum fluorescence levels for the two unbleached cells. Right panel: transmitted light image and fluorescent Z projection (inverted contrast) of the 3 cells displayed in (B) and labeled with SIR-tubulin prior to the FRAP experiment, highlighting the tubulin bridge connecting the two cells at the top. (D) Dot plot showing the minimum GFP levels in the sister cell of the ES cell where GFP was bleached (red) and for an unconnected neighboring cell at a similar distance (blue). Mean and standard error of the mean are plotted. N = 3. (E) Dot plot showing the minimum GFP levels following photobleaching in on

- Submitted by
- Invitrogen Antibodies (provider)
- Main image

- Experimental details
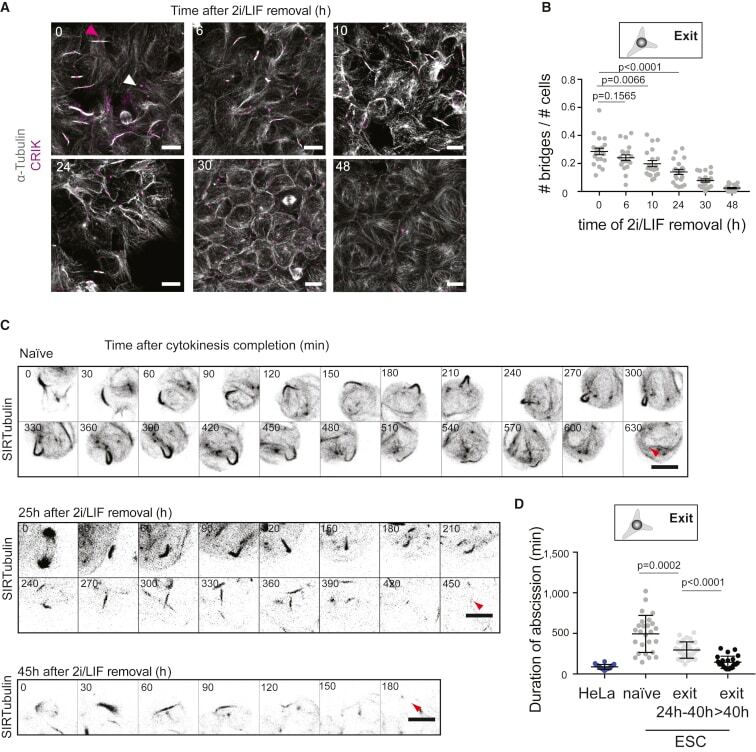
- Figure 5 Abscission Duration Decreases during Naive Pluripotency Exit (A) Representative confocal images of cells at different stages of naive pluripotency exit and stained for alpha-tubulin (white) and CRIK (magenta). Pink arrowhead, example of a bridge with a CRIK spot; white arrowhead, example an isolated CRIK spot, suggesting a midbody remnant. Cells are cultured on laminin to facilitate the visualization of the bridges. Scale bars: 10 mum. (B) Dot plot showing the fraction of cells with bridges (number of bridges divided by number of cells in a given analysis frame) in H2B-RFP ES cells and during naive pluripotency exit on laminin. Mean and standard error of the mean are shown. N = 2. (C) Representative time-lapses of a colony of ES cells expressing H2B-RFP and labeled with SIR-tubulin (black, inverted contrast, maximum Z projection across the colony is shown). Time in min. 0 min: end of cytokinesis. Top, naive cells; Middle and bottom, cells 25 and 45 h after induction of naive pluripotency exit, respectively. Red arrows: abscission. Scale bars: 10 mum. (D) Dot plot showing the duration of abscission for HeLa cells expressing tubulin-GFP dividing on elongated line micropatterns to standardize cell shape (blue) and for naive ES cells and cells exiting naive pluripotency labeled with SIR-tubulin (gray and black dots). Mean and standard error of the mean are shown. N = 3.
- Submitted by
- Invitrogen Antibodies (provider)
- Main image
- Experimental details
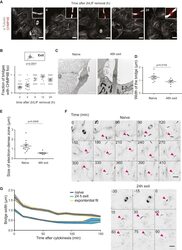
- Figure 6 Bridge Thinning and CHMP4B Recruitment Accompany Shortening of Abscission Duration during Naive Pluripotency Exit (A) Representative confocal images showing cells stained for alpha-tubulin (white) and CHMP4B (red) during naive pluripotency exit. Inset: zoom of representative bridges. Scale bars: 10 mum. (B) Dot plot showing the fraction of bridges displaying a CHMP4B spot near the bridge center in cell colonies during naive pluripotency exit on laminin. Mean and standard error of the mean are shown. N = 2. (C) Representative electron microscopy images of bridges connecting two naive cells (left) and two cells after 48 h in differentiation medium (right). Scale bars: 1 mum. (D) Dot plot showing bridge width measured from electron microscopy images of ES cells and cells exiting naive pluripotency. Mean and standard error of the mean are plotted. N = 2. (E) Dot plot showing the size of the electron dense midzone of the bridge, corresponding to the midbody, measured from electron microscopy images of ES cells and cells exiting naive pluripotency. Mean and standard error of the mean are plotted. N = 2. (F) Representative time-lapses of tubulin bridges in ES cells (top) or cells after 24 h in differentiation medium (bottom) labeled with SIR-tubulin (black, inverted contrast), Z projections are shown. Time in min. The pink arrowheads point to the bridges. Scale bars: 10 mum. (G) Time course of bridge width after cytokinesis for naive cells (black) and cells after 24 h in di

- Submitted by
- Invitrogen Antibodies (provider)
- Main image

- Experimental details
- Figure 7 Abscission Regulates Exit from Naive Pluripotency (A) Confocal images of H2B-RFP ES cells treated with scrambled siRNA (SCR, top) or siRNA against Alix (bottom) for 24 h in 2i/LIF, then plated on laminin in 2i/LIF or N2B27 (24 and 48 h exit), and stained for alpha-tubulin (white) and CRIK (magenta). A maximum Z projection over the volume of the colony is shown. Scale bars: 10 mum. (B) Dot plot showing the fraction of cells with bridges (number of bridges divided by number of cells in a given analysis frame) in ES colonies pre-treated with siRNA Scrambled ( SCR , gray) or Alix (orange) for 24 h in 2i/LIF, during naive pluripotency exit on laminin. Mean and standard error of the mean are shown. N = 2. (C) Dot plot representing the number of colonies surviving in a clonogenicity assay (see Figure 2 A) for ES cells treated with siRNA Scrambled ( SCR , gray) or Alix (orange) for 24 h in 2i/LIF, then placed in differentiation media for 24 h. The mean and standard deviation are shown. N = 6. (D) Schematic representation of the laser ablation experiment: 5 h after inducing naive pluripotency exit, a tubulin bridge connecting two cells is ablated using a pulsed laser (red thunderbolt), and REX1-GFP levels in the 2 cells (dark gray and yellow) are monitored. (E) Representative example of a bridge laser ablation experiment in cells labeled with SIR-tubulin (inverted contrast). Ablation is highlighted with a red thunderbolt and the location of the ablated bridge and destroyed mi

- Submitted by
- Invitrogen Antibodies (provider)
- Main image

- Experimental details
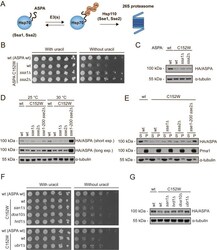
- Fig 2 The ASPA C152W variant is an unstable proteasome target which forms multiple aggregates. (A) Western blot of ASPA protein levels in wild-type yeast expressing the indicated ASPA variant and treated with the translation inhibitor cycloheximide (CHX) for 1 hour (1) or, as a control, with the solvent DMSO (0). Yeast cells were cultured with 0.1 mM CuSO 4 . Blotting for alpha-tubulin was included as a loading control. (B) Growth of wild-type yeast cells expressing the indicated ASPA construct on solid medium without uracil either in absence (no BZ) or in presence (with BZ) of the proteasome inhibitor bortezomib (BZ). (C) Western blot of ASPA protein levels in wild-type yeast expressing the indicated ASPA variant in presence of 0.1 mM CuSO 4 and treated with DMSO (-) or bortezomib (BZ, +) for three hours. Tubulin was included as a loading control. (D) Western blot of soluble (S) and insoluble (P) ASPA protein levels in wild-type yeast expressing the indicated construct in presence of 0.1 mM CuSO 4 . Pma1 and tubulin serve as loading controls for the insoluble and soluble fraction, respectively. (E) Representative fluorescence microscopy images of wild-type yeast cells expressing the indicated ASPA variant. Nuclei were stained with Hoechst. Scale bars are 4 mum. (F) Representative fluorescence microscopy images of wild-type yeast expressing GFP-ASPA C152W and Hsp104-mCherry. ASPA aggregates consistently co-localized with Hsp104, as would be expected for both the JUNQ and the

- Submitted by
- Invitrogen Antibodies (provider)
- Main image
- Experimental details
- Fig 4 Proteasomal degradation of ASPA C152W is mediated by Hsp70, Hsp110, and the E3 ubiquitin-protein ligase Ubr1. (A) Illustration of Hsp70-mediated ASPA degradation in budding yeast. Hsp70 recognizes unfolded and misfolded proteins and interacts with various E3 ubiquitin-protein ligases, potentially resulting in substrate ubiquitination. Subsequently, Hsp70 escorts the ubiquitinated protein to the proteasome where the nucleotide exchange factor (NEF) Hsp110 promotes substrate release, thereby resulting in proteasomal degradation of the substrate protein. (B) Growth of serial-diluted yeast cells of the indicated strains expressing either wild-type ASPA or the C152W variant on solid medium with or without uracil. (C) Western blot showing ASPA protein levels in the indicated strains expressing either wild-type ASPA or C152W in presence of 0.1 mM CuSO 4 . Blotting for alpha-tubulin was used as a loading control. (D) The indicated yeast strains expressing wild-type ASPA or the C152W variant were grown either at 25degC or 30degC prior to protein extraction and Western blotting to examine ASPA protein levels. Tubulin serves as a loading control. (E) The shown strains expressing either wild-type ASPA or the C152W variant were grown at 30degC. Soluble (S) and insoluble (P) protein fractions were separated by centrifugation prior to Western blotting. Pma1 and alpha-tubulin served as loading controls for the insoluble and soluble fractions, respectively. (F) The indicated yeast strai

- Submitted by
- Invitrogen Antibodies (provider)
- Main image

- Experimental details
- Fig 5 Hsp104 dissolves ASPA aggregates to promote protein folding and inclusion body formation. (A) Illustration showing potential outcomes of Hsp104-mediated disaggregation. Hsp104 dissolves protein aggregates, thereby promoting protein folding, sorting of aggregates into inclusion structures, and proteasomal degradation. In addition, the segregase Cdc48 facilitates proteasomal degradation of protein aggregates. (B) Growth of serial-diluted yeast cells of the indicated strains expressing either wild-type ASPA or the C152W variant on medium with or without uracil. (C) Western blot of ASPA protein levels in the indicated strains expressing either wild-type ASPA or C152W in presence of 0.1 mM CuSO 4 . Blotting for alpha-tubulin was used as a loading control. (D) The indicated ASPA constructs were expressed in wild-type or hsp104Delta yeast cells in presence of 0.1 mM CuSO 4 and soluble (S) and insoluble (P) protein was separated by centrifugation prior to Western blotting. Pma1 and alpha-tubulin serve as loading controls for the insoluble and soluble fractions, respectively. (E) Representative fluorescence microscopy images of the indicated strains expressing ASPA C152W. Hoechst dye was used to stain cell nuclei. Scale bars are 4 mum. (F) Cells expressing GFP and containing aggregates were quantified in wild-type (wt, C152W) and hsp104Delta yeast cells expressing the indicated ASPA construct using fluorescence microscopy. The frequencies of cells containing aggregates in separa

- Submitted by
- Invitrogen Antibodies (provider)
- Main image
- Experimental details
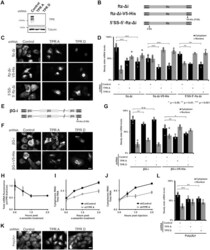
- Figure 1. TPR is required for the cytoplasmic accumulation of certain reporter mRNAs but not the nuclear retention of 5'SS motif containing mRNAs. ( A ) U2OS cells were treated with two different lentiviral delivered shRNAs against TPR ('TPR A' and 'TPR D') or scrambled control. Lysates were collected after 96 h, separated by SDS-PAGE and immunoprobed for TPR or tubulin. ( B ) Schematic of the intronless ftz reporter construct used in this study, with and without the V5-His element in the 3' UTR. The V5-His element contains the 5'SS motif which promotes nuclear retention. For 5 ' SS-5 ' -ftz-Deltai , the 5'SS motif was inserted into the 5' end of the ftz reporter. ( C, D ) Control- or TPR-depleted cells were transfected with the intronless ftz reporter plasmid (+- V5-His ). 18-24 h later the cells were fixed and the mRNA was visualized by FISH. TPR depletion caused nuclear accumulation of the ftz-Deltai mRNA, irrespective of the 5'SS motif. Representative images are shown in ( C ), scale bar = 10 mum, and quantification is shown in ( D ) with each bar representing the average and standard error of at least three independent experiments, each experiment consisting of at least 30 to 60 cells. Student t-test was performed for Figure 1D , G and L , * P < 0.05, ** P < 0.01, *** P < 0.001. ( E ) Schematic of the intron containing betaG-i reporter mRNA, with and without the V5-His element. ( F, G ) Similar to (C, D), except that betaG-i reporter plasmid was used. TPR depletion did n

- Submitted by
- Invitrogen Antibodies (provider)
- Main image

- Experimental details
- Fig. 2 a TGF-beta1 receptors TGFR1, -R2, and -R3 expression relative to RNA polymerase II (POL2RA) levels. Data given as median, boxes represent quartile ranges and whiskers minimum to maximum ranges (all N = 12 from three different donors). b - g TGF-beta1 receptors type 1 (TGFBR1) and type 2 (TGFBR2) localize on motile cilia whereas TGFR3 was not detected in immunocytochemical stainings. Z-stacks of confocal images (brackets in the schemes at the left hand side depict focus levels of Z-stacks) of primary cultivated human bronchial epithelial cells. Control cells remained untreated (CTRL) and TGF-beta1 cells were exposed for 10 days from cultivation day 18 to cultivation day 28 (TGF-beta1). RGB colour images represent merged grey scale images given with the small insets at the right. alpha-tubulin (TUBA, blue channel) were used as counterstaining for motile cilia, zonula occludens 1 (ZO-1, red channel) was used as counterstaining for tight junctions and TGFBR1, TGFBR2 and TGFR3 (green channel) gives localization of TGF-beta1 receptor isoforms. Scale bar 10 mum. Immunostaining of paraffin-embedded lung slices for e TGFBR1 and f TGFBR2. Ciliated cells (highlighted by arrows) are positive for both receptor isoforms. Non-ciliated cells (highlighted by triangles) showed almost no expression for either receptor isoform. Scale bars 30 mum

- Submitted by
- Invitrogen Antibodies (provider)
- Main image

- Experimental details
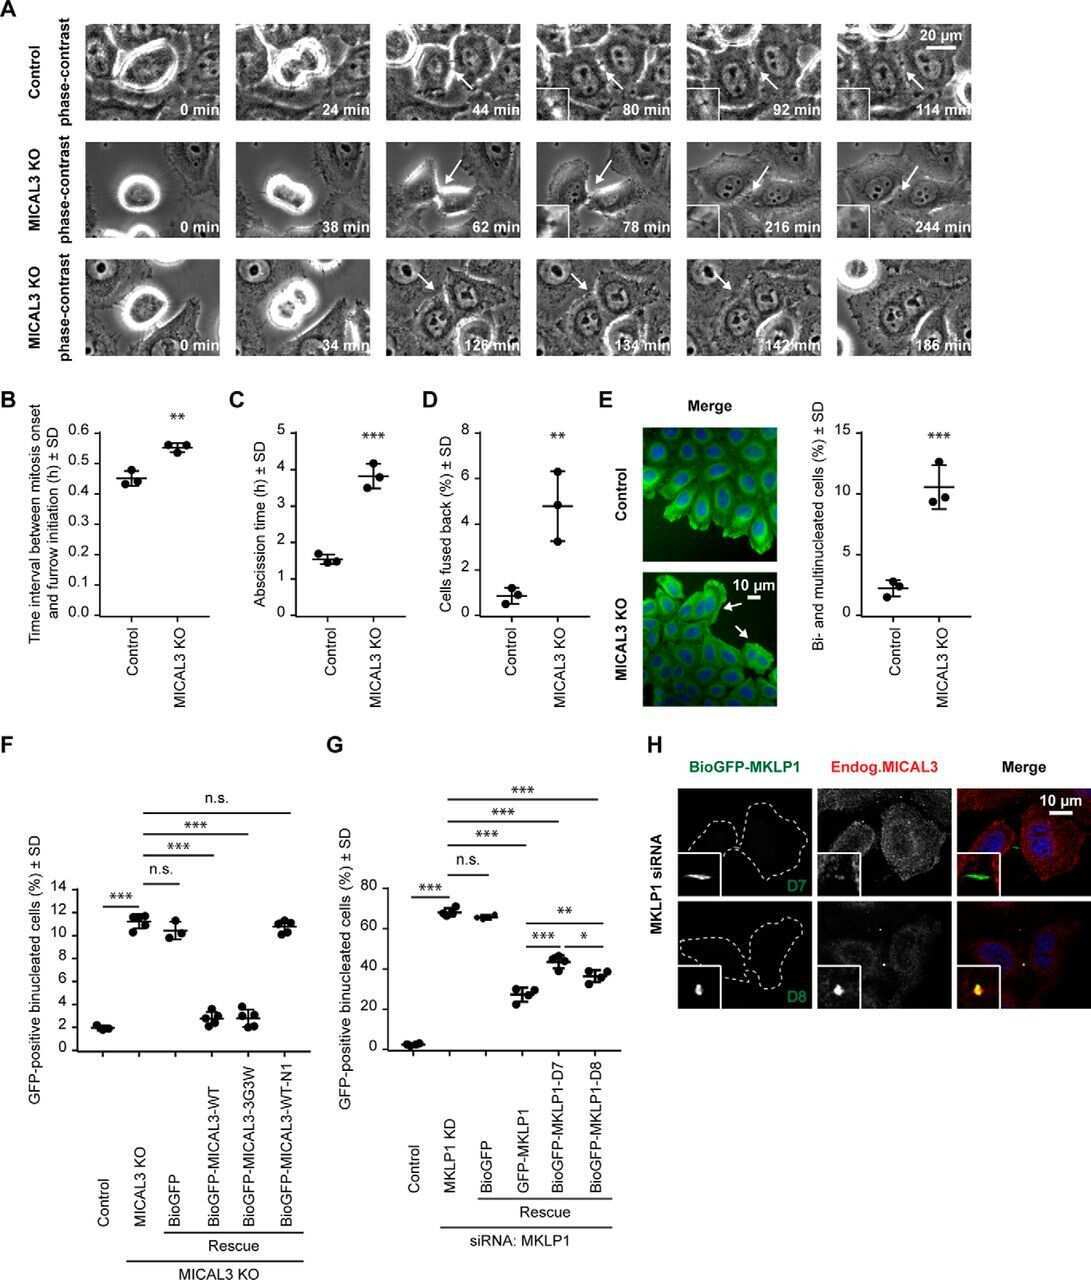
- Figure 5 Decreased midzone stability does not affect chromosome segregation velocity during anaphase (A and B) Immunofluorescent (A) and expansion microscopy (B) images of fixed control, PRC1-siRNA-depleted (only immunofluorescence) and KIF4A-siRNA-depleted 40-muM STLC-treated RPE-1 cells stained with AlexaFluor594 conjugated with alpha-tubulin antibody. Images in (A) and (B) are the maximum projections of color-coded z stacks as shown by the scheme in (B). Arrowheads point to the spindle midzone region. (C) STED images (single z plane) of anaphase spindles labeled with 100 nM SiR-tubulin in live non-induced CRISPR PRC1 KO and induced PRC1 KO RPE-1 cells. (D) Smoothed live-cell images (single z plane) of RPE-1 cells after midzone photoactivation of photoactivatable (PA)-GFP-alpha-tubulin (green) in the indicated conditions. 100-nM SiR-DNA (magenta) was used for chromosome staining. Time 0 represents the photoactivation onset. (E) Quantification of midzone stability, defined as the ratio of the integrated photoactivated signal in the boxed region (see schemes and boxes in D) at times 30 and 0 s, and chromosome segregation velocity measured in the same time period (see schemes), for the indicated treatments. Statistics: t test ( * p < 0.05; ** p < 0.01; *** p < 0.001; **** p < 0.0001). Numbers: 14, 7, 8, 9, 6, 5, 15, and 5 cells, from left to right. Three independent experiments for every condition except MKLP1 + MKLP2, MKLP1 + MKLP2 + EG5 inh. and KIF4+EG5 inh., which were don

- Submitted by
- Invitrogen Antibodies (provider)
- Main image

- Experimental details
- 10.1371/journal.ppat.1009588.g002 Fig 2 PAVE1 localizes to the subpellicular array microtubules of the cell posterior. (A) Ty1-PAVE1 cells were fixed in methanol and labeled with anti-Ty1 antibody and YL1/2, which recognizes tyrosinated tubulin. The empty arrowheads are denoting pools of tyrosinated alpha-tubulin at the basal body. Asterisks are marking kinetoplasts. (B) (Left) A subpellicular array sheet from WT 427 control cells immunogold-labeled with 10 nm beads using TAT1 antibody, which recognizes trypanosome alpha-tubulin. (Right) A subpellicular array sheet immunogold-labeled for Ty1-PAVE1 with 10 nm beads. Empty arrowhead is pointing to the ventral protrusion of a disrupted crosslink, and solid arrows are marking Ty1-PAVE1 beads on preserved inter-microtubule crosslinking fibrils. (C) Quantification of immunogold label distribution along individual microtubules in subpellicular sheets represented as a Superplot [], which shows each individual measurement in each biological replicate. The replicates are color-coded and the average is illustrated as large circles. TAT1 alpha-tubulin--Ty1-PAVE1 dorsal:dorsal and centroid:centroid distributions are not significantly different (P = 0.0542 and P = 0.0741, respectively). *P = 0.0146, **P = 0.0032. P-values are calculated from unpaired two-tailed Student's t- tests using the averages from N = 3 independent biological replicates. 3 subpellicular sheets in both TAT1 control and Ty1-PAVE1 conditions from N = 3 independent biolo

- Submitted by
- Invitrogen Antibodies (provider)
- Main image
- Experimental details
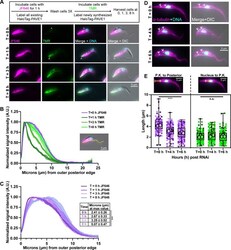
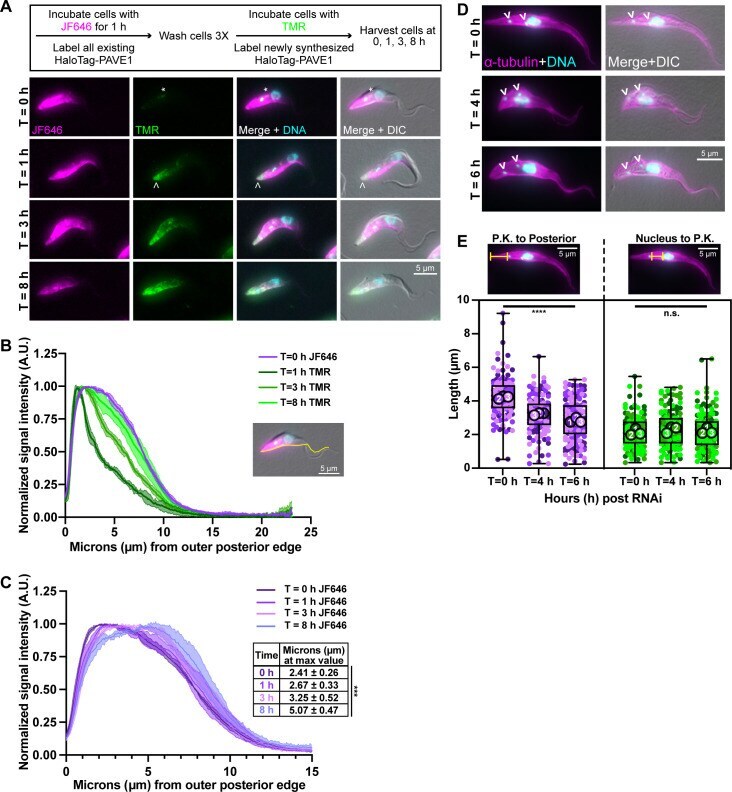
- 10.1371/journal.ppat.1009588.g003 Fig 3 PAVE1 is added to and stabilizes the microtubules at the extreme posterior end of the array. (A) HaloTag-PAVE1 cells were fixed in paraformaldehyde at T = 0 h, T = 1 h, T = 3 h, and T = 8 h after the addition of TMR-conjugated HaloTag ligand to cell culture in the capping assay. Asterisk represents background labeling of the endomembrane system. Empty arrowhead is pointing to the earliest addition of HaloTag-PAVE1, represented by TMR labeling, at the extreme cell posterior. (B) Fluorescence intensity quantification of HaloTag ligand labeling along the ventral edge of the cell body at T = 0 h, T = 1 h, T = 3 h, and T = 8 h after TMR substrate addition. Fluorescence intensity was normalized to 1 at each time point in order to illustrate the shape of the curve. 50 1N1K cells at each time point from N = 3 independent biological replicates were measured. (C) Fluorescence intensity quantification of JF646-HaloTag ligand labeling as in (B). Inset displays the distance in mum at which the maximum intensity of JF646 ligand was located. 50 1N1K cells at each time point from N = 3 independent biological replicates were measured. One-way ANOVA was calculated using the averages from N = 3 independent biological replicates. ***P
- Submitted by
- Invitrogen Antibodies (provider)
- Main image

- Experimental details
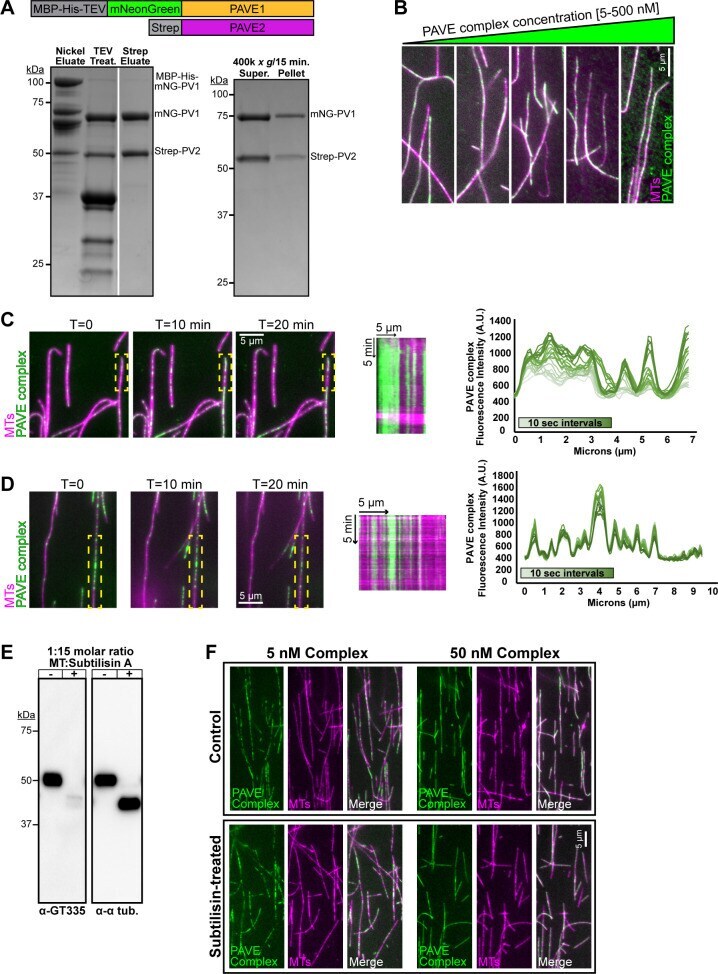
- 10.1371/journal.ppat.1009588.g006 Fig 6 PAVE1 and PAVE2 form a complex in vitro that binds the microtubule lattice. (A) (Left) Coomassie-stained SDS-PAGE gel demonstrating the co-purification of mNeonGreen-PAVE1 and Strep-PAVE2 from E . coli cells. E . coli cells co-expressing [MBP-oligoHis 10 -TEV]-mNeonGreen-PAVE1 and Strep-PAVE2 constructs were harvested, lysed, and the clarified supernatant was batch-bound with Ni-NTA resin. The eluate was treated with TEV protease and allowed to interact with Strep-Tactin XT resin. Proteins were eluted using 50 mM biotin. The Strep eluate lane contains 4 mug of protein. (Right) The PAVE complex was diluted into a low salt buffer containing 50 mM NaCl and ultracentrifuged. Equal fractions of both the supernatant and pellet were separated on an SDS-PAGE gel and stained with Coomassie blue. (B) 5, 50, 100, 200, and 500 nM clarified PAVE complex was incubated with Taxol-stabilized bovine microtubules labeled with the Cy5 fluor for 20 min RT. The PAVE complex-microtubule solution was settled onto a blocked flow cell and unbound protein was washed away. The flow cell was imaged using epifluorescence microscopy. (C) (Left) A PEGylated flow cell was blocked and Taxol-stabilized bovine Cy5-microtubules were allowed to attach to the flow cell surface. 5 nM clarified PAVE complex was added to the flow cell chamber and immediately imaged using TIRF microscopy. Images were taken every 10 sec for 20 min. (Middle) Kymograph of PAVE complex on the micro
- Submitted by
- Invitrogen Antibodies (provider)
- Main image

- Experimental details
- Figure 6 Decreased chromatin-bound RNAPII levels triggered by RBP3-TAP rescue mec1-S1991A defects on HU A Preparations of chromatin-bound proteins were prepared in triplicate and subjected to SDS-PAGE and immunoblotting with the indicated antibodies in a strain that either does or does not express the Rpb3-TAP protein from its endogenous locus (Table EV1 ). Quantification of chromatin-bound Rpb1-S2P and Rpb1-S5P is shown on the right. Mcm2 is used as a loading control. SEM is indicated ( n = 3 biological replicates). B G 1 synchronized cells were released into S phase with 0.2 M HU, and total protein extracts were collected at the indicated time points (in min); samples were subjected to SDS-PAGE followed by immunoblotting with antibodies against Rpb1-S2P, Rpb1-S5P, or tubulin. C Enrichment of the RNAPII subunit Rpb1 on chromatin in G 1 synchronized cells was assessed by ChIP-qPCR at indicated genes. Rpb1 ChIP signal from Rpb3-TAP expressing cells was normalized to the corresponding untagged strain. The dashed line indicates the amount of Rpb1 in the untagged strain. SEM ( n = 3 biological replicates) is indicated. FIG2 is a mating pheromone-induced gene used as a control to compare inducible gene and constitutively expressed genes ( PYK1 , YEF3 , PMA1 , PDC1, and snR13 ). D mRNA levels measured by RT-qPCR in G 1 synchronized cells in the indicated strains. Expression is normalized to either snR13 or FIG2 . Data are expressed as a ratio of Rpb3-TAP/WT in percentage. Individua

- Submitted by
- Invitrogen Antibodies (provider)
- Main image

- Experimental details
- Figure 5 Mec1-S1991 phosphorylation participates to RNAPII degradation on HU A-D Exponentially growing cells were treated with 0.2 M HU, and total protein extracts were collected at the indicated time points (in min), samples were subjected to SDS-PAGE followed by immunoblotting with Rpb1 and Tubulin antibodies. (B, D) Quantitation of total Rpb1 over time was done by normalizing Rpb1 levels to tubulin. The value at the starting point was set to 100% (black dashed line). SEM (at least n = 2 biological replicates) is indicated. E, F Drop assay on HU showing a 10-fold dilution series of cells from exponential SC cultures of the indicated strains that were spotted on SC +/- 200 mM HU. (F) Histogram presents quantification of two independent HU sensitivity assays with mean and individual data point values indicated for each yeast dilution. Source data are available online for this figure.

- Submitted by
- Invitrogen Antibodies (provider)
- Main image
- Experimental details
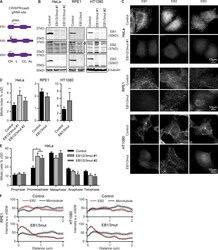
- Figure 1. Characterization of cell lines with disrupted EB-encoding genes. (A) Schemes of EB1, EB2, and EB3 proteins and the position of gRNA sequences. Arrow indicates the in-frame Met at the beginning of the EB2 CH domain. (B and C) Western blot analysis and immunostaining of control and the EB mutant cells with the indicated antibodies. (D and E) Quantification of the mitotic index and mitotic stages in the indicated cell lines. (D) n >= 3 and (E) n = 4 experiments, with 3,000 cells each. (F) Mean intensity of EB2 and alpha-tubulin staining starting from the MT tip (0); 26-28 MT ends analyzed per condition from 6-10 cells. *, P < 0.05; **, P < 0.01 (Mann-Whitney U test).

- Submitted by
- Invitrogen Antibodies (provider)
- Main image

- Experimental details
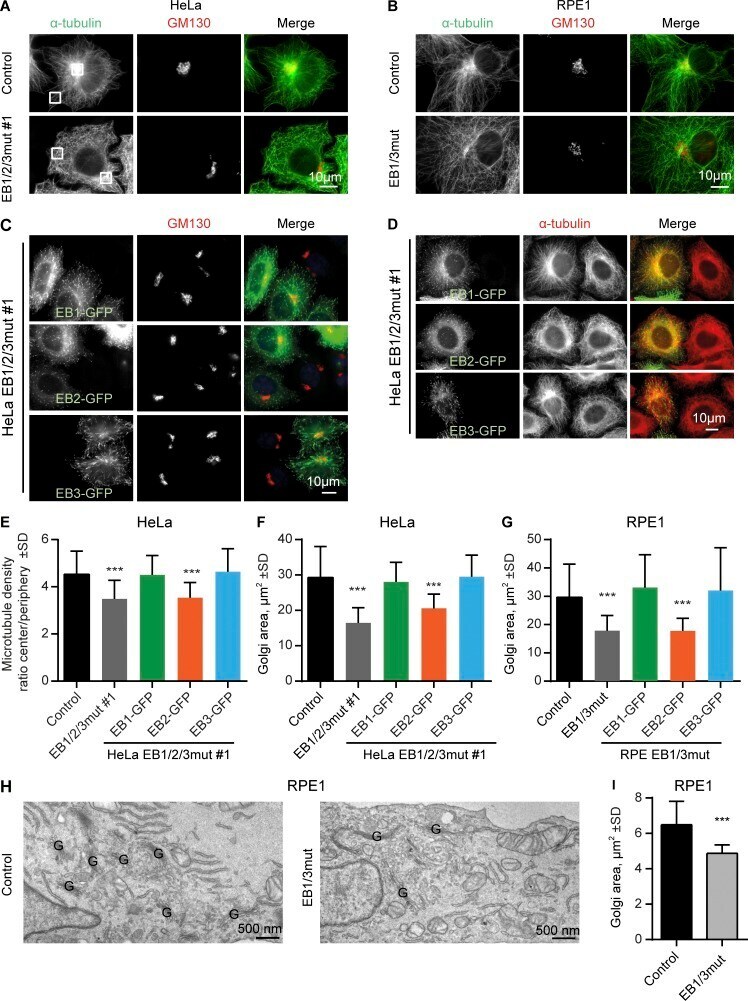
- Figure 4. Effect of EB disruption on MT and Golgi organization. (A-D) Immunostaining for alpha-tubulin and GM130 in the indicated cell lines; in C and D, cells were transfected with the indicated EB-GFP fusions. Boxes in A show examples of areas used for quantification in E. (E-G) Quantification of the ratio of MT intensity in the cell center and cell periphery (boxes in A; E) or the Golgi area in the indicated cell lines, transfected with the indicated constructs. n = 24-41 cells per condition (E), 31-66 cells (F), and 28-47 cells (G). (H and I) EM images of the Golgi area (Golgi stacks indicated with a G; H) and quantification of the total area occupied by in Golgi stacks (I). n = 3 experiments with 50 cells each. ***, P < 0.001 (Mann-Whitney U test).
- Submitted by
- Invitrogen Antibodies (provider)
- Main image

- Experimental details
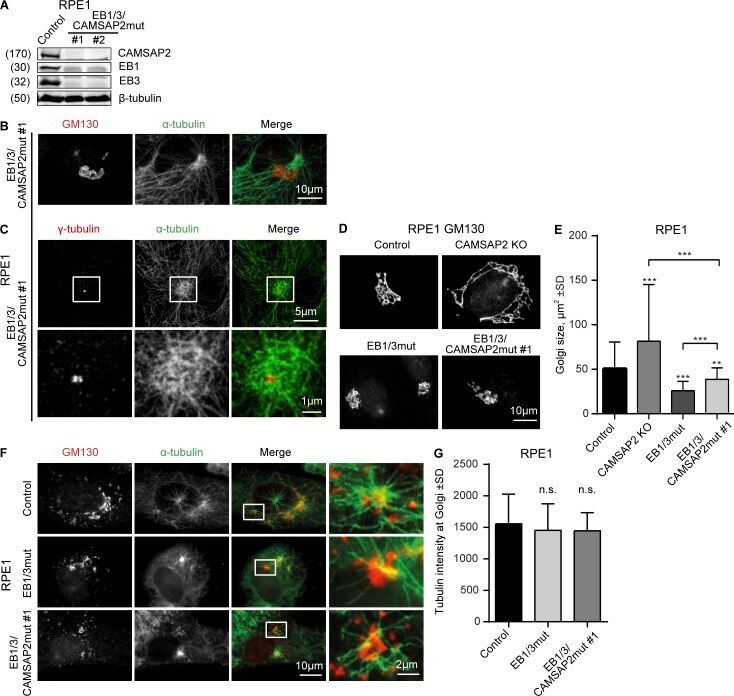
- Figure 7. Effect of EB1, EB3, and CAMSAP2 disruption on Golgi organization and MT nucleation from Golgi. (A) Western blots of the extracts of EB1/3/CAMSAP2mut RPE1 cells. (B and C) Immunostaining for alpha-tubulin and GM130 (B) or gamma-tubulin (C) in EB1/3/CAMSAP2mut RPE1 cells. In C, enlarged images of the boxed areas are shown below. (D and E) Immunostaining for GM130 and quantification of the Golgi area in the indicated cell lines. n = 50 cells per condition. (F) Immunostaining of GM130 and alpha-tubulin in the indicated cell lines after a 3-min recovery from nocodazole treatment. (G) Tubulin intensity in the vicinity of Golgi membranes in the indicated cell lines treated as in F. n = 30 cells per condition. n.s., no significant differences; **, P < 0.01; ***, P < 0.001 (Mann-Whitney U test).
- Submitted by
- Invitrogen Antibodies (provider)
- Main image
- Experimental details
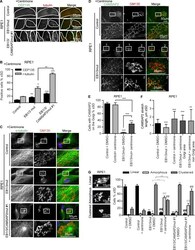
- Figure 8. Effect of EB1, EB3, and CAMSAP2 disruption on MT and Golgi organization after centriole depletion. (A and B) Immunostaining for CEP135 and gamma-tubulin (A) and percentage of gamma-tubulin- and CEP135-positive cells in the indicated cell lines after 11 d of treatment with 125 nM centrinone (B). n = 366-391 cells per condition. *, P < 0.05; **, P < 0.01; ***, P < 0.001 (Student's t test). (C and D) Immunostaining for alpha-tubulin (C) or CAMSAP2 (D) and GM130 in the indicated cell lines treated with centrinone. Enlarged portions of the boxed areas are shown at the bottom. (E and F) Percentage of cells with CAMSAP2 stretches at the Golgi (E) and quantification of the CAMSAP2 stretch length (F) for the indicated cell lines and treatments. n = 248-418 cells per condition in E and 199-260 CAMSAPP2 stretches in F. **, P < 0.01; ***, P < 0.001 (Mann-Whitney U test). (G) Quantification of Golgi morphology for the indicated PRE1 cell lines and treatments. Three types of Golgi organization are shown on the left. 335-642 control and 153-593 centrinone-treated cells were analyzed. Significant differences between values are indicated: *, control (DMSO) treatment; #, centrinone treatment. * or #, P < 0.05; ** or ##, P < 0.01 (Mann-Whitney U test).

- Submitted by
- Invitrogen Antibodies (provider)
- Main image
- Experimental details
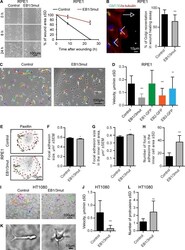
- Figure 9. Effects of EB1 and EB3 disruption on cell migration. (A) Phase-contrast images of monolayer wound-healing assays in control and EB1/3mut RPE1 cells at the indicated time points and percentage of wound area closure. n = 3 independent experiments. (B) Immunostaining for alpha-tubulin and GM130 in a wound healing assay and the quantification of the Golgi reorientation. n = 163 control and 152 EB1/3mut RPE1 cells. (C). Phase contrast images and tracks of control and EB1/3mut cells during 7-h migration in sparse culture (C). (D) Quantification of cell migration velocity in control and EB1/3mut RPE1 cells expressing the indicated constructs. n = 30-60 cells. (E-H) Immunostaining for paxillin in the indicated cell lines (E), quantification of FA size in the whole cell (F), and FA size (G) and number (H) in the inner cell area (with 5-um-broad cell rim excluded, red dotted lines in E). n = 44 control and 55 EB1/3mut RPE1 cells; per condition, 3,000 and 1,000 FAs were analyzed in the whole cell and the inner cell area, respectively. (I and J) Phase contrast images and tracks of control and EB1/3mut HT1080 cells in 3D matrix during 24-h migration (I) and quantification of their migration velocity (J). n = 24 control and 26 EB1/3mut HT1080 cells. (K and L) Morphology of control and EB1/3mut HT1080 cells in 3D matrix and the mean number of protrusions in these cells. n = 65 control and 63 EB1/3mut HT1080 cells. *, P < 0.05; **, P < 0.01; ***, P < 0.001 (Mann-Whitney U test).
