 Explore
 Validate
 Learn
Learn Immunocytochemistry
 Immunohistochemistry
Antibody data
- Antibody Data
- Antigen structure
- References [0]
- Comments [0]
- Validations
- Immunocytochemistry [1]
- Other assay [11]
Submit
Validation data
Reference
Comment
Report error
- Product number
- 42-4502-82 - Provider product page

- Provider
- Invitrogen Antibodies
- Product name
- alpha Tubulin Monoclonal Antibody (DM1A), eFluor™ 615, eBioscience™
- Antibody type
- Monoclonal
- Antigen
- Other
- Description
- Description: The monoclonal antibody DM1a recognizes the 50kDa cytoskeletal protein alpha tubulin in a variety of species (human, mouse, rat, monkey, dog, pig, bovine, goat, hamster, guinea pig, kangaroo, amphibians, sea urchin, yeast and tobacco plants). Tubulin, the major component of microtubules, is a dimeric protein consisting of an alpha and beta subunit. Tubulin is a GTP-binding protein that can be modified by phosphorylation and acetylation resulting in assembly (polymerization) or disassembly (depolymerization). The dynamic nature of microtubules is most evident in the mitotic apparatus. The DM1a antibody recognizes the C-terminal end of the alpha tubulin isoform (amino acids 426-430). Applications Reported: This DM1A antibody has been reported for use in immunohistochemical staining of frozen (IHC-F) and formalin-fixed paraffin embedded (FFPE, IHC-P) tissue sections as well as immunocytochemical staining. Applications Tested: This DM1A antibody has been tested by immunocytochemistry on fixed and permeabilized C6 cells at less than or equal to 1 µg/mL. It is recommended that this antibody be carefully titrated for optimal performance in the assay of interest. This product has not been validated for flow cytometric analysis. Filter Recommendation: When using this eFluor® 615 antibody conjugate, we recommend a filter that will capture the 615 emission wavelength (for example, Excitation 560/55, 585LP, Emission 645/75). A standard Alexa Fluor® 594 filter is acceptable. Excitation: 595 nm; Emission: 615 nm. Filtration: 0.2 µm post-manufacturing filtered.
- Reactivity
- Human, Mouse, Rat, Canine, Porcine
- Host
- Mouse
- Isotype
- IgG
- Antibody clone number
- DM1A
- Vial size
- 100 µg
- Concentration
- 0.2 mg/mL
- Storage
- 4° C, store in dark, DO NOT FREEZE!
No comments: Submit comment
Supportive validation
- Submitted by
- Invitrogen Antibodies (provider)
- Main image
- Experimental details
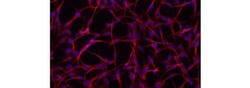
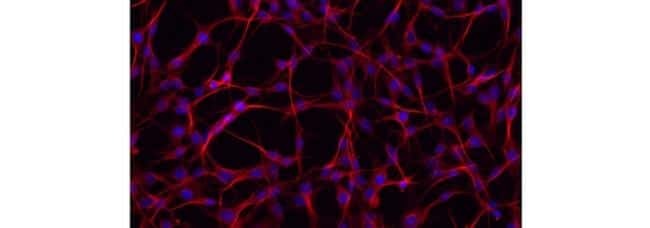
- Immunocytochemistry on fixed and permeabilized C6 cells using 1 µg/mL Anti-alpha Tubulin eFluor® 615. Nuclei are counterstained with DAPI.
Supportive validation
- Submitted by
- Invitrogen Antibodies (provider)
- Main image
- Experimental details
- NULL

- Submitted by
- Invitrogen Antibodies (provider)
- Main image

- Experimental details
- NULL

- Submitted by
- Invitrogen Antibodies (provider)
- Main image
- Experimental details
- NULL

- Submitted by
- Invitrogen Antibodies (provider)
- Main image

- Experimental details
- NULL

- Submitted by
- Invitrogen Antibodies (provider)
- Main image

- Experimental details
- NULL
- Submitted by
- Invitrogen Antibodies (provider)
- Main image

- Experimental details
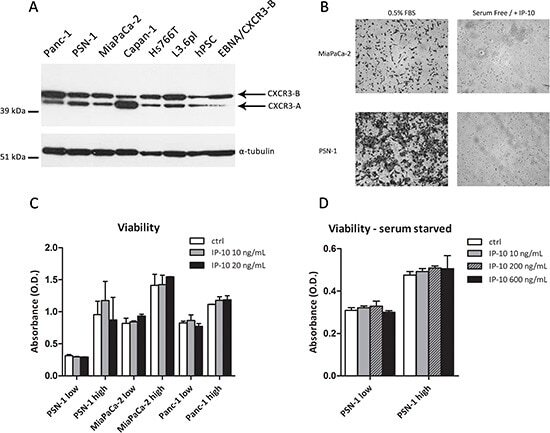
- Figure 3 Functional effects of IP-10 on PCCs (A) Expression of CXCR3 in PCCs, PSCs and HEK293-EBNA/CXCR3-B analyzed by Western Blot. alpha-tubulin was used as loading control. (B) Microphotographs of PCCs migrated through the Boyden chamber in response to 0.5% FBS or IP-10 (24 hr). (C-D) Viability of PCCs after IP-10 addition determined using the MTT assay. Low/high refers to cell seeding density. Data are representative of two/three independent experiments. Data in the histograms are presented as mean +- SD.
- Submitted by
- Invitrogen Antibodies (provider)
- Main image
- Experimental details
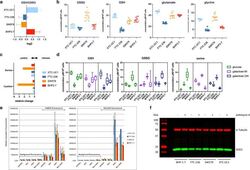
- Figure 2 Intracellular levels of glutathione and ROS in the TCCLs, XTC.UC1, FTC-236, SW579 and BHP2-7; ( a ) ratio of reduced to oxidized glutathione, GSH/GSSG; ( b ) intracellular concentrations of GSH, GSSG and the glutathione precursors, glutamate and glycine; ( c ). uptake of glutathione precursors cysteine and serine from the culture medium (expressed as relative change, i.e. mumol/h/10 6 cells of each metabolite in each cell line relative to the mean); ( d ). intracellular levels of GSH, GSSG and serine under normal culture condition (glucose) and under glucose to galactose exchange for 6 and 24 h; ( e ). Flow cytometric analysis of ROS: left panel, hydroxyl radicals detected by CellROX, right panel superoxide radicals detected by MitoSOX. Background fluorescence (left half each panel) and after incubation with CellROX or MitoSOX, respectively (right half). Fluorescence was analysed after cells were either untreated, NAC-treated, AMA-treated or AMA + NAC-treated. f. SOD2 immunoblotting (green signal). alpha-Tubulin was used as internal reference (red signal). A short treatment with 100 uM AMA did not affect protein expression. Left lane, molecular weight markers. Top and bottom of the image were cropped. For full-length gel, see end Supplementary Information.

- Submitted by
- Invitrogen Antibodies (provider)
- Main image

- Experimental details
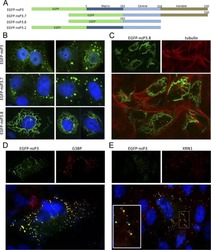
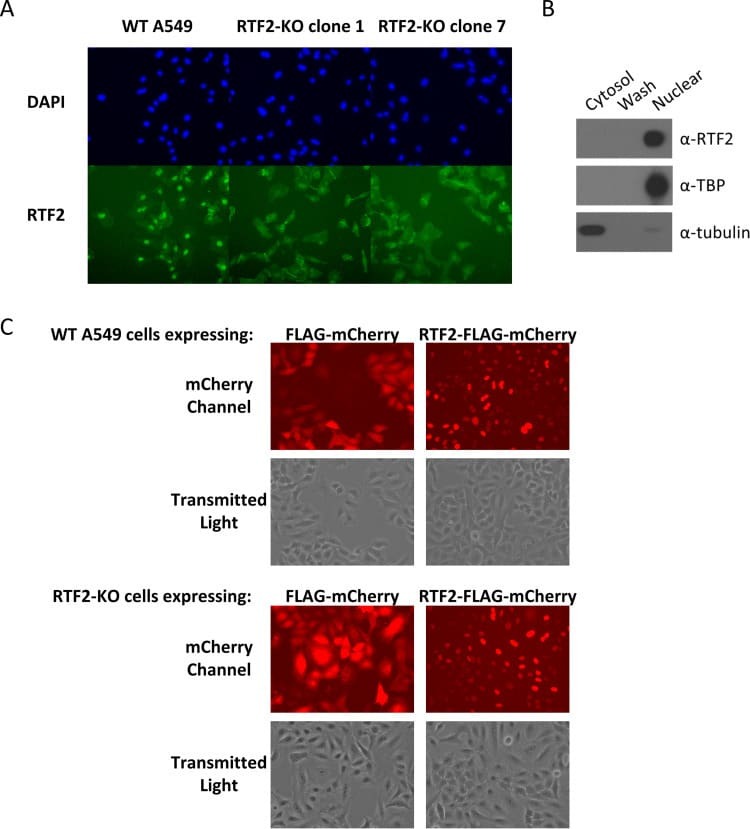
- FIG 3 RTF2 localizes to the nucleus. (A) Immunofluorescence of WT A549 cells and two distinct clones of RTF2-KO cells. (B) Biochemical fractionation of WT A549 cells into cytosolic and nuclear fractions. Cells were first suspended in HEPES-sucrose-Ficoll (HSF) buffer containing digitonin to extract the cytosolic proteins and washed once with HSF buffer, before lysing the nuclear pellet in RIPA buffer to release the nuclear proteins. TATA-binding protein (TBP), a nuclear protein, and tubulin, a cytosolic protein, were included as controls for the fractionation protocol. (C) Live-cell imaging of cells expressing either mCherry or the RTF2-mCherry fusion protein. WT A549 (top) and RTF2-KO cells (bottom) were transduced with lentiviruses that encode either FLAG-mCherry or RTF2-FLAG-mCherry and cultured for a week, before they were visualized under a wide-field epifluorescence microscope.
- Submitted by
- Invitrogen Antibodies (provider)
- Main image
- Experimental details
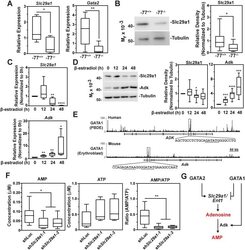
- 10.1371/journal.pgen.1009286.g009 Fig 9 GATA factor regulatory circuit links Slc29a1 with adenosine mechanisms. (A) qRT-PCR analysis of Slc29a1 (left) and Gata2 (right) mRNA from Gata2 -77 +/+ and -77 -/- HSPCs isolated from E14.5 fetal liver (n = 10). (B) Representative Western blot analysis to detect Slc29a1 protein in Gata2 -77 +/+ and -77 -/- murine HSPCs isolated from E14.5 fetal liver (left). Quantification of relative band intensities from the immunoblots (n = 10; right). Tubulin served as a loading control. (C) qRT-PCR analysis of Slc29a1 (top) or Adk (bottom) mRNA isolated from untreated vs beta-estradiol-treated (12, 24, or 48 hours) G1E-ER-GATA1 cells. (D) Representative Western blot analysis to detect Slc29a1 and Adk protein levels in untreated vs beta-estradiol-treated (12, 24, or 48 hours) G1E-ER-GATA1 cells (left). Quantification of relative band intensities from the immunoblots (right). Tubulin served as a loading control. Statistical significance was determined by comparing values at 12, 24, or 48-hour times to those from untreated cells (0 hour). Data are from 4 separate experiments (n = 9). (E) ChIP-seq profiles of GATA1 occupancy at human (GEO GSE32491; PBDE) ADK and murine (GEO GSE30142; Ter119+ erythroblast) Adk loci [, ]. The underlined sequences denote WGATAR motifs. (F) AMP and ATP concentrations quantified by a luciferase-based assay in primary erythroblasts infected with shRNA targeting luciferase or Slc29a1 (left two panels). AMP/ATP ratio calculat

- Submitted by
- Invitrogen Antibodies (provider)
- Main image

- Experimental details
- Figure 4 Quantitative, multiplexed near-infrared fluorescent Western blotting. In the Western blot, the expression of proteins and phosphorylated proteins ((p)ALK as the fusion protein of EML4 or NPM1 with conformable molecular sizes, (p)STAT, (p)AKT, (p)ERK and household protein control alpha-Tubulin) for the cancer cell lines JVE404, NCI-H2228, BHP 2-7 and Karpas-299 are shown in the treated conditions of DMSO control, crizotinib (30, 100, 300 nM) and lorlatinib (30, 100, 300 nM), respectively. alphaTub, alpha-Tubulin; CR, crizotinib; LO, lorlatinib.

- Submitted by
- Invitrogen Antibodies (provider)
- Main image

- Experimental details
- Fig. 1 Interaction of CRMP2 and PKCgamma. a Immunoblot showing the co-immunoprecipitation of CRMP2 and PKCgamma from cerebellar lysates. Proteins were detected with the indicated antibodies. Normal rabbit IgG was used as a negative control. b HeLa cells were probed with alpha-PKCgamma and alpha-CRMP2 antibody and the interaction detected via Duolink proximity ligation assay (top row); alpha-CRMP2 and alpha-alpha-tubulin antibodies were used as a positive control (middle row) and primary antibodies were omitted as a negative control (bottom row). Blue, nuclei stained with DAPI; red, PLA signal. Scale bar = 20 mum
