Explore
 Validate
 Learn
Learn Immunohistochemistry
Antibody data
- Antibody Data
- Antigen structure
- References [0]
- Comments [0]
- Validations
- Immunohistochemistry [1]
- Other assay [6]
Submit
Validation data
Reference
Comment
Report error
- Product number
- 50-9871-82 - Provider product page

- Provider
- Invitrogen Antibodies
- Product name
- Collagen IV Monoclonal Antibody (1042), eFluor™ 660, eBioscience™
- Antibody type
- Monoclonal
- Antigen
- Other
- Description
- Description: This monoclonal antibody 1042 recognizes human collagen Type IV. Collagens are the main components of the extracellular matrix and provide the tensile strength to tissues. There are four main types of collagen (I, II, III and IV) which contribute to the connective tissue. Expression of type IV is restricted to the basal lamina. It contains two alpha-1 and one alpha-2-like chains. Collagen Type IV is associated with disorders such as Alport syndrome and Goodpasture's syndrome. Applications Reported: This 1042 antibody has been reported for use in immunohistochemical staining, immunohistochemical staining of frozen tissue sections, and immunohistochemical staining of formalin-fixed paraffin embedded tissue sections. Applications Tested: This 1042 antibody has been tested by immunohistochemistry on formalin-fixed paraffin embedded human tissue using low pH antigen retrieval and can be used at less than or equal to 10 µg/mL. It is recommended that the antibody be carefully titrated for optimal performance in the assay of interest. eFluor® 660 is a replacement for Alexa Fluor® 647. eFluor® 660 emits at 659 nm and is excited with the red laser (633 nm). Please make sure that your instrument is capable of detecting this fluorochome. Excitation: 633-647 nm; Emission: 668 nm; Laser: Red Laser. Filtration: 0.2 µm post-manufacturing filtered.
- Reactivity
- Human
- Host
- Mouse
- Isotype
- IgG
- Antibody clone number
- 1042
- Vial size
- 100 µg
- Concentration
- 0.2 mg/mL
- Storage
- 4° C, store in dark, DO NOT FREEZE!
No comments: Submit comment
Supportive validation
- Submitted by
- Invitrogen Antibodies (provider)
- Main image

- Experimental details
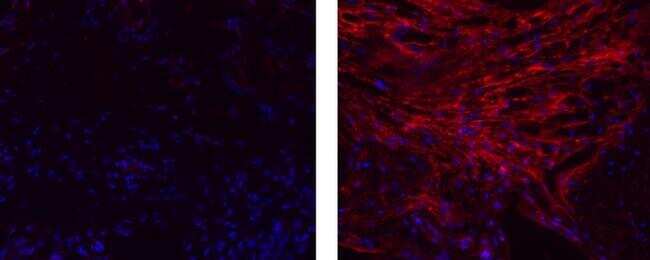
- Immunohistochemistry of formalin-fixed paraffin embedded human placenta stained with 10 µg/mL Mouse IgG2b K Isotype Control eFluor® 660 (left) or 10 µg/mL Anti-Human Collagen Type IV eFluor® 660 (right). Nuclei are stained with DAPI.
Supportive validation
- Submitted by
- Invitrogen Antibodies (provider)
- Main image

- Experimental details
- NULL
- Submitted by
- Invitrogen Antibodies (provider)
- Main image

- Experimental details
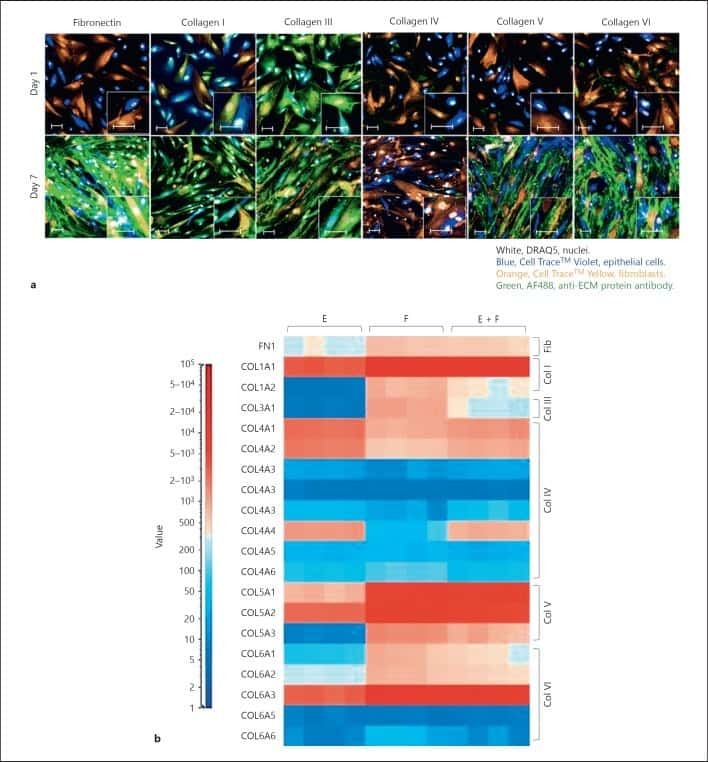
- Fig. 5 Markers of myofibroblast activation and extracellular matrix deposition. a Immunocytochemical analysis of fibroblast activation (alpha-SMA) and ECM deposition (collagen type I, collagen type IV and fibronectin) in response to TGF-beta 1 stimulation [1 ng/ml] for 72 h. Images are representative of n = 3 independent experiments at 10x magnification. Scale bars represent 200 mum. b mean fluorescent intensity of markers in (A) expressed as percent mean fluorescent intensity (MFI) normalised to ficoll treated-vehicle control. Histogram represents mean +- SEM. ***P

- Submitted by
- Invitrogen Antibodies (provider)
- Main image
- Experimental details
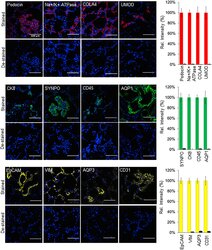
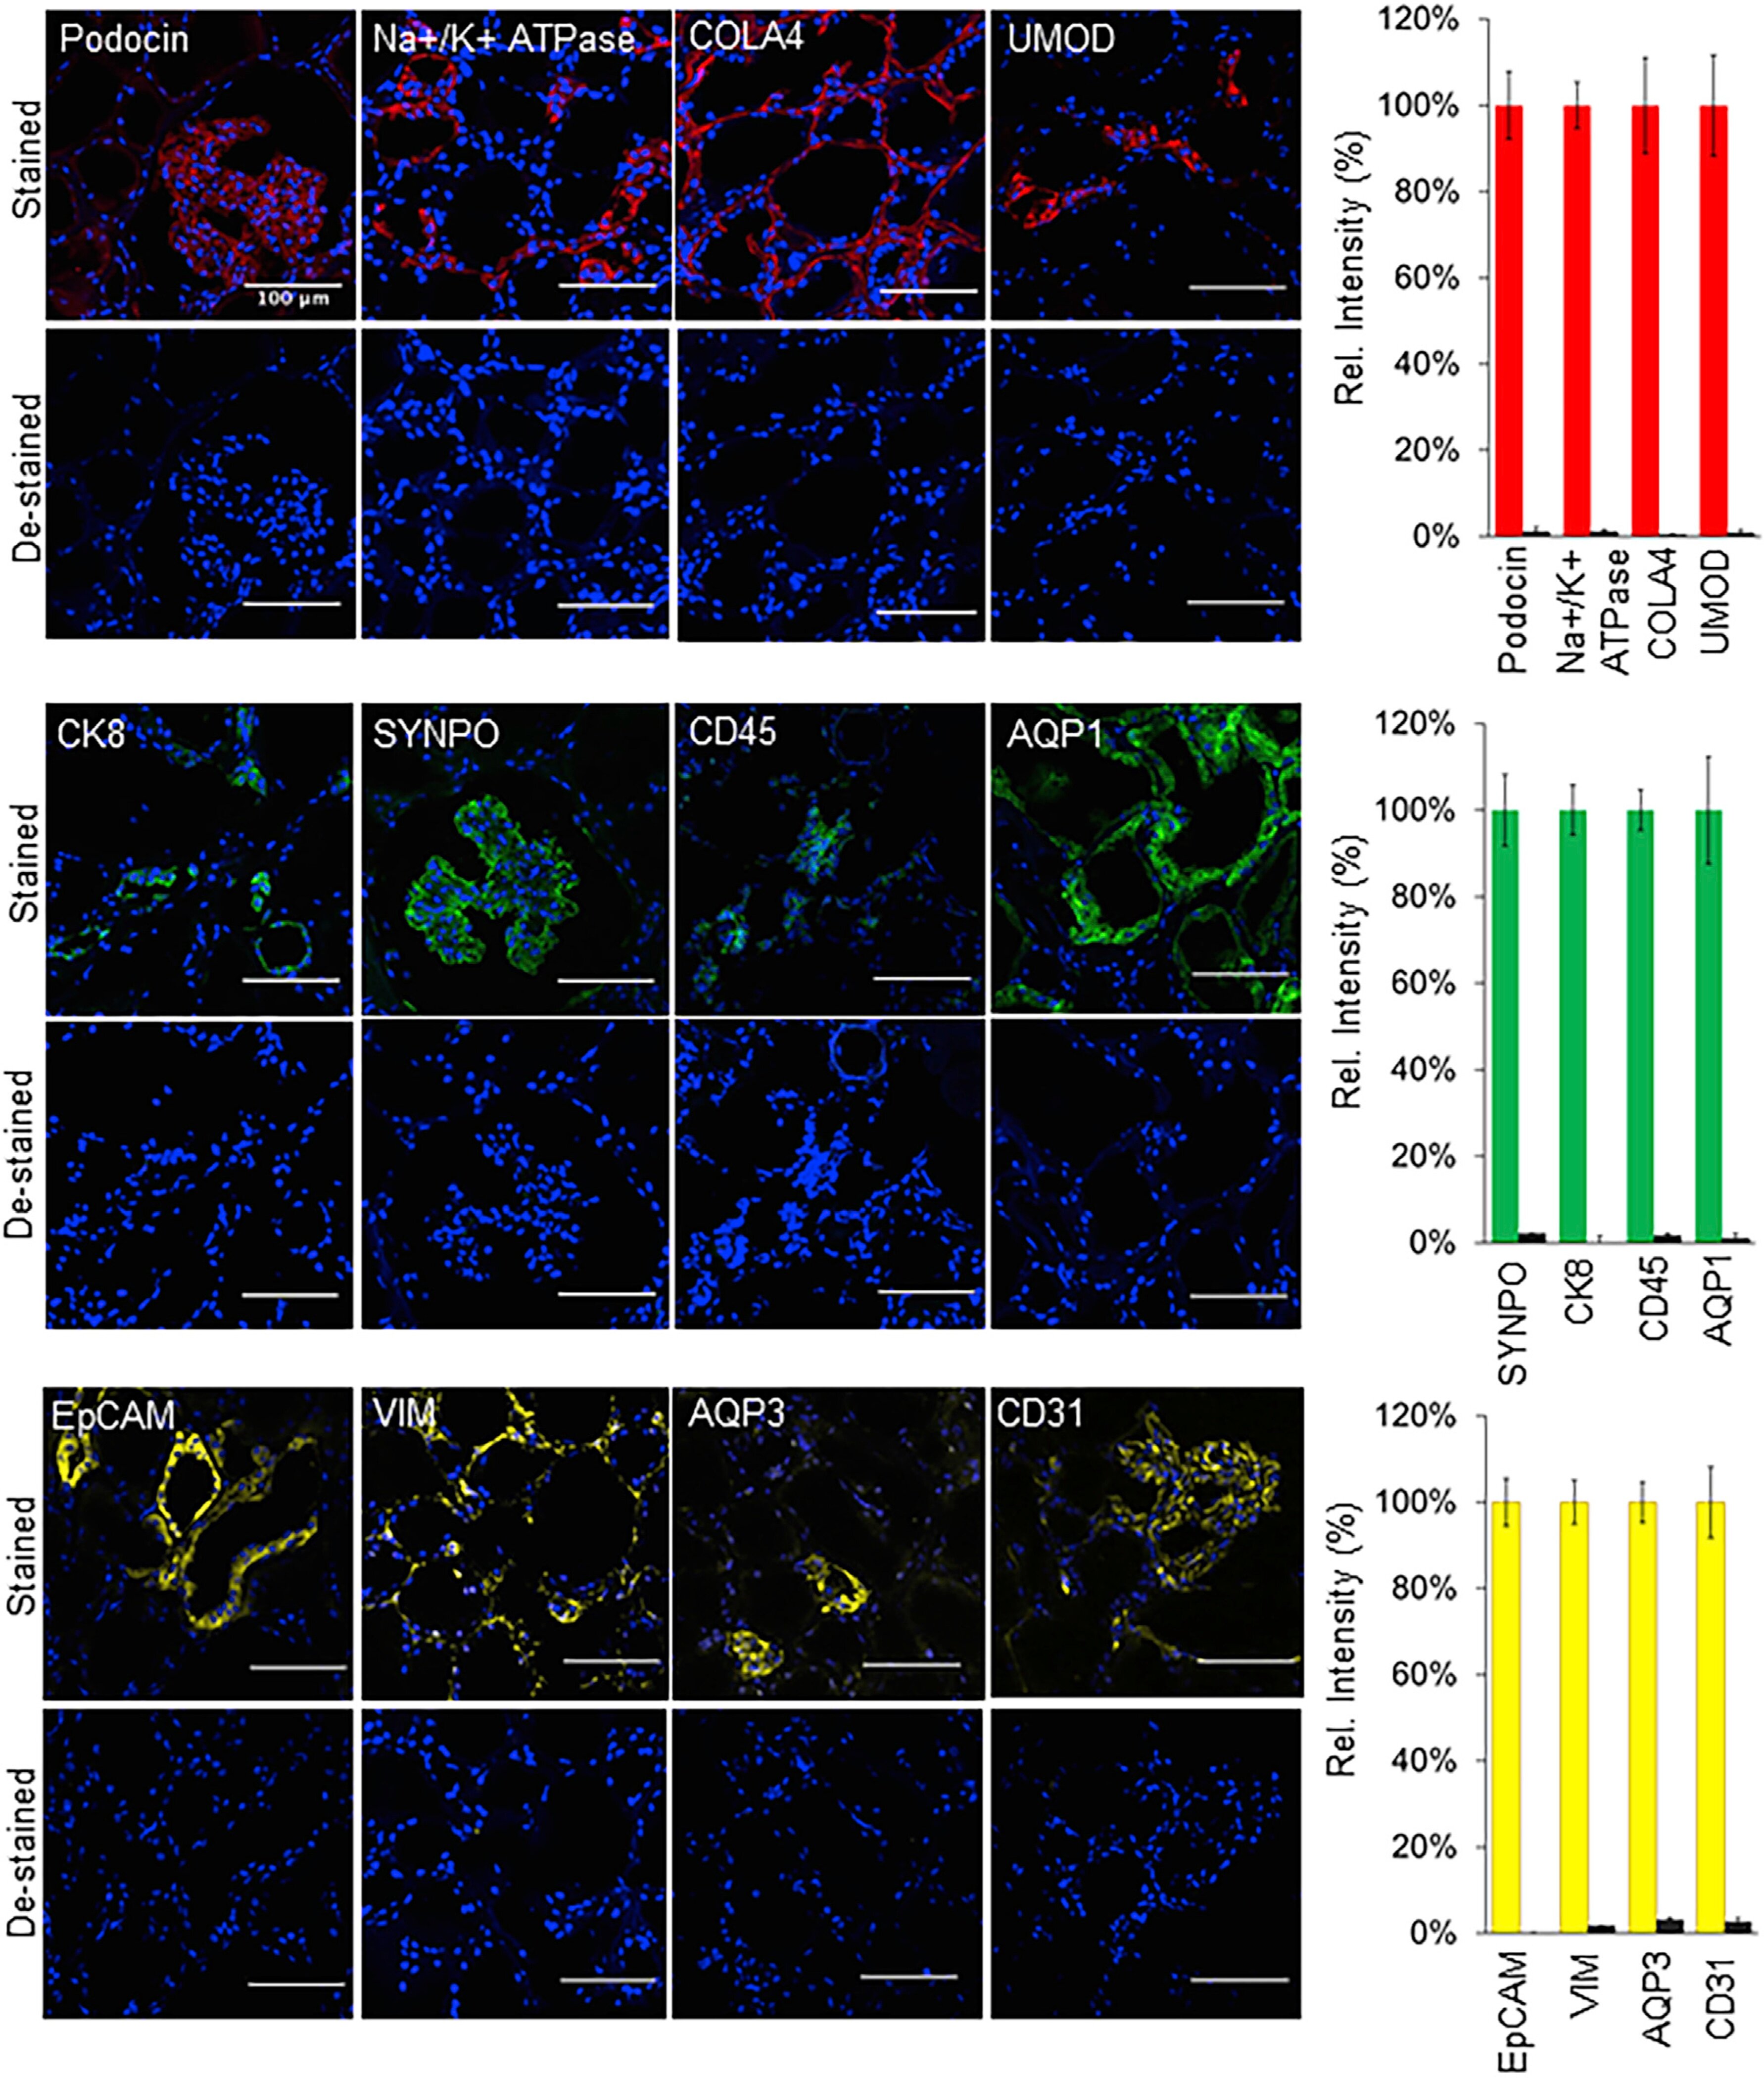
- Figure 3. Enzymatic de-staining of tissues stained using the SeqStain antibodies Immunofluorescence images showing human kidney tissue sections stained using SeqStain antibodies (as indicated in the panel). The antibodies were labeled using either the AF488 fluorophore (shown in green), the Cy3 fluorophore (shown in red), or the Cy5 fluorophore (shown in yellow). Immunofluorescence images of these tissue sections after de-staining with DNase I treatment are shown below each panel. All images are representative of at least three replicates. Graphs showing quantification of fluorescence intensity after staining (red bars, green bars, or yellow bars) and de-staining (brown bars) in each panel is also presented on the right. Graphs show the mean +- SD. Scale bar, 100 mum.
- Submitted by
- Invitrogen Antibodies (provider)
- Main image
- Experimental details
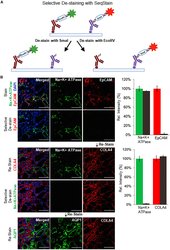
- Figure 4. Selective de-staining of complex tissues using SeqStain antibodies and restriction endonucleases (A) Schematic representation of the technique for selective removal of fluorophores from immunofluorescently labeled tissues. Tissue can be stained with a combination of SeqStain antibodies labeled using fluorescent DNA that contains specific recognition sites for restriction endonuclease(s) (such as EcoRV and SmaI). Treatment of samples with the specific restriction nuclease selectively removes fluorophores only from the antibodies carrying the respective DNA sequence, leaving all others undiminished. (B) Immunofluorescence images showing normal human kidney tissue sections after each of the cycles of staining with unique SeqStain antibodies (as indicated in the panel) and de-staining with a specific restriction endonuclease (as indicated). The antibodies were labeled using the AF488 fluorophore (shown in green) or the Cy3 fluorophore (shown in red). Merged images from the two fluorescence channels (along with images from DAPI-stained nuclear markers) are also shown. All images are representative of at least three replicates. Graph showing quantification of fluorescence intensity after staining (green and red bars) and de-staining (brown bars) in each panel is also presented on the right. Graphs show the mean +- SD. Scale bars, 100 mum.

- Submitted by
- Invitrogen Antibodies (provider)
- Main image
- Experimental details
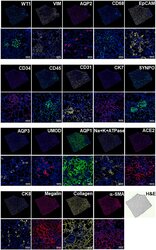
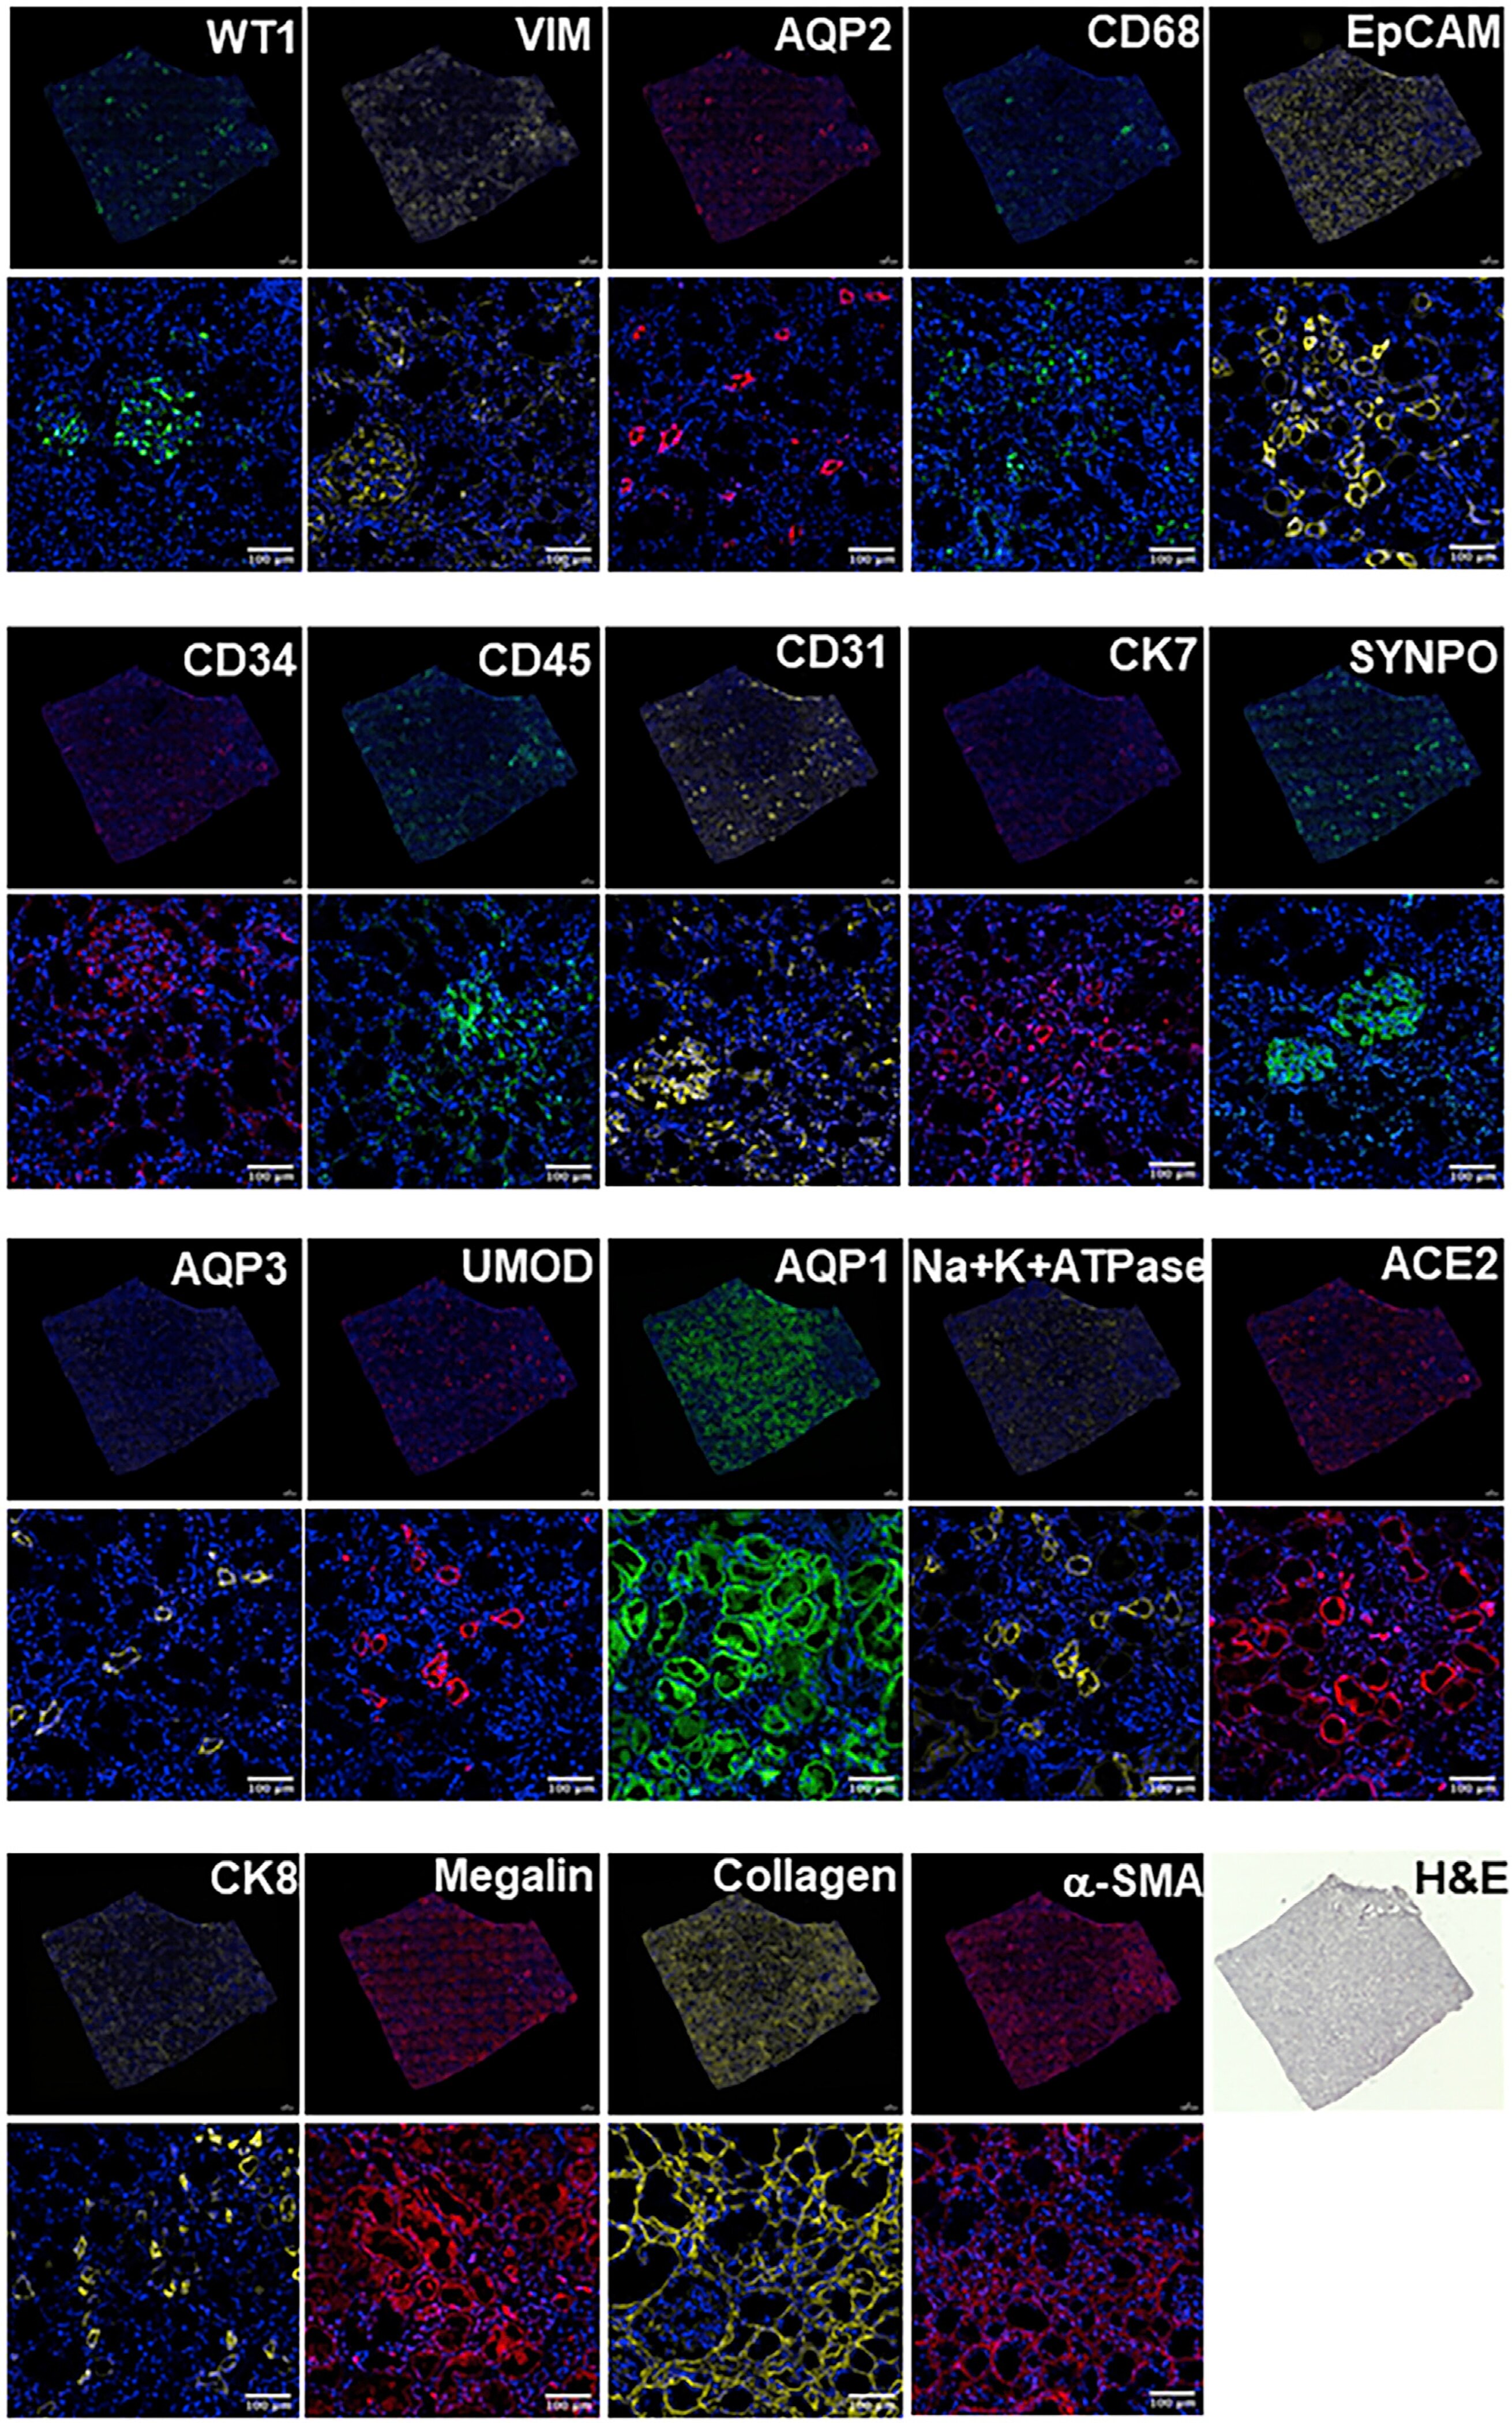
- Figure 6. SeqStain-based multiplex imaging of whole human kidney tissue provides a 20-plex image Immunofluorescent images of whole kidney tissue sections after each round of staining with unique SeqStain antibodies (as indicated) and DAPI (as indicated in the panel). Zoomed-in sections of images are presented below each panel. A serial section stained with H&E is also presented. Scale bars, 100 mum.
- Submitted by
- Invitrogen Antibodies (provider)
- Main image

- Experimental details
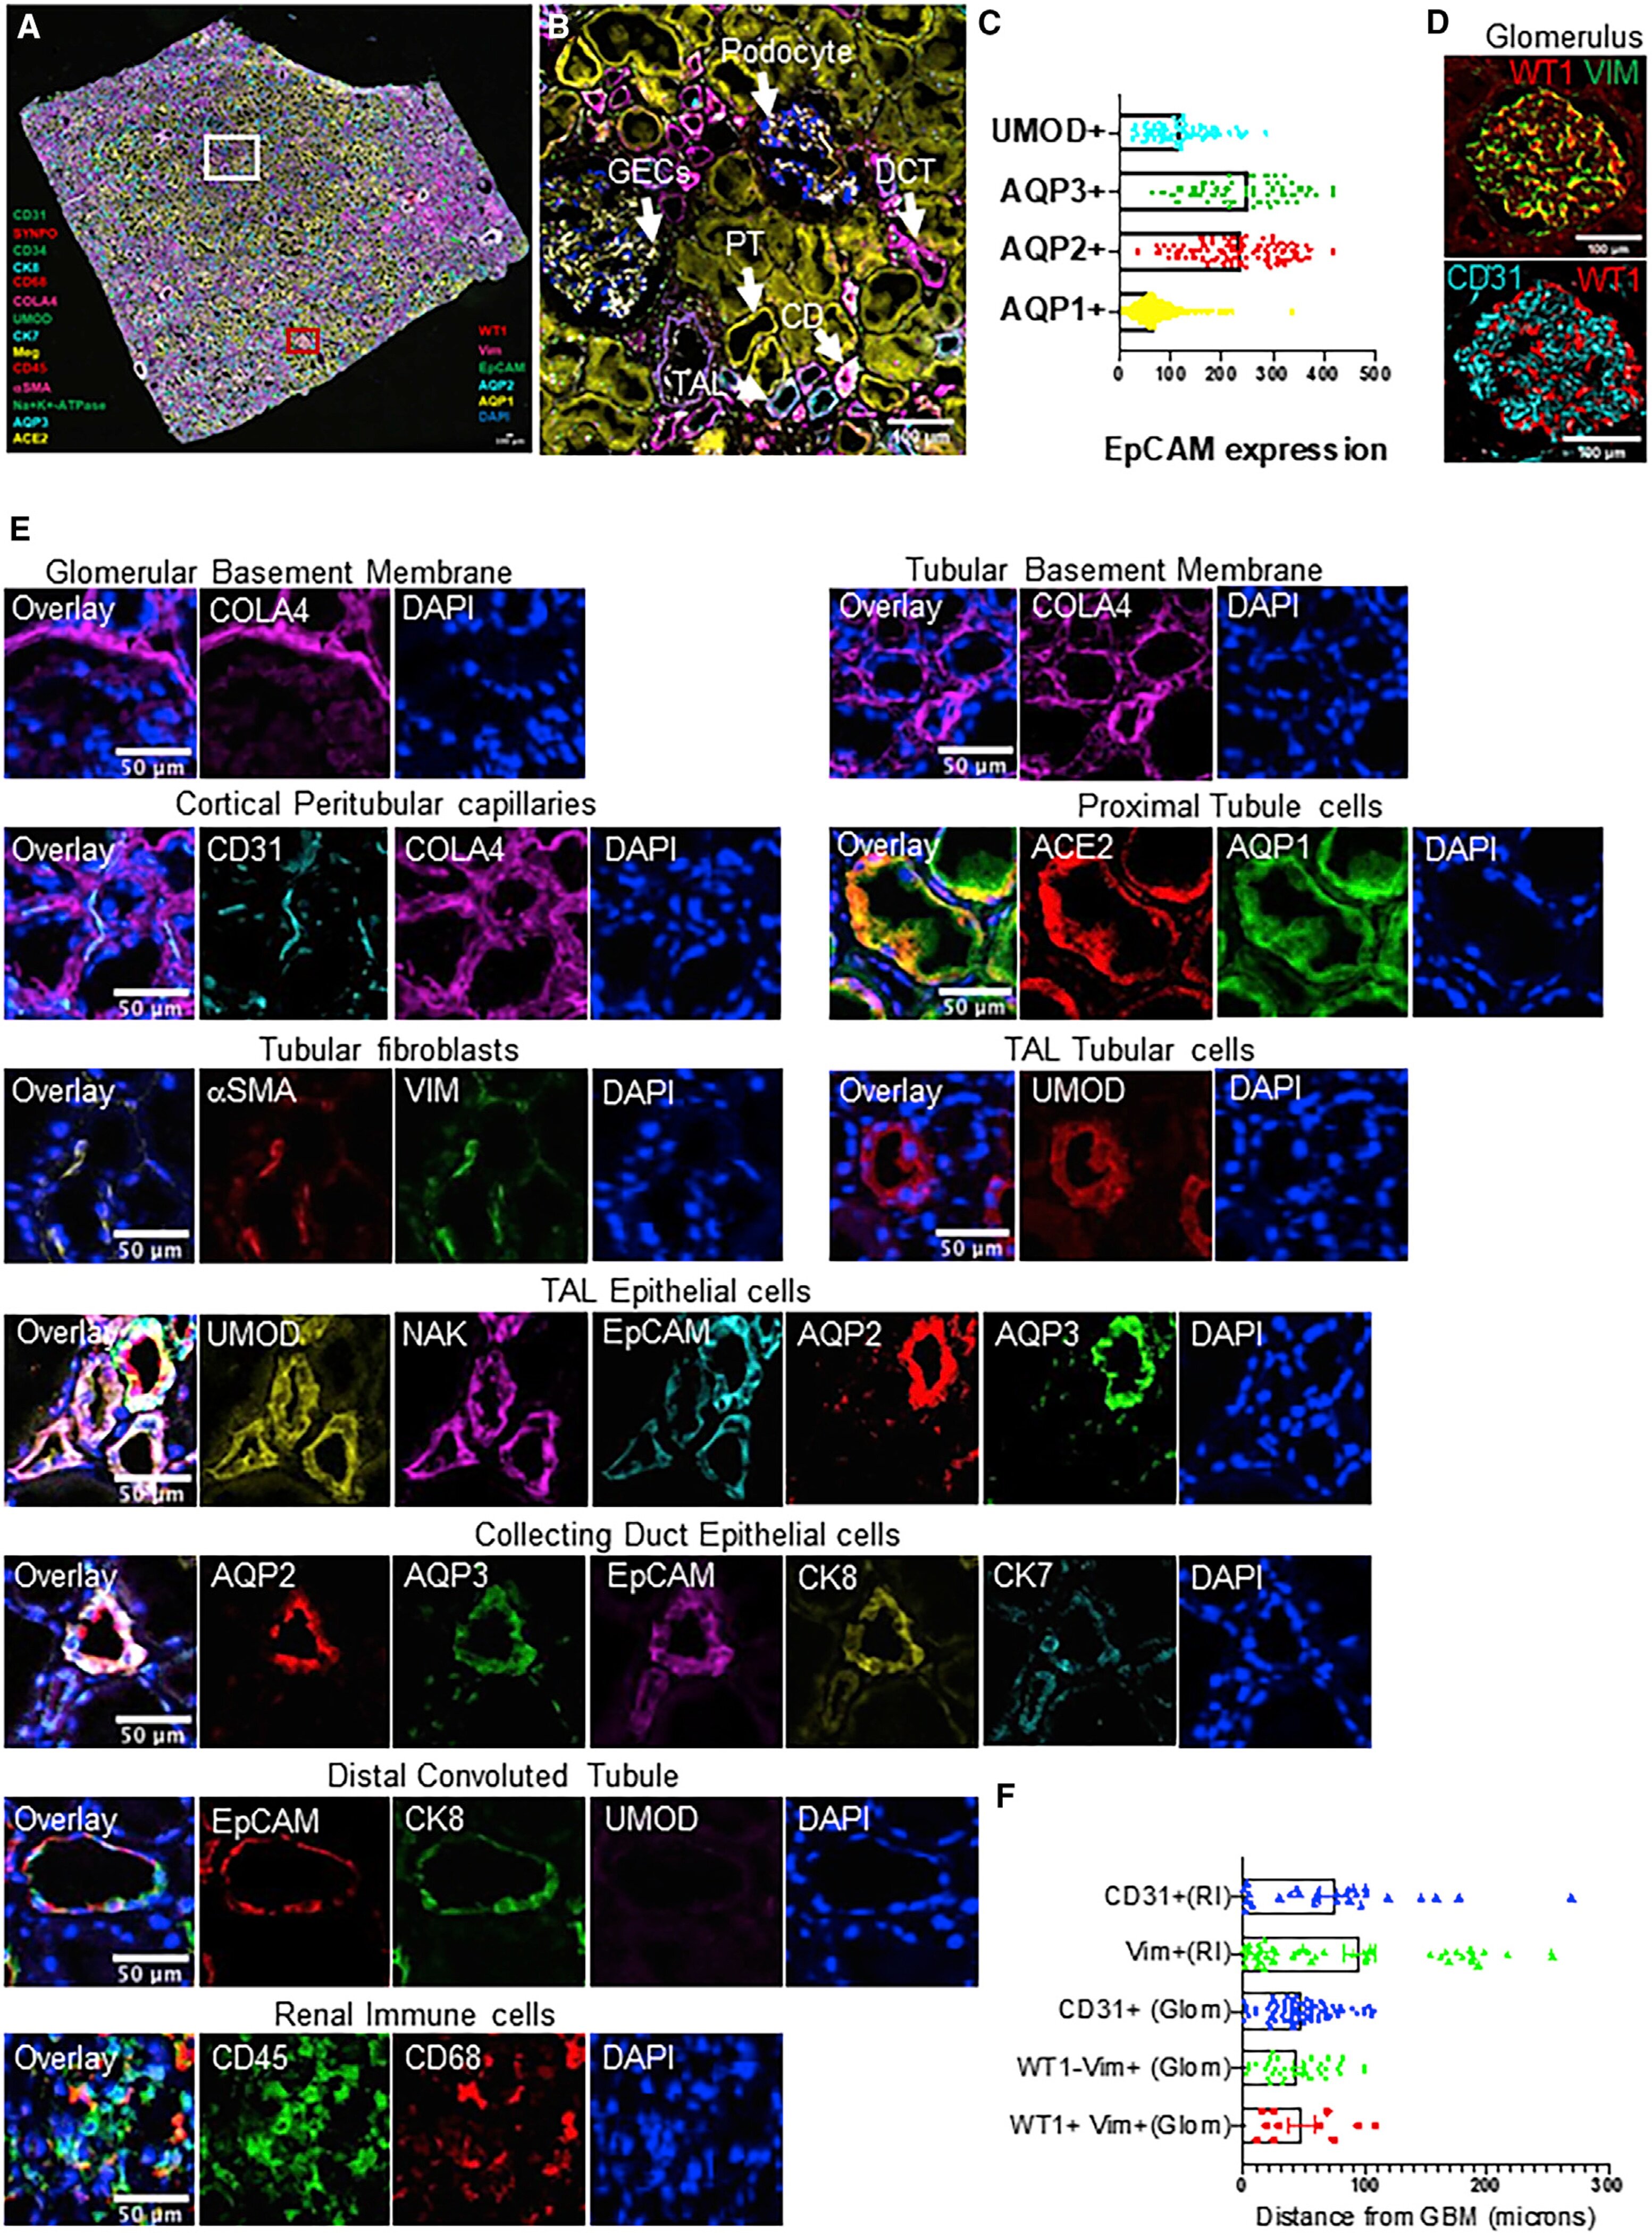
- Figure 7. SeqStain multiplex imaged panels identify major substructures in the human kidney (A) Image showing a composite overlay of aligned immunofluorescence image stack of 20 unique markers from the whole kidney tissue section. Scale bar, 100 mum. (B) Image of a zoomed-in region from the whole kidney tissue section in (A) (white square) showing various components of the kidney tissue, including the glomerular endothelial cells (GECs), proximal tubule (PT), collecting duct (CD), distal convoluted tubules (DCT), and podocytes. Scale bar, 100 mum. (C) Boxed dot plot showing computed co-expression of EpCAM and the indicated markers on a per-cell basis (mean +- SD). (D) Image of a zoomed-in region from the whole kidney tissue section in (A) (red square) showing one glomerulus (two panels), false colored for the indicated markers. Scale bar, 100 mum. (E) Representative images showing zoomed-in regions of composite overlay of aligned immunofluorescence image stacks from (A) for the identification of various immunophenotypes of cells and tissue sections based on co-localization of various markers (as labeled). Scale bar, 50 mum. (F) Boxed dot plot of cellular neighborhoods showing the computed distances of the indicated cells from glomerular basement membrane of a selected glomerulus in the kidney (mean +- SD). Glom refers to cells residing inside the glomerulus, whereas RI refers to cells residing outside the glomerulus, in the renal interstitium.