Explore
 Validate
 Learn
Learn Western blot
 Immunoprecipitation
Antibody data
- Antibody Data
- Antigen structure
- References [0]
- Comments [0]
- Validations
- Western blot [2]
- Immunohistochemistry [1]
- Chromatin Immunoprecipitation [1]
- Other assay [4]
Submit
Validation data
Reference
Comment
Report error
- Product number
- MA5-15173 - Provider product page

- Provider
- Invitrogen Antibodies
- Product name
- Phospho-ERK1/ERK2 (Thr202, Tyr204) Monoclonal Antibody (S.812.9)
- Antibody type
- Monoclonal
- Antigen
- Synthetic peptide
- Description
- It is not recommended to aliquot this antibody. This antibody is not cross-reactive with the corresponding phosphorylated residues of either JNK/SAPK or p38 MAP kinase.
- Reactivity
- Human, Mouse, Rat, Drosophila, Hamster, Porcine, Yeast, Zebrafish
- Host
- Rabbit
- Isotype
- IgG
- Antibody clone number
- S.812.9
- Vial size
- 200 µL
- Concentration
- 52.0 µg/mL
- Storage
- -20°C
No comments: Submit comment
Supportive validation
- Submitted by
- Invitrogen Antibodies (provider)
- Main image
- Experimental details
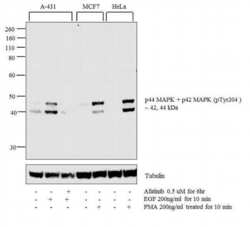
- WB analysis was performed on whole cell extracts (30 µg) of A-431 (1), A-431 treated with EGF (200 ng/mL for 10 minutes) (2), A-431 treated with Afatinib followed by EGF (0.5uM of Afatinib for 6hrs, 200 ng/mL for 10 minutes) (3), MCF7 (4) and MCF7 treated with PMA (200 ng/mL for 10 minutes) (5), HeLa (6) and HeLa treated with PMA (200 ng/mL for 10 minutes) (7). The blot was probed with Phospho-ERK1/ERK2 (Thr202, Tyr204) Rabbit Monoclonal Antibody (Product # MA5-15173, 1:1000 dilution) and detected by chemiluminescence using Goat anti-Rabbit IgG (H+L) Superclonal Secondary Antibody, HRP (Product # A27036, 0.25 µg/mL, 1:4000 dilution). 44, 42 kDa band corresponding to Phospho-ERK1/ERK2 (Thr202, Tyr204) was detected and increased upon EGF and PMA treatment across cell lines tested and pre-treatment with Afatinib (antagonist) resulted in inhibition of Phospho-ERK1/ERK2 (Thr202, Tyr204) in A-431 cell line upon EGF treatment. Protein samples were electrophoresed using Novex NuPAGE 4-12 % Bis-Tris gel (Product # NP0321BOX), XCell SureLock Electrophoresis System (Product # EI0002) and Novex Sharp Pre-Stained Protein Standard (Product # LC5800). Resolved proteins were then transferred onto a nitrocellulose membrane by wet transfer method. The membrane was probed with the relevant primary and secondary Antibody following blocking with 5 % skimmed milk. Chemiluminescent detection was performed using Pierce™ ECL Western Blotting Substrate (Product # 32106).

- Submitted by
- Invitrogen Antibodies (provider)
- Main image

- Experimental details
- WB analysis was performed on whole cell extracts (30 µg) of A-431 (1), A-431 treated with EGF (200 ng/mL for 10 minutes) (2), A-431 treated with Afatinib followed by EGF (0.5uM of Afatinib for 6hrs, 200 ng/mL for 10 minutes) (3), MCF7 (4) and MCF7 treated with PMA (200 ng/mL for 10 minutes) (5), HeLa (6) and HeLa treated with PMA (200 ng/mL for 10 minutes) (7). The blot was probed with Phospho-ERK1/ERK2 (Thr202, Tyr204) Rabbit Monoclonal Antibody (Product # MA5-15173, 1:1000 dilution) and detected by chemiluminescence using Goat anti-Rabbit IgG (H+L) Superclonal Secondary Antibody, HRP (Product # A27036, 0.25 µg/mL, 1:4000 dilution). 44, 42 kDa band corresponding to Phospho-ERK1/ERK2 (Thr202, Tyr204) was detected and increased upon EGF and PMA treatment across cell lines tested and pre-treatment with Afatinib (antagonist) resulted in inhibition of Phospho-ERK1/ERK2 (Thr202, Tyr204) in A-431 cell line upon EGF treatment. Protein samples were electrophoresed using Novex NuPAGE 4-12 % Bis-Tris gel (Product # NP0321BOX), XCell SureLock Electrophoresis System (Product # EI0002) and Novex Sharp Pre-Stained Protein Standard (Product # LC5800). Resolved proteins were then transferred onto a nitrocellulose membrane by wet transfer method. The membrane was probed with the relevant primary and secondary Antibody following blocking with 5 % skimmed milk. Chemiluminescent detection was performed using Pierce™ ECL Western Blotting Substrate (Product # 32106).

Supportive validation
- Submitted by
- Invitrogen Antibodies (provider)
- Main image
- Experimental details
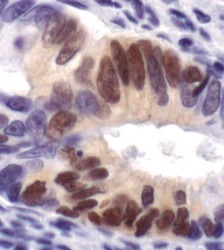
- Immunohistochemistry was performed on paraffin-embedded human colon carcinoma tissue. To expose target proteins, antigen retrieval was performed by boiling tissue sections in 10mM sodium citrate buffer, pH 6.0 for 10 minutes. Following antigen retrieval, endogenous peroxidase activity was quenched with 3% hydrogen peroxide for 10 minutes, tissues were blocked in 5% normal goat serum in TBST for 1 hour at room temperature, and then probed with a Phospho-p44/42 MAPK (Erk1/2) (pThr202/Tyr204) monoclonal antibody (Product # MA5-15173) at a dilution of 1:400 overnight at 4°C. Detection was performed using an HRP-conjugated anti-rabbit IgG secondary reagent system followed by DAB substrate. Tissues were counterstained with Hematoxylin and visualized by light microscopy.

Supportive validation
- Submitted by
- Invitrogen Antibodies (provider)
- Main image
- Experimental details
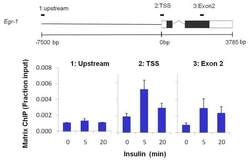
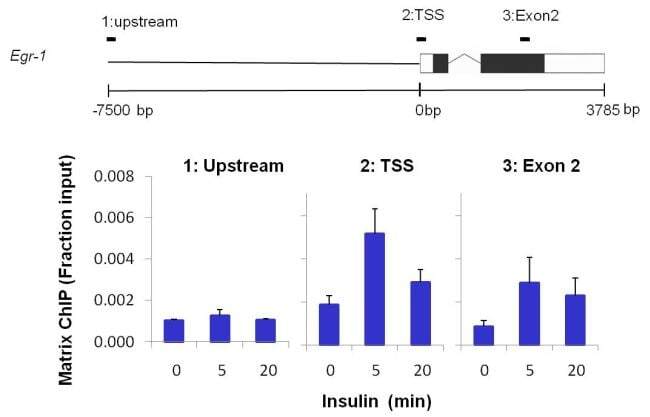
- Chromatin immunoprecipitation of Phospho-p44/42 MAPK (Erk1/2) (pThr202/Tyr204) was performed on cross-linked chromatin from 1 x 10^6 HTC-IR rat hepatoma cells treated with insulin for 0, 5, or 20 minutes. Immunoprecipitation was performed using a multiplex microplate Matrix ChIP assay (see reference for Matrix ChIP protocol: http://www.ncbi.nlm.nih.gov/pubmed/22098709) with 1 µL/100 µL well volume of a Phospho-p44/42 MAPK (Erk1/2) (pThr202/Tyr204) monoclonal antibody (Product # MA5-15173). Chromatin aliquots from ~1 x 10^5 cells were used per ChIP pull-down. Quantitative PCR data were done in quadruplicate using 1 µL of eluted DNA in 2 µL SYBR real-time PCR reactions containing primers to amplify 7kb upstream of the Egr1 gene, promoter-exon1 (transcription start site, TSS) of Egr1, or exon-2 of Egr1. PCR calibration curves were generated for each primer pair from a dilution series of sheared total rat genomic DNA. Quantitation of immunoprecipitated chromatin is presented as signal relative to the total amount of input chromatin. Results represent the mean +/- SEM for three experiments. A schematic representation of the Egr-1 locus is shown above the data where boxes represent exons (black boxes = translated regions, white boxes = untranslated regions), the zigzag line represents an intron, and the straight line represents upstream sequence. Regions amplified by Egr-1 primers are represented by the black bars above the schematic. Data courtesy of the Innovators Program.
Supportive validation
- Submitted by
- Invitrogen Antibodies (provider)
- Main image
- Experimental details
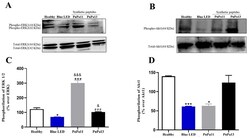
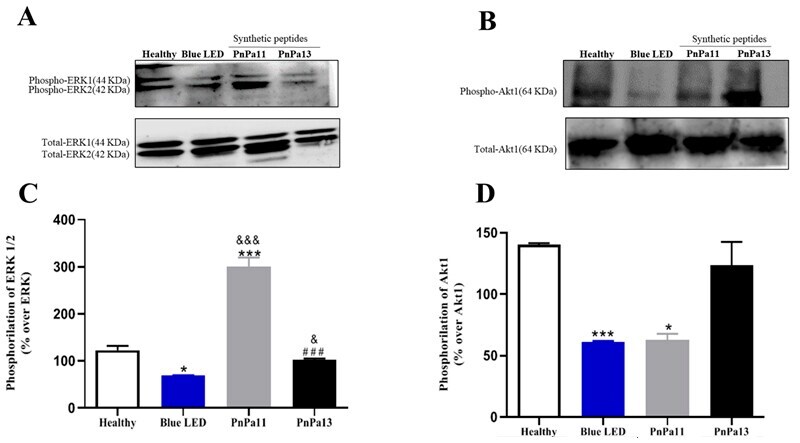
- Figure 8. PnPa11 increases Erk1/2, but not Akt1 activation, while PnPa13 does not modulate Erk1/2 and Akt1 phosphorylation against Blue LED damage. Shown are representative immunoblots for (A) hosphor-(upper panel) and total-Erk1/2, (B) hosphor-(upper panel) and total-Akt1expression (lower panel) in retina of healthy rats, rats that were blue LED exposed (vehicle-treated), treated with PnPa11 (1.25 ug/mL), or PnPa13 (1.25 ug/m) before blue LED light exposure. About 100 mg of cell lysate was used for each sample. Graphs show the densitometric analysis of (C) hosphor-Erk1/2 or (D) hosphor-Akt1 normalized to total-Erk1/2 or total-AKT expression in retina of healthy rats and rats that were blue LED-exposed (vehicle-treated), treated with PnPa11 (1.25 ug/mL) or PnPa13 (1.25 ug/mL) before LED light exposure. Data represent the means +- SD of four independent experiments (healthy and PnPa11) and three independent experiments (blue LED and PnPa13), expressed as percentage of basal Erk1/2 or Akt1 phosphorylation. *Significant differences as compared with healthy (*p < 0.05). & Significant differences as compared with blue LED ( & p < 0.05). # Significant differences as compared PnPa11 with PnPa13 ( # p < 0.05). Analysis was carried out using two-way ANOVA followed by Bonferroni post-test.
- Submitted by
- Invitrogen Antibodies (provider)
- Main image
- Experimental details
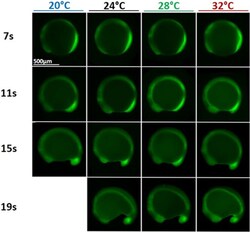
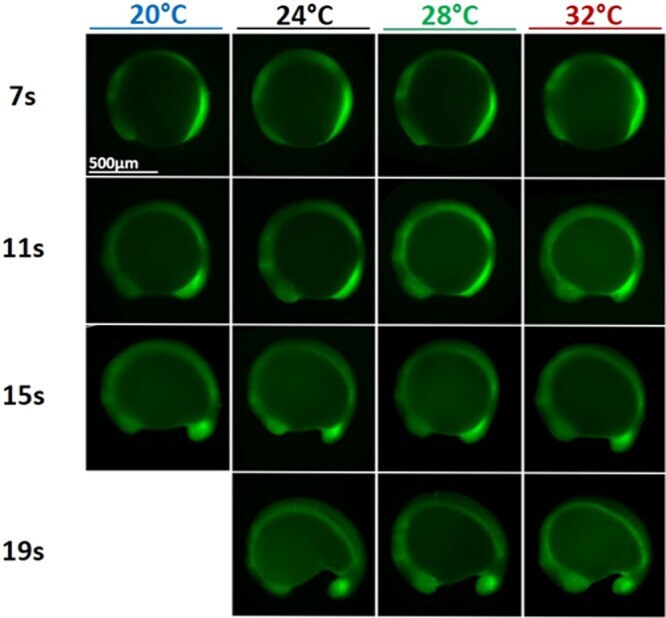
- Fig. 7 Somitogenesis at different temperatures. Phosphorylated Erk (pErk) distribution in WT embryos grown at different temperatures (20, 24, 28, and 32 degC) at 4 different stages of somitogenesis (7, 11, 15, or 19 somites stages) visualized by fluorescence following Immunohistochemistry staining (IHC). Even though embryos at 20 degC grow about three time slower than embryos at 32 degC, at similar stages embryos grown at different temperatures are similar and display similar pErk domain.
- Submitted by
- Invitrogen Antibodies (provider)
- Main image
- Experimental details
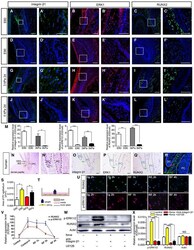
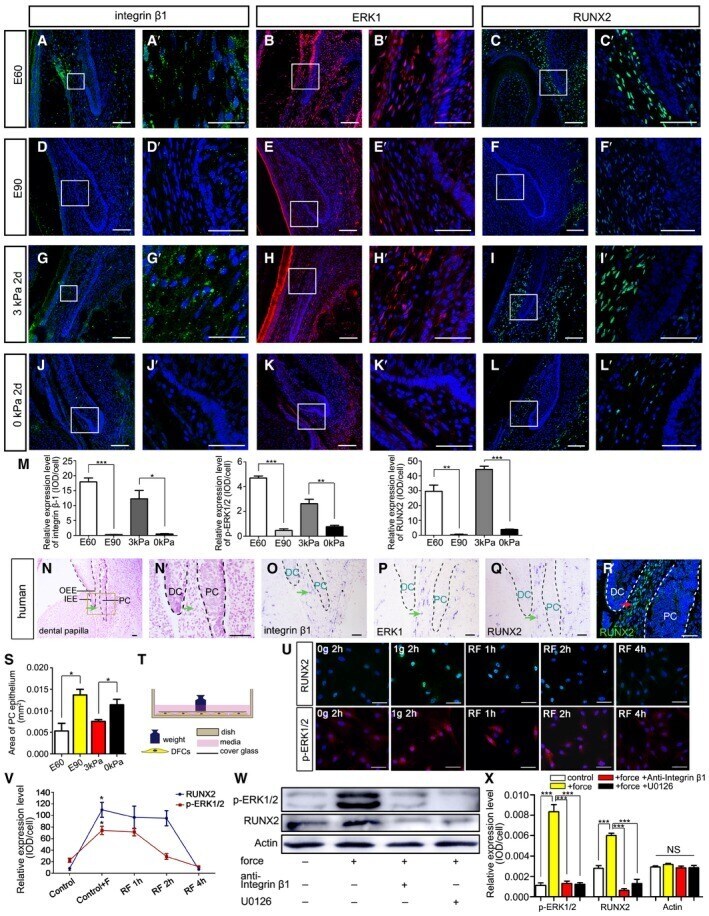
- Figure 4 Biomechanical stress regulates the integrin beta1-ERK1-RUNX2 pathway in mesenchyme between DC and PC A-L IF of integrin beta1, ERK1, and RUNX2 in miniature pig canine frontal sections at embryonic days 60 (E60), E90, and E60 cultured under 3 kPa stress for 2 days and E60 cultured under 0 kPa stress for 2 days; (A'-L') are magnifications of boxed regions in the corresponding figure panels. M Relative IF expression levels of integrin beta1, ERK1, and RUNX2 during E60, E90, and E60 cultured under 3 kPa stress for 2 days and E60 cultured under 0 kPa stress for 2 days. N Morphology of the human PC at weeks 18-19 (H&E staining); (N') is magnification of the boxed region in (N). DC, deciduous canine; PC, permanent canine; IEE, inner enamel epithelium; OEE, outer enamel epithelium. Mesenchyme between DC and PC is indicated with a green arrow. O-Q ISH expression patterns of ITGB1 , ERK1 , and RUNX2 in human PCs. Green arrows indicate the mesenchyme between DC and PC. R IF of RUNX2 in human PC. Mesenchyme between DC and PC is indicated with a red arrow. Red arrow indicates the mesenchyme between DC and PC. S PC epithelium areas in E60, E90, and E60 cultured under 3 kPa stress for 2 days and E60 cultured under 0 kPa stress for 2 days. T Illustration of force exertion on cultured dental follicle cells (DFCs). U IF of RUNX2 and phospho-ERK1/2 (p-ERK1/2) upon force loading with 0 or 1.0 g/cm 2 for 2 h or after force was removed and the cells cultured for an additional 1, 2, and 4
- Submitted by
- Invitrogen Antibodies (provider)
- Main image
- Experimental details
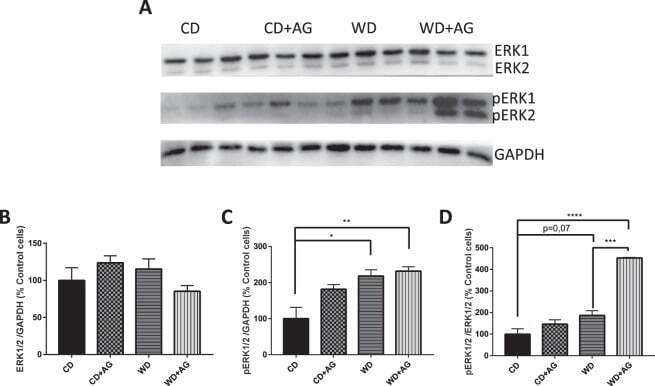
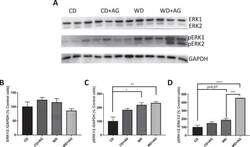
- Figure 5 Effect of acylated ghrelin on ERK1/ERK2 activation in the jejunum. Syrian Golden Hamsters were submitted to conventional chow (CD) or Western (WD) diets for 8 weeks. For the last 2 weeks of treatment, animals were continuously administered with acylated ghrelin (AG, 100 nmol/kg/day) or physiological saline. Before sacrifice, hamsters were fasted for 16 h before receiving an olive oil gavage (200 uL). Jejunum samples were homogenized in a lysis buffer and proteins lysates were analyzed by Western Blot with ERK1/ERK2 ( A,B ) and phosphoERK1/ERK2 ( A,C ) antibodies as indicated. The ratio of pERK1/2/ERK1/2 was also analyzed. ( D ) For accurate normalization, the same blot was probed with GAPDH. A representative blot is shown, illustrating an experiment in triplicate on the same gel and at the same time exposure. The results of every experiment are shown as mean +- SEM of n = 4-6 animals * P < 0.05; ** P < 0.01; *** P < 0.001; **** P < 0.0001.