Explore
 Validate
 Learn
Learn Western blot
Antibody data
- Antibody Data
- Antigen structure
- References [0]
- Comments [0]
- Validations
- Western blot [3]
- Immunocytochemistry [1]
- Immunohistochemistry [3]
- Flow cytometry [1]
- Other assay [14]
Submit
Validation data
Reference
Comment
Report error
- Product number
- 44-654G - Provider product page

- Provider
- Invitrogen Antibodies
- Product name
- ERK1/ERK2 Polyclonal Antibody
- Antibody type
- Polyclonal
- Antigen
- Synthetic peptide
- Description
- For western blotting applications, we recommend using the antibody at a 1:1,000 starting dilution. Positive controls used in western blotting were human epidermoid carcinoma A431, mouse NIH3T3, and rat pheochromocytoma (PC12) cells.
- Reactivity
- Human, Mouse, Rat, Bovine
- Host
- Rabbit
- Isotype
- IgG
- Vial size
- 100 µL
- Storage
- -20°C
No comments: Submit comment
Supportive validation
- Submitted by
- Invitrogen Antibodies (provider)
- Main image

- Experimental details
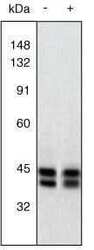
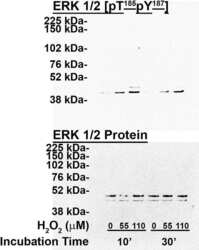
- Western Blot. Extracts of PC12 cells unstimulated (-) or stimulated with 20 ng/mL NGF for 20 minutes (+) were resolved by SDS-PAGE on a 10% Tris-glycine gel and transferred to nitrocellulose. The membrane was blocked with a 5% BSA-TBST buffer overnight at 4oC, then incubated with 0.5 µg/mL ERK1&2 antibody for two hours at room temperature in a 3% BSA-TBST buffer. After washing, the membrane was incubated with goat F (ab’)2 anti-rabbit IgG alkaline phosphatase (Product # ALI4405) and signals were detected using the Tropix WesternStar™ method. The data show that the ERK1&2 antibody allows the total amount of ERK1&2 to be measured (non-phoshphorylated as well as phosphorylated). The resulting signals serve as useful controls in assessing the degree of up-regulation as detected using an antibody to the dually phosphorylated (active) form of ERK1&2 (Product # 44-680G).
- Submitted by
- Invitrogen Antibodies (provider)
- Main image
- Experimental details
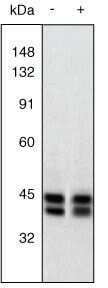
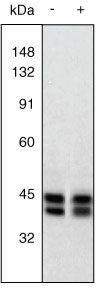
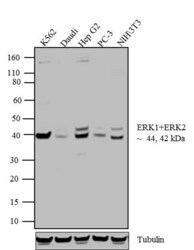
- Western blot analysis of ERK1 + ERK2 was performed by loading 20 µg of K562 (lane1), Daudi (lane2), Hep G2 (lane3), PC-3 (lane4) and NIH\3T3 (lane5) cell lysate using Novex® NuPAGE® 4-12 % Bis-Tris gel (Product # NP0322BOX), XCell SureLock™ Electrophoresis System (Product # EI0002), Novex® Sharp Pre-Stained Protein Standard (LC5800), and iBlot® Dry Blotting System (IB21001). Proteins were transferred to a nitrocellulose membrane and blocked with 5 % skim milk for 1 hour at room temperature. ERK1 + ERK2 was detected at ~44 and 42 kDa using ERK1 + ERK2 Rabbit Polyclonal Antibody (Product # 44-654G) at 1:1000 dilution in 5 % skim milk at 4°C overnight on a rocking platform. Goat Anti-Rabbit IgG - HRP Secondary Antibody (G21234) at 1:5000 dilution was used and chemiluminescent detection was performed using Pierce™ ECL Western Blotting Substrate (Product # 32106).

Supportive validation
- Submitted by
- Invitrogen Antibodies (provider)
- Main image
- Experimental details
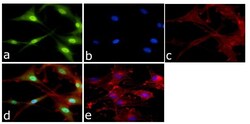
- Immunofluorescent analysis of ERK1 + ERK2 Antibody was done on 70% confluent log phase U87-MG cells. The cells were fixed with 4% paraformaldehyde for 15 minutes, permeabilized with 0.25% Triton™ X-100 for 10 minutes, and blocked with 5% BSA for 1 hour at room temperature. The cells were labeled with ERK1 + ERK2 Antibody (Product # 44-654G) at 1:250 dilution in 1% BSA and incubated for 3 hours at room temperature and then labeled with Alexa Fluor 488 Goat Anti-Rabbit IgG Secondary Antibody (Product # A-11008) at a dilution of 1:400 for 45 minutes at room temperature (Panel a: green). Nuclei (Panel b: blue) were stained with SlowFade® Gold Antifade Mountant with DAPI (Product # S36938). F-actin (Panel c: red) was stained with Alexa Fluor 594 Phalloidin (Product # A12381). Panel d is a merged image showing cytoplasmic and nuclear localization. Panel e is a no primary antibody control. The images were captured at 40X magnification.

Supportive validation
- Submitted by
- Invitrogen Antibodies (provider)
- Main image

- Experimental details
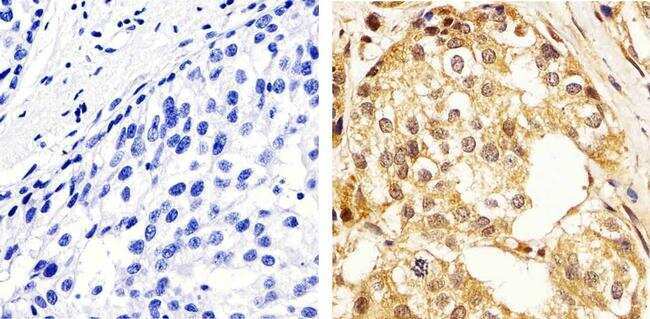
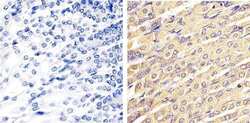
- Immunohistochemistry analysis of ERK1/2 (pan) showing staining in the cytoplasm and nucleus of paraffin-embedded human breast carcinoma tissue (right) compared to a negative control without primary antibody (left). To expose target proteins, antigen retrieval was performed using 10mM sodium citrate (pH 6.0), microwaved for 8-15 min. Following antigen retrieval, tissues were blocked in 3% H2O2-methanol for 15 min at room temperature, washed with ddH2O and PBS, and then probed with a ERK1/2 (pan) polyclonal antibody (Product # 44-654G) diluted in 3% BSA-PBS at a dilution of 1:100 overnight at 4ºC in a humidified chamber. Tissues were washed extensively in PBST and detection was performed using an HRP-conjugated secondary antibody followed by colorimetric detection using a DAB kit. Tissues were counterstained with hematoxylin and dehydrated with ethanol and xylene to prep for mounting.
- Submitted by
- Invitrogen Antibodies (provider)
- Main image

- Experimental details
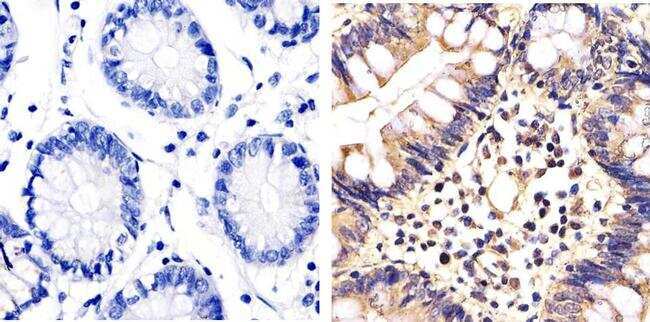
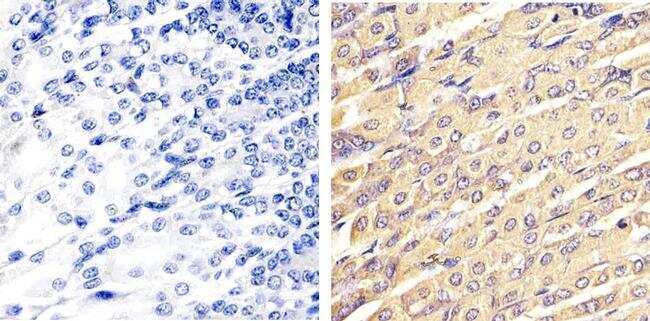
- Immunohistochemistry analysis of ERK1/2 (pan) showing staining in the cytoplasm and nucleus of paraffin-embedded human colon carcinoma tissue (right) compared to a negative control without primary antibody (left). To expose target proteins, antigen retrieval was performed using 10mM sodium citrate (pH 6.0), microwaved for 8-15 min. Following antigen retrieval, tissues were blocked in 3% H2O2-methanol for 15 min at room temperature, washed with ddH2O and PBS, and then probed with a ERK1/2 (pan) polyclonal antibody (Product # 44-654G) diluted in 3% BSA-PBS at a dilution of 1:20 overnight at 4ºC in a humidified chamber. Tissues were washed extensively in PBST and detection was performed using an HRP-conjugated secondary antibody followed by colorimetric detection using a DAB kit. Tissues were counterstained with hematoxylin and dehydrated with ethanol and xylene to prep for mounting.
- Submitted by
- Invitrogen Antibodies (provider)
- Main image
- Experimental details
- Immunohistochemistry analysis of ERK1/2 (pan) showing staining in the cytoplasm and nucleus of paraffin-embedded mouse stomach tissue (right) compared to a negative control without primary antibody (left). To expose target proteins, antigen retrieval was performed using 10mM sodium citrate (pH 6.0), microwaved for 8-15 min. Following antigen retrieval, tissues were blocked in 3% H2O2-methanol for 15 min at room temperature, washed with ddH2O and PBS, and then probed with a ERK1/2 (pan) polyclonal antibody (Product # 44-654G) diluted in 3% BSA-PBS at a dilution of 1:20 overnight at 4ºC in a humidified chamber. Tissues were washed extensively in PBST and detection was performed using an HRP-conjugated secondary antibody followed by colorimetric detection using a DAB kit. Tissues were counterstained with hematoxylin and dehydrated with ethanol and xylene to prep for mounting.
Supportive validation
- Submitted by
- Invitrogen Antibodies (provider)
- Main image
- Experimental details
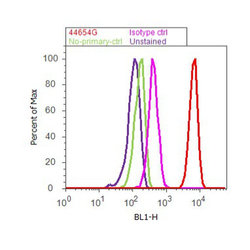
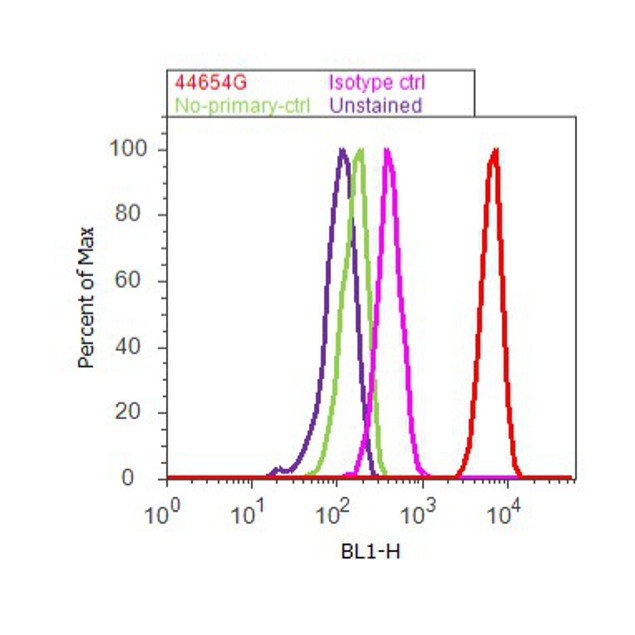
- Flow cytometry analysis of ERK1/2 was done on K562 cells. Cells were fixed with 70% ethanol for 10 minutes, permeabilized with 0.25% Triton™ X-100 for 20 minutes, and blocked with 5% BSA for 30 minutes at room temperature. Cells were labeled with ERK1/2 Rabbit Polyclonal Antibody (44654G, red histogram) or with rabbit isotype control (pink histogram) at 3-5 ug/million cells in 2.5% BSA. After incubation at room temperature for 2 hours, the cells were labeled with Alexa Fluor® 488 Goat Anti-Rabbit Secondary Antibody (A11008) at a dilution of 1:400 for 30 minutes at room temperature. The representative 10,000 cells were acquired and analyzed for each sample using an Attune® Acoustic Focusing Cytometer. The purple histogram represents unstained control cells and the green histogram represents no-primary-antibody control.
Supportive validation
- Submitted by
- Invitrogen Antibodies (provider)
- Main image
- Experimental details
- NULL
- Submitted by
- Invitrogen Antibodies (provider)
- Main image
- Experimental details
- NULL

- Submitted by
- Invitrogen Antibodies (provider)
- Main image

- Experimental details
- NULL
- Submitted by
- Invitrogen Antibodies (provider)
- Main image

- Experimental details
- NULL

- Submitted by
- Invitrogen Antibodies (provider)
- Main image
- Experimental details
- NULL

- Submitted by
- Invitrogen Antibodies (provider)
- Main image
- Experimental details
- NULL

- Submitted by
- Invitrogen Antibodies (provider)
- Main image
- Experimental details
- NULL
- Submitted by
- Invitrogen Antibodies (provider)
- Main image
- Experimental details
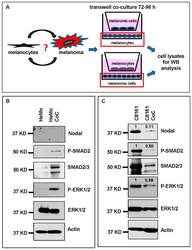
- Figure 3 Co-culture (CoC) experiments. ( A ) Schematic diagram summarizing the co-culture experiments using HeMn melanocytes and C8161 melanoma cells. Lysates of cells growing on the bottom well (red square) were used for Western blotting; ( B ) Western blot results show increased expression of P-SMAD2 and P-ERK1/2 in HeMn melanocytes co-cultured with human C8161 melanoma cells compared to control HeMn cells culured alone. However, Nodal expression was not detected in HeMn cells grown alone or in co-culture with C8161 melanoma cells; and ( C ) Results from WB analysis show reduced levels of Nodal, P-SMAD2 and P-ERK1/2 in C8161 melanoma cells when co-cultured with HeMn melanocytes. Numbers above WB bands represent densitometric units, normalized to actin loading control, total SMAD2/3 or total ERK1/2, as appropriate, relative to control.

- Submitted by
- Invitrogen Antibodies (provider)
- Main image
- Experimental details
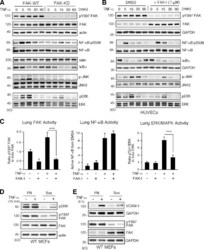
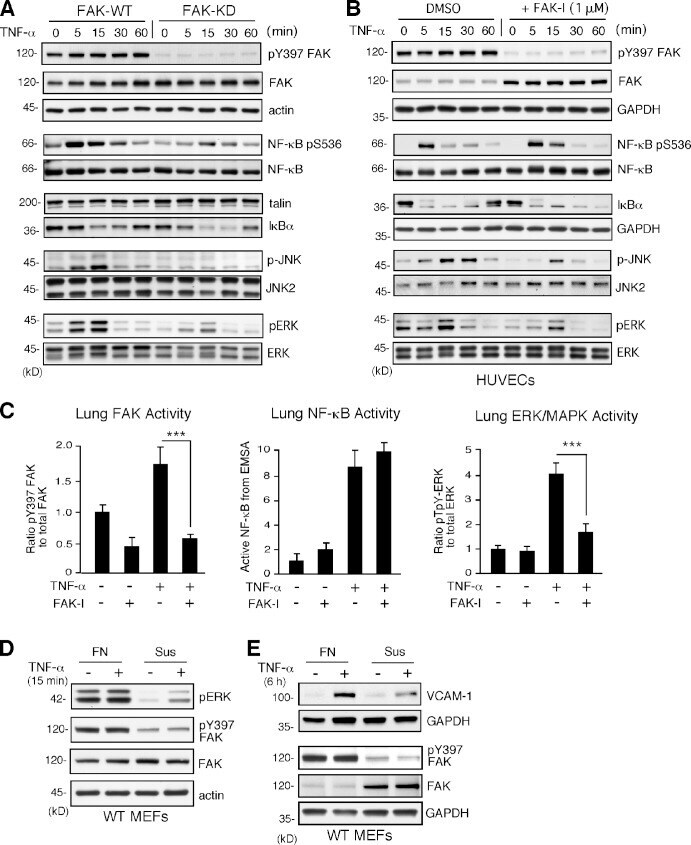
- Figure 4. TNF-alpha-induced MAPK but not NF-kappaB activation is dependent on FAK activity in vitro and in vivo. (A and B) FAK-WT or FAK-KD MEFs (A) and HUVECs pretreated with DMSO or FAK-I (1 uM PF271; B) were stimulated with 10 ng/ml TNF-alpha for the indicated times, and lysates were prepared for immunoblotting. Blots for activated FAK (pY397), total FAK, activated NF-kappaB (pS536), activated JNK (p-JNK and pT183/pY185), activated ERK (pERK and pT202/pY204), IkappaBalpha, and actin are shown. Internal loading controls for each gel are shown by anti-actin, anti-GAPDH, anti-talin, or reprobing membranes with antibodies to total NF-kappaB, JNK2, or total ERK1/2 immunoblotting. (C) PBS or TNF-alpha (0.02 mg/kg) was tail vein injected into mice, and, after 5 min (FAK and ERK activation) or 3 h (NF-kappaB activation), lung tissue was analyzed by immunoblotting or EMSA. Where indicated, FAK-I (100 mg/kg, PND-1186) was administered 3 h before starting experiments. Values, measured by densitometry, are means (+-SD) from six mice, representing two independent experiments. ***, P < 0.001. (D and E) MEFs were replated onto FN dishes or held in suspension (Sus) for 1 h before TNF-alpha (10 ng/ml) addition for 15 min (D) or 6 h (E) before protein cell lysis. Blots for activated ERK (pERK and pT202/pY204), activated FAK (pY397), total FAK, and actin are shown. Anti-GAPDH blotting is shown as loading controls.
- Submitted by
- Invitrogen Antibodies (provider)
- Main image
- Experimental details
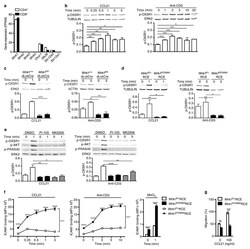
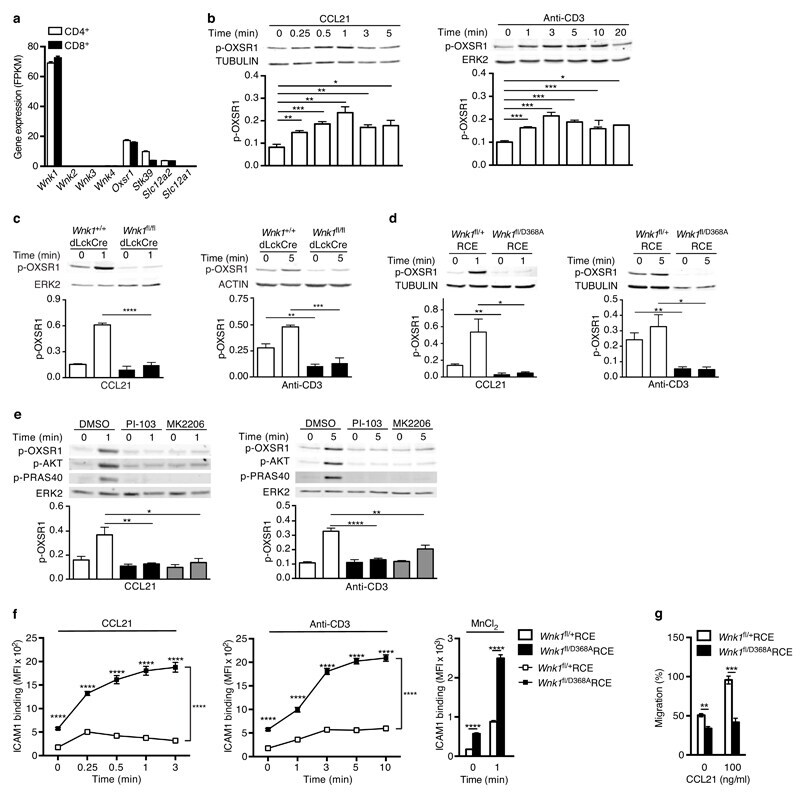
- Figure 5 Chemokine receptors and TCR activate WNK1. ( a ) Expression of the indicated genes in mouse T cells determined by RNAseq and expressed as fragments per kilobase per million reads (FPKM). ( b-e ) Immunoblots of mouse CD4 + T cells analyzed for phosphorylation of OXSR1 (p-OXSR1), Tubulin, Actin or ERK2 following stimulation with CCL21 or anti-CD3 for the indicated times. Levels of p-OXSR1 quantitated by normalizing to Tubulin, ERK2 or Actin; ( b ) p-OXSR1 in wild-type T cells; ( c ) p-OXSR1 in WNK1-deficient and control T cells; ( d ) p-OXSR1 in T cells expressing kinase-inactive WNK1-D368A or control cells; ( e ) p-OXSR1 in wild-type T cells treated with PI3-kinase inhibitor (PI-103), AKT inhibitor (MK2206) or vehicle (DMSO) and additionally analyzed for phosphorylation of AKT (p-AKT) or PRAS40 (p-PRAS40). ( f ) Binding of ICAM1 to mouse CD4 + T cells expressing kinase-inactive WNK1-D368A or control cells in response to CCL21, anti-CD3, or MnCl 2 for the indicated times. ( g ) CCL21-induced migration of T cells of the indicated genotypes through a Transwell system normalized to the CCL21-induced migration of control cells. * P < 0.05, ** P < 0.01, *** P < 0.001, **** P < 0.0001 (2-way ANOVA ( f ), Mann-Whitney ( g ), unpaired t-test ( b,c,d,e )). Sample sizes: a (3), b (4), c (4, CCL21; 3, anti-CD3), d (4), e (4, CCL21; 7, anti-CD3), f (6), g (9). Data are pooled from 2 ( f,g ), 3 ( a , c anti-CD3), 4 ( b, c CCL21 , d, and e CCL21) or 7 ( e anti-CD3) independent exper
- Submitted by
- Invitrogen Antibodies (provider)
- Main image
- Experimental details
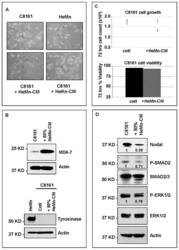
- Figure 4 Effect of treatment of C8161 melanoma cells with HeMn melanocyte conditioned medium (HeMn-CM). ( A ) C8161 cells treated with HeMn-CM show morphologic changes such as dendritic shape with long cytoplasmic extensions reminiscent of melanocyte differentiation. (40x original magnification); ( B ) Although, Melanoma Differentiation Associated protein 7 (MDA-7) was detected in C8161 cells treated with HeMn-CM, the melanin synthesis associated enzyme tyrosinase was not; ( C ) C8161 cells treated with HeMn-CM showed similar proliferation rate and cell viability as non-treated control C8161 cells making potential toxic effect of HeMn-CM on C8161 unlikely; ( D ) Western blot analysis show that HeMn-CM treated C8161 express lower levels of Nodal, P-SMAD2 and P-ERK1/2 compared to untreated control C8161 cells. Numbers below WB bands represent densitometric units, normalized to actin loading control, total SMAD2/3 or total ERK1/2, as appropriate, relative to control.

- Submitted by
- Invitrogen Antibodies (provider)
- Main image
- Experimental details
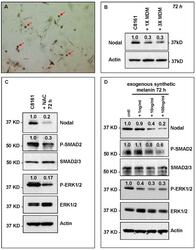
- Figure 5 HeMn melanocyte derived melanosomes (MDM) affect Nodal expression and signaling components in C8161. ( A ) Microphotograph (40x original magnification) shows MDM containing globules (red arrows) produced by HeMn melanocytes; ( B ) C8161 melanoma cells treated with different concentrations of MDM collected from HeMn melanocytes showed reduction in Nodal expression compared to untreated control C8161 cells. To mimic the anti-oxidant effect of free radical scavengers contained in MDM, C8161 cells were treated with N -acetyl- l -cysteine (NAC) known to generate the anti-oxidant, glutathione; ( C ) Western Blot analysis show that treatment of C8161 melanoma cells with 5 mM NAC resulted in reduced levels of Nodal, P-SMAD and P-ERK1/2 compared to untreated control C8161 cells; ( D ) Treatment of C8161 cells with synthetic melanin, also known to have anti-oxidant properties, resulted in a dose-dependent reduction of Nodal, P-SMAD and P-ERK1/2 levels compared to untreated control C8161 cells. Numbers above WB bands represent densitometric units, normalized to actin loading control, total SMAD2/3 or total ERK1/2, as appropriate, relative to control.

- Submitted by
- Invitrogen Antibodies (provider)
- Main image
- Experimental details
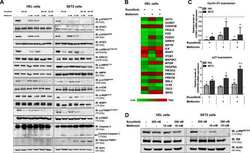
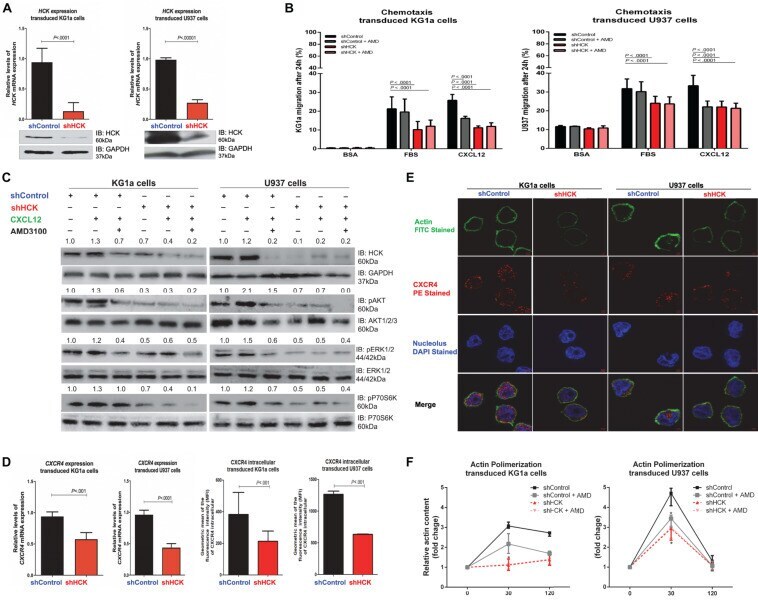
- FIGURE 1 HCK inhibition downregulates CXCR4/PI3K or MAPK pathways in leukemic cell lines, resulting in a reduction of cell chemotaxis through actin polymerization modulation. (A) HCK mRNA expression and HCK protein levels in transduced leukemia cell extracts. For qRT-PCR, results were calculated for each sample relative to the expression of the endogenous gene and determined using the 2 -DeltaDelta CT method. All data have been normalized to the values of the control. For Western blotting, membranes were blotted with antibodies against HCK (60 kDa) or GAPDH (37 kDa), as a control for equal sample loading, and analyzed by chemiluminescence. (B) Chemotaxis assays in transduced leukemia cells. The Transwell system was used to detect the chemotaxis of shControl or shHCK cells toward CXCL12 (100 ng/mL), in the presence and absence of a CXCR4 antagonist (1.25 mug/mL of AMD3100), using 10% FBS-containing medium as a positive control and 0.5% BSA-containing medium as the negative control. After 24 h, the migrated cells on the lower chamber membrane were counted. (C) Western blotting analysis of total cell extracts from transduced leukemia cell lines, stimulated or not with CXCL12 (100 ng/mL) and in the presence or absence of a CXCR4 antagonist (AMD3100). Membrane was blotted with antibodies against HCK (60 kDa), pAKT (60 kDa), AKT (60 kDa), pP70S6K (70 kDa), P70S6K (70 kDa), pERK1/2 (44/42 kDa), ERK1/2 (44/42 kDa) or GAPDH (37 kDa), as a control for equal sample loading, and develope
- Submitted by
- Invitrogen Antibodies (provider)
- Main image
- Experimental details
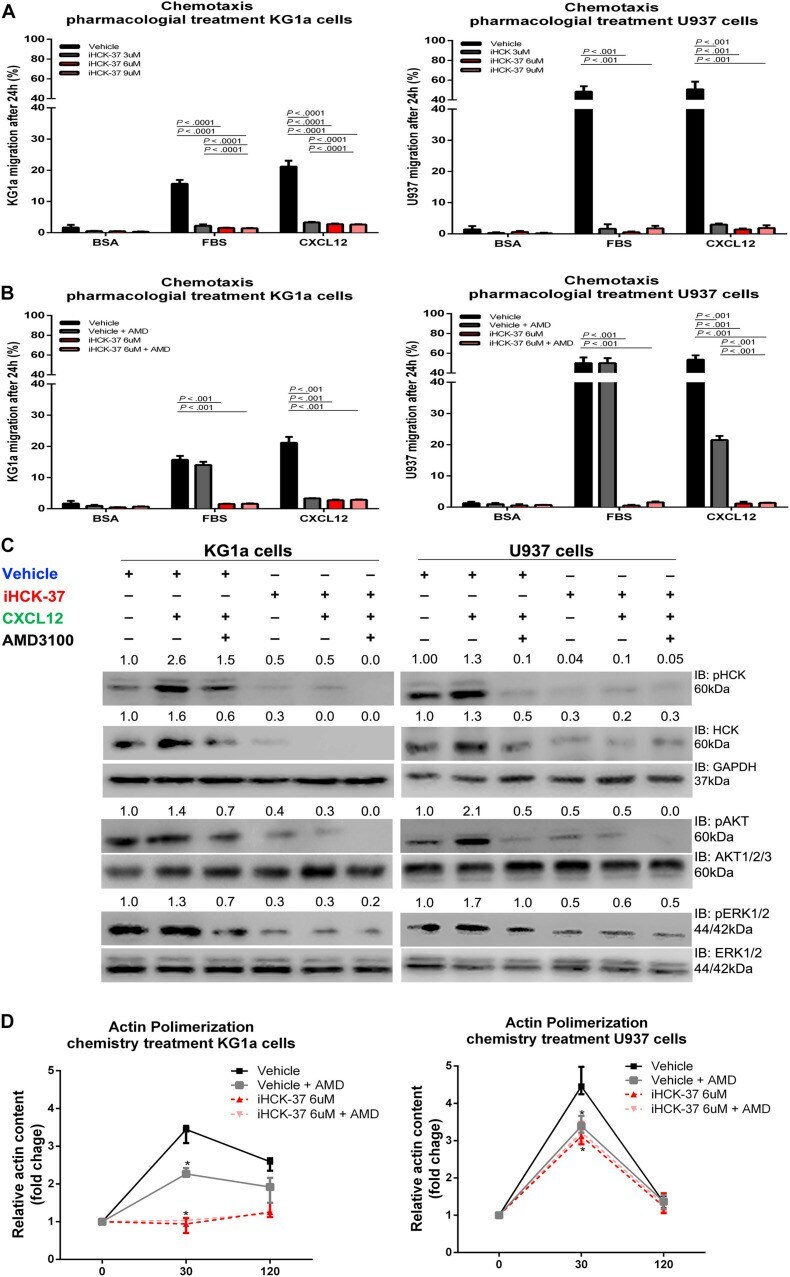
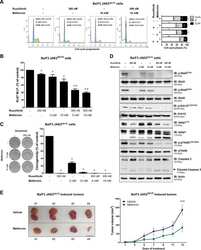
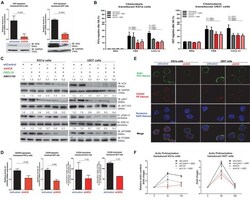
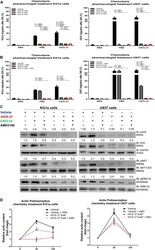
- FIGURE 3 Selective HCK inhibitor reduces CXCR4/PI3K and MAPK signaling pathways activation and decreases cell chemotaxis and actin polymerization. (A) Chemotaxis assays in iHCK-37 (3, 6, and 9 muM) treated or not cells and allowed to migrate in Transwell chambers. (B) Chemotaxis assays in iHCK-37 (6 muM) treated or not cells, in the presence or absence of CXCR4 antagonist (1.25 mug/mL of AMD3100). Leukemia cell lines were pretreated or not with iHCK-37 for 48 h and allowed to migrate in Transwell chambers toward CXCL12 (100 ng/mL), using 10% FBS-containing media as the positive control and 0.5% BSA-containing medium as the negative control. After 24 h, the migrated cells on the lower chamber membrane were counted. (C) Western blotting analysis of total iHCK-37 treated (6 muM) or not cell extracts, stimulated of not with CXCL12 (100 ng/mL) and in the presence and absence of a CXCR4 antagonist (AMD3100). Membranes were blotted with antibodies against HCK (60 kDa), pAKT (60 kDa), AKT (60 kDa), pERK1/2 (44/42 kDa), ERK1/2 (44/42 kDa), or GAPDH (37 kDa), as a control for equal sample loading, and developed with the ECL Western Blotting. (D) F-actin intracellular levels measured by flow cytometry in iHCK-37 treated or not cells. Leukemia cell lines were pretreated or not with iHCK-37 (6 muM) for 48 h and then stimulated with CXCL12 (300 ng/mL) for 30 or 120 s, in the presence and absence of a CXCR4 antagonist (AMD3100), stained with phalloidin, and MFI was quantified by flow cytome