Explore
 Validate
 Learn
Learn Flow cytometry
Antibody data
- Antibody Data
- Antigen structure
- References [0]
- Comments [0]
- Validations
- Flow cytometry [1]
- Other assay [7]
Submit
Validation data
Reference
Comment
Report error
- Product number
- 46-9109-41 - Provider product page

- Provider
- Invitrogen Antibodies
- Product name
- Phospho-ERK1/2 (Thr202, Tyr204) Monoclonal Antibody (MILAN8R), PerCP-eFluor™ 710, eBioscience™
- Antibody type
- Monoclonal
- Antigen
- Other
- Description
- Description: This MILAN8R monoclonal antibody recognizes human and mouse extracellular signal-regulated kinases 1 and 2 (also known as ERK1/2, p44/p42, or MAPK3/1) when phosphorylated on T202/Y204. ERK1/2 belong to a family of conserved serine/threonine protein kinases known as mitogen-activated protein kinases (MAPKs) that are involved in many cellular programs such as proliferation, differentiation, motility, and survival. ERK1/2 signaling is activated in response to numerous extracellular stimuli including mitogens, growth factors, and cytokines. The primary activators of ERK1/2 are MEK1 and MEK2 which act by phosphorylating the activation loop residues T202/Y204 and T185/Y187 in ERK1 and ERK2, respectively. Several downstream targets of ERK1/2 have been identified, including p90RSK and the transcription factor Elk-1. ERK1/2 are negatively regulated by MAPK phosphatases, known as DUSPs or MKPs, as well as by chemical inhibitors of MEK including U0126 and PD98059. Disruption of the ERK pathway is common in many types of cancer. Specificity of this MILAN8R clone was determined by ELISA, flow cytometry, and western blotting. Applications Reported: This MILAN8R antibody has been reported for use in intracellular staining followed by flow cytometric analysis. Applications Tested: This MILAN8R antibody has been pre-titrated and tested by intracellular staining and flow cytometric analysis of stimulated normal human peripheral blood cells or stimulated mouse splenocytes. This can be used at 5 µL (0.06 µg) per test. A test is defined as the amount (µg) of antibody that will stain a cell sample in a final volume of 100 µL. Cell number should be determined empirically but can range from 10^5 to 10^8 cells/test. Protocols: We recommend using Protocol C: Two-step protocol: Fixation/Methanol. Protocol A: Two-step protocol: intracellular (cytoplasmic) proteins and Protocol B: One-step protocol: intracellular (nuclear) proteins cannot be used. All Protocols can be found in the "Staining intracellular Antigens for Flow Cytometry Protocol" located in the Best Protocols Section under the Resources tab online. PerCP-eFluor® 710 emits at 710 nm and is excited with the blue laser (488 nm); it can be used in place of PerCP-Cyanine5.5. We recommend using a 710/50 bandpass filter, however, the 695/40 bandpass filter is an acceptable alternative. Please make sure that your instrument is capable of detecting this fluorochrome. Fixation: Samples can be stored in IC Fixation Buffer (Product # 00-8222) (100 µL cell sample + 100 µL IC Fixation Buffer) or 1-step Fix/Lyse Solution (Product # 00-5333) for up to 3 days in the dark at 4°C with minimal impact on brightness and FRET efficiency/compensation. Some generalizations regarding fluorophore performance after fixation can be made, but clone specific performance should be determined empirically. Excitation: 488 nm; Emission: 710 nm; Laser: Blue Laser. Filtration: 0.2 µm post-manufacturing filtered.
- Reactivity
- Human, Mouse
- Host
- Mouse
- Isotype
- IgG
- Antibody clone number
- MILAN8R
- Vial size
- 25 Tests
- Concentration
- 5 µL/Test
- Storage
- 4° C, store in dark, DO NOT FREEZE!
No comments: Submit comment
Supportive validation
- Submitted by
- Invitrogen Antibodies (provider)
- Main image
- Experimental details
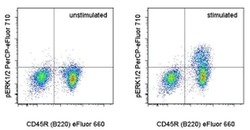
- Intracellular staining of unstimulated (left) or 15-minute anti-IgM-stimulated (right) C57Bl/6 splenocytes with Anti-Human/Mouse CD45R (B220) eFluor® 660 (Product # 50-0452-82) and Anti-Human/Mouse phospho-ERK1/2 (T202/Y204) PerCP-eFluor® 710 using the Fixation/Methanol Protocol. Cells in the lymphocyte gate were used for analysis.

Supportive validation
- Submitted by
- Invitrogen Antibodies (provider)
- Main image
- Experimental details
- NULL

- Submitted by
- Invitrogen Antibodies (provider)
- Main image

- Experimental details
- NULL
- Submitted by
- Invitrogen Antibodies (provider)
- Main image
- Experimental details
- NULL
- Submitted by
- Invitrogen Antibodies (provider)
- Main image
- Experimental details
- NULL

- Submitted by
- Invitrogen Antibodies (provider)
- Main image
- Experimental details
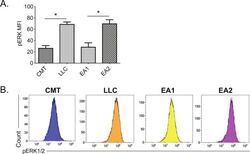
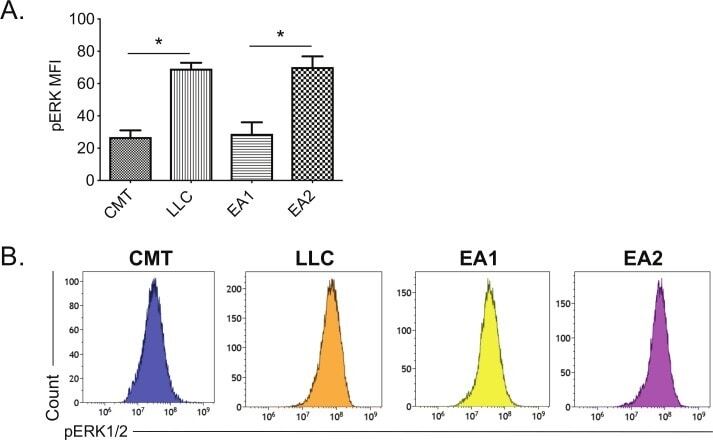
- Figure 3 Correlation between MHC II induction and basal phosphorylated ERK1/2 levels in murine NSCLC cells. Mouse NSCLC lines were cultured for 48 hours, and analyzed for basal levels of intracellular pERK1/2 by flow cytometric analysis. (A) Relative pERK1/2 levels in four murine NSCLC cell lines, including (B) representative histograms. Data are from two independent experiments, with n=3 replicates total. Statistical comparisons of pERK levels were focused on comparison of oncogene-matched cancer cell lines; pERK levels were not significantly different between CMT167 and EA1 cells. MFI is x10 6 . Graphs show mean+-SEM. Flow cytometry data analyzed singlets with MFI data visualized x10 6 values. LLC, Lewis lung carcinoma; MFI, median fluorescent intensity; NSCLC, non-small cell lung cancer.
- Submitted by
- Invitrogen Antibodies (provider)
- Main image

- Experimental details
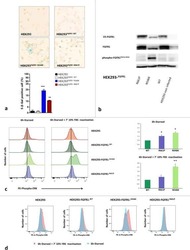
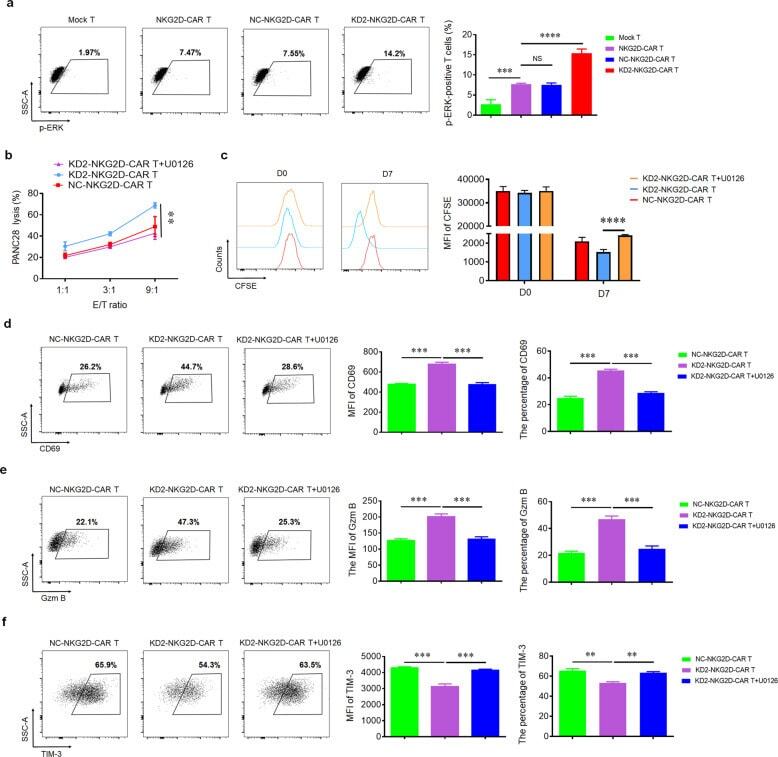
- Fig. 4 4.1R deficiency regulated the function of CAR T cells via ERK signaling pathway. a Mock T, NKG2D-CAR T, NC-NKG2D-CAR T, and KD2-NKG2D-CAR T were co-incubated with PANC28 at a 9:1 ratio for 16 h. The expression of p-ERK was detected by flow cytometry (left), and the percentage of p-ERK-positive T cells was statistically analyzed (right) ( n = 3). b Line plots displayed the cytotoxicity of NC-NKG2D-CAR T and KD2-NKG2D-CAR T against PANC28 at a different effector to target ( E : T ) ratios for 16 h in the absence and presence of 10 muM U0126. c NC-NKG2D-CAR T and KD2-NKG2D-CAR T were co-incubated with PANC28 at a different effector to target ( E : T ) ratios for 7 days in the absence and presence of 10 muM U0126. CFSE dilution was used as a measure of cell proliferation (left), and MFI was calculated (right) ( n = 3). NC-NKG2D-CAR T and KD2-NKG2D-CAR T were co-incubated with PANC28 at a different effector to target ( E : T ) ratios for 16 h in the absence and presence of 10 muM U0126. The expression of CD69 ( d ), Gzm B ( e ), and TIM-3 ( f ) was detected by flow cytometry (left). MFI and percentage were statistically analyzed and shown in column chart (middle and right) ( n = 3). Data were representative of three independent experiments. ** P < 0.01, *** P < 0.001, NS not significant.
- Submitted by
- Invitrogen Antibodies (provider)
- Main image
- Experimental details
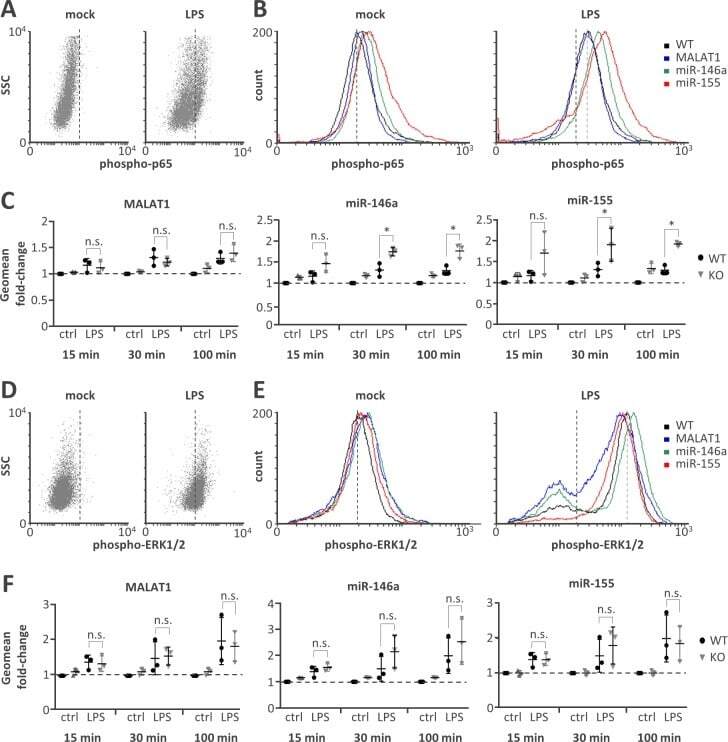
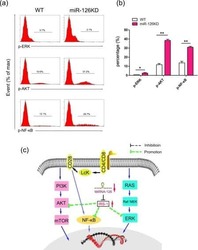
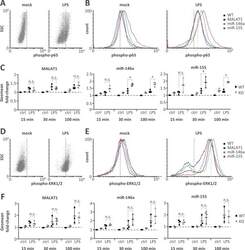
- Fig 4 Elevated NFkappaB p65 but not ERK1/2 activity on miR-146a and miR-155 knockout. A) Representative FACS scatter plots showing a right-shift of 30 min LPS-stimulated (1 mug / ml) compared to mock-treated monocytes stained with phospho-p65 antibody (PE-channel). B) Representative histogram plots showing an increased right-shift of miR-146a and miR-155 deficient compared to control or MALAT1 deficient monocytes after 30 min LPS-stimulation (1 mug / ml) and staining with a phospho-p65 antibody (PE-channel). C) Fold change in phospho-p65 signal in monocytes stimulated with LPS (1 mug / ml) for 15, 30 or 100 min compared to mock-treatment (ctrl) in wild-type (WT) or the indicated ncRNA knockout (KO) cells. All fold-changes are relative to the respective WT mock control. D-F) Same as A-C) but with phospho-ERK1/2 staining (APC-channel). Statistical significance was determined by a one-way ANOVA test with multiple comparisons (* p