 Explore
 Validate
 Learn
Learn Western blot
Antibody data
- Antibody Data
- Antigen structure
- References [0]
- Comments [0]
- Validations
- Western blot [6]
- Immunocytochemistry [2]
- Immunohistochemistry [4]
- Other assay [8]
Submit
Validation data
Reference
Comment
Report error
- Product number
- PA1-16947 - Provider product page

- Provider
- Invitrogen Antibodies
- Product name
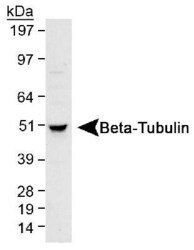
- beta Tubulin Polyclonal Antibody
- Antibody type
- Polyclonal
- Antigen
- Synthetic peptide
- Description
- Suggested positive control: antigen standard for TUBB (transient overexpression lysate), Hela whole cell extract.
- Reactivity
- Human, Mouse, Rat, Bovine, Chicken/Avian, Hamster, Porcine, Xenopus, Zebrafish
- Host
- Rabbit
- Isotype
- IgG
- Vial size
- 100 µL
- Concentration
- 1 mg/mL
- Storage
- Store at 4°C short term. For long term storage, store at -20°C, avoiding freeze/thaw cycles.
No comments: Submit comment
Supportive validation
- Submitted by
- Invitrogen Antibodies (provider)
- Main image
- Experimental details
- Western Blot analysis in HeLa whole cell lysate at a 1:1,000 dilution.

- Submitted by
- Invitrogen Antibodies (provider)
- Main image
- Experimental details
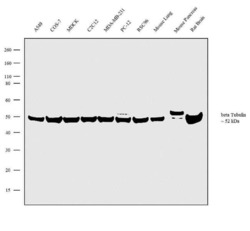
- Western blot analysis was performed on whole cell extracts (30 µg lysate) of A549 (Lane 1), COS-7 (Lane 2), MDCK (Lane 3), C2C12 (Lane 4), MDA-MB-231 (Lane 5), PC-12 (Lane 6), RSC96 (Lane 7) tissue extracts of Mouse Lung (Lane 8) and Rat Brain (Lane 9). The blot was probed with Anti-alpha Tubulin 1A Rabbit Polyclonal Antibody (Product # PA5-22060, 1:4000) and detected by chemiluminescence using Goat anti-Rabbit IgG (H+L) Superclonal™ Secondary Antibody, HRP conjugate (Product # A27036, 0.25 µg/mL, 1:4000 dilution). A 52 kDa band corresponding to alpha Tubulin 1A was observed across the cell lines and tissues tested. Known quantity of protein samples were electrophoresed using Novex® NuPAGE® 4-12 % Bis-Tris gel (Product # NP0322BOX), XCell SureLock™ Electrophoresis System (Product # EI0002) and Novex® Sharp Pre-Stained Protein Standard (Product # LC5800). Resolved proteins were then transferred onto a nitrocellulose membrane with iBlot® 2 Dry Blotting System (Product # IB21001). The membrane was probed with the relevant primary and secondary Antibody following blocking with 5 % skimmed milk. Chemiluminescent detection was performed using Pierce™ ECL Western Blotting Substrate (Product # 32106).

- Submitted by
- Invitrogen Antibodies (provider)
- Main image
- Experimental details
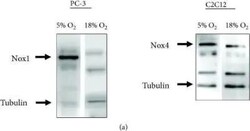
- Western blot analysis of beta Tubulin in PC-3 cells or Nox4 and Beta-tubulin in C2C12 cells. Samples were incubated in beta Tubulin polyclonal antibody (Product # PA1-16947). (a) Representative Western blots showing Nox1 and Beta-tubulin in PC-3 cells or Nox4 and Beta-tubulin in C2C12 cells, at 5% and 18% O2. (b, c) Average Nox1 signal.

- Submitted by
- Invitrogen Antibodies (provider)
- Main image
- Experimental details
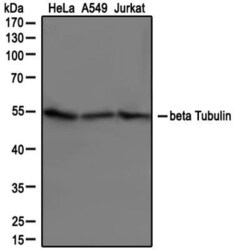
- Western blot analysis of beta Tubulin in HeLa, A549 and Jurkat cells. Samples were incubated in beta Tubulin polyclonal antibody (Product # PA1-16947) using a dilution of 1:1000.

- Submitted by
- Invitrogen Antibodies (provider)
- Main image
- Experimental details
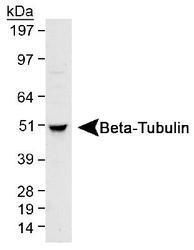
- Western blot analysis of beta Tubulin in HeLa whole cell lysate. Samples were incubated in beta Tubulin polyclonal antibody (Product # PA1-16947) using a dilution of 1:1,000.

- Submitted by
- Invitrogen Antibodies (provider)
- Main image

- Experimental details
- Western blot analysis of beta Tubulin in 0.5 mg/mL MCF-7 lysate. Samples were incubated in beta Tubulin polyclonal (Product # PA1-16947). This experiment was performed under reducing conditions using the 12-230 kDa separation system.

Supportive validation
- Submitted by
- Invitrogen Antibodies (provider)
- Main image
- Experimental details
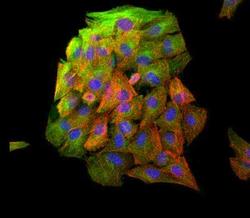
- Immunocytochemistry analysis of beta Tubulin in C2C12 cells. Samples were incubated in beta Tubulin polyclonal antibody (Product # PA1-16947) followed by Alexa Fluor 488-conjugated Goat to rabbit IgG secondary antibody (green). Actin filaments were labeled with Alexa Fluor 568 phalloidin (red). DAPI was used to stain the cell nuclei (blue).

- Submitted by
- Invitrogen Antibodies (provider)
- Main image

- Experimental details
- Immunofluorescence analysis of beta Tubulin was performed using 70% confluent log phase SH-SY5Y cells. The cells were fixed with 4% paraformaldehyde for 10 minutes, permeabilized with 0.1% Triton™ X-100 for 10 minutes, and blocked with 1% BSA for 1 hour at room temperature. The cells were labeled with Beta Tubulin Rabbit Polyclonal Antibody (Product # PA1-16947) at 2 µg/mL in 0.1% BSA and incubated for 3 hours at room temperature and then labeled with Goat anti-Rabbit IgG (H+L) Superclonal™ Secondary Antibody, Alexa Fluor® 488 conjugate (Product # A27034) at a dilution of 1:2000 for 45 minutes at room temperature (Panel a: green). Nuclei (Panel b: blue) were stained with SlowFade® Gold Antifade Mountant with DAPI (Product # S36938). F-actin (Panel c: red) was stained with Rhodamine Phalloidin (Product # R415, 1:300). Panel d represents the merged image showing cytoplasmic localization. Panel e shows the no primary antibody control. The images were captured at 60X magnification.

Supportive validation
- Submitted by
- Invitrogen Antibodies (provider)
- Main image

- Experimental details
- Immunohistochemical analysis of beta Tubulin in formalin-fixed paraffin-embedded tissue section of human esophageal squamous cell carcinoma (SCC). Samples were incubated in beta Tubulin polyclonal antibody (Product # PA1-16947) using a dilution of 1:2000. Strong cytoplasmic immuno-positivity of beta Tubulin (TUBB) was observed in SCC cells as well as the associated tumor stromal cells [10X Magnification].

- Submitted by
- Invitrogen Antibodies (provider)
- Main image

- Experimental details
- Immunohistochemical analysis of beta Tubulin in formalin-fixed paraffin-embedded tissue section of normal human skin. Samples were incubated in beta Tubulin polyclonal antibody (Product # PA1-16947) using a dilution of 1:2000. Intense cytoplasmic staining of beta Tubulin (TUBB) protein was observed in various cells of the epidermal as well as the dermal cells [10X Magnification].

- Submitted by
- Invitrogen Antibodies (provider)
- Main image

- Experimental details
- Immunohistochemical analysis of beta Tubulin in formalin-fixed paraffin-embedded tissue section of human esophageal squamous cell carcinoma (SCC). Samples were incubated in beta Tubulin polyclonal antibody (Product # PA1-16947) using a dilution of 1:2000. This representative image shows a cytoplasm specific staining of beta Tubulin (TUBB) in SCC cells [60X Magnification].

- Submitted by
- Invitrogen Antibodies (provider)
- Main image
- Experimental details
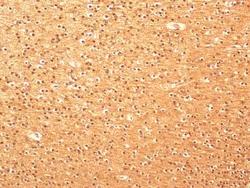
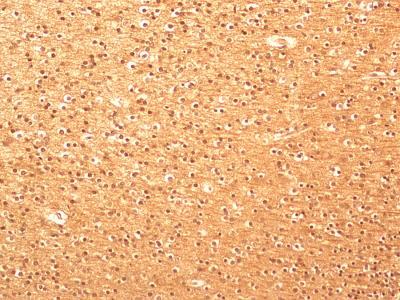
- Immunohistochemical analysis of beta Tubulin in formalin-fixed paraffin-embedded tissue section of normal human brain. Samples were incubated in beta Tubulin polyclonal antibody (Product # PA1-16947) using a dilution of 1:2000. The various brain cells depicted strong cytoplasmic immunoreactivity of beta Tubulin (TUBB) protein [10X Magnification].
Supportive validation
- Submitted by
- Invitrogen Antibodies (provider)
- Main image

- Experimental details
- NULL

- Submitted by
- Invitrogen Antibodies (provider)
- Main image

- Experimental details
- Fig 2 Effects of treatment with a honokiol analog on cell viability, expression of iNOS and COX-2, and production of NO in RAW 264.7 cells. (A) RAW 264.7 cells were incubated with each compound (20 muM or 40 muM) in the presence of serum for 24 h. Cell viability was determined by the MTT assay. (B)-(C) Cells were pretreated with 20 muM of compounds 1 h before LPS treatment (10 ng/mL) for 24 h. The protein level was measured by western blotting. The experiments were repeated at least three times and representative blots (B) and quantification data (C) are shown. beta-tubulin was used as a loading control. (D) Nitrite content. Nitrite levels were measured by spectrophotometric means with Griess reagent using supernatant media obtained from the cells in (B). HK, honokiol; GS, GS12021; c1-c9, arbitrary names for the synthetic honokiol analogs. Data are provided as mean +- SEM values. * P < 0.05, ** P < 0.01 versus CON; # P < 0.05, ## P < 0.01 versus LPS alone treatment.

- Submitted by
- Invitrogen Antibodies (provider)
- Main image

- Experimental details
- Fig 3 Anti-inflammatory effect of GS12021 in RAW 264.7 cells. (A) Concentration-dependent effect of GS12021 on expression of iNOS and COX-2. Representative western blot images and quantification data are shown. Cells were pretreated with the indicated concentrations of GS12021 1 h before LPS treatment (10 ng/mL) for 24 h. (B) Nitrite production in cells from (A). (C) mRNA expression of inflammatory genes/cytokines. Cells were treated with agents for 6 h and RT-qPCR was performed. (D) Cytokine levels in supernatant media from cells treated with LPS +- GS12021 for 6 h (TNFalpha) or 24 h (IL-6 and MCP-1). All the experiments were repeated at least three times and the data are provided as mean +- SEM values. ** P < 0.01 versus CON; # P < 0.05, ## P

- Submitted by
- Invitrogen Antibodies (provider)
- Main image

- Experimental details
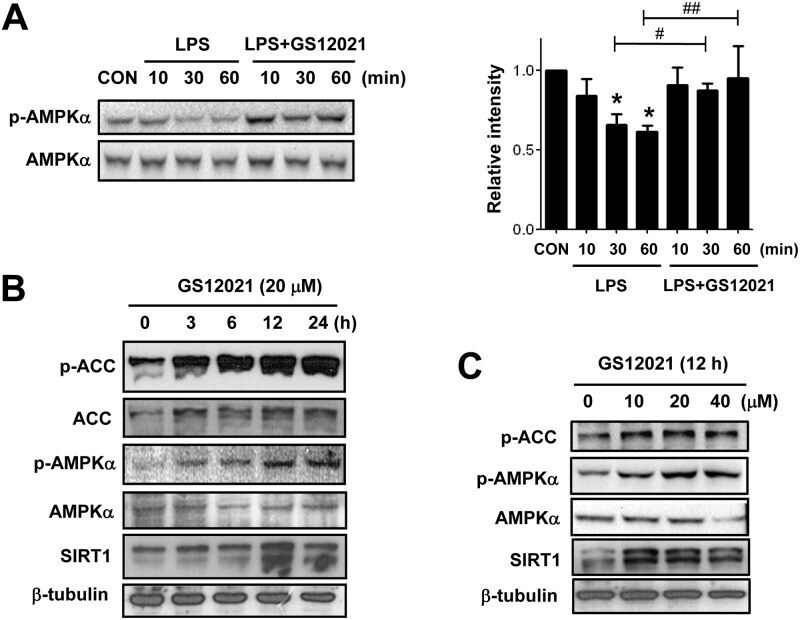
- Fig 6 Effect of GS12021 treatment on AMPKalpha activation and SIRT1 expression in RAW 264.7 cells. (A) Levels of phosphorylated AMPKalpha and total AMPKalpha were measured by western blotting. Cells were pretreated with vehicle or GS12021 (20 muM for 1 h) and stimulated with LPS for the time periods indicated. Quantification results are shown in the right panel. * P < 0.05 versus CON; # P < 0.05, ## P
- Submitted by
- Invitrogen Antibodies (provider)
- Main image
- Experimental details
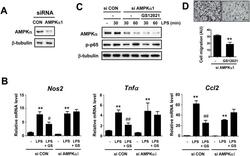
- Fig 7 Anti-inflammatory effect, but not anti-chemotaxis effect, of GS12021 was attenuated in AMPKalpha1 knockdown cells. RAW 264.7 cells were transfected with siRNA of control (CON) or AMPKalpha1 and incubated for 24 h. Cells were subsequently treated with LPS or GS12021+LPS and mRNA or protein levels were determined. (A) AMPKalpha expression after siRNA transfection. (B) mRNA levels of iNOS, TNFalpha, and MCP-1/CCL2 in AMPKalpha1 knockdown macrophages. ** P < 0.01 versus vehicle; # P < 0.05, ## P < 0.01 versus LPS alone. (C)-(D) The effect of AMPKalpha1 knockdown on the GS12021 suppression of p-p65 and the adipocyte CM-mediated macrophage chemotaxis. Representative microphotographs of cell migration are shown above the quantification results (N = 3). AU means arbitrary units. ** P < 0.01 versus vehicle.

- Submitted by
- Invitrogen Antibodies (provider)
- Main image

- Experimental details
- Fig 8 Anti-inflammatory effect of GS12021 was preserved in SIRT1 knockout (KO) macrophages. (A) SIRT1 expression in peritoneal macrophages obtained from wild-type (WT) or myeloid-specific SIRT1 KO mice. Peritoneal macrophages were isolated from WT or SIRT1 KO mice as described in the Materials and Methods section. (B) mRNA levels of inflammatory genes measured by RT-qPCR in macrophages from WT or SIRT1 KO mice. Cells were pretreated with GS12021 for 1 h, and then treated with LPS (10 ng/mL) for 6 h. ** P < 0.01 versus CON, # P

- Submitted by
- Invitrogen Antibodies (provider)
- Main image
- Experimental details
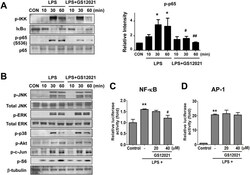
- Fig 5 Effect of GS12021 treatment on LPS-stimulated cell signaling in RAW 264.7 cells. Immunoblot analyses of phosphorylated IKK, IkappaBalpha and phosphorylated- and total-p65. The experiments were repeated at least three times, and the representative images and the densitometry results for phosphorylated p65 are shown in (A). Phosphorylations of JNK, ERK, p38 MAPK, Akt, c-Jun and S6 protein (B). Cells were pretreated with vehicle or GS12021 (20 muM for 1 h) and stimulated with LPS for the time periods indicated. (C) NF-kappaB reporter assay (N = 4). (D) AP-1 reporter assay (N = 4). RAW 264.7 cells were transfected with NF-kappaB or AP-1 luciferase reporter plasmid and, after 24 h, cells were incubated with GS12021 (20 muM or 40 muM) for a further 24 h. ** P < 0.01 versus CON; ## P < 0.05 versus LPS alone.

- Submitted by
- Invitrogen Antibodies (provider)
- Main image

- Experimental details
- Fig. 1 Inhibition of autophagy leads to cell death. a Autophagy levels of wild-type parasites were assessed post culture at a starting concentration of 10 6 cells mL -1 for the indicated number of days by staining the autophagic vacuoles with MDC (10 µM). Progressive increase in the number of vacuoles was observed as parasites entered the late log phase in culture. Scale bars represent 5 mum. b MDC staining was quantified by fluorometry and represented by the bar graph. Data represent mean +- SEM ( n = 3). c Western blot analysis was carried out to ascertain the day wise change in native Atg8 levels in wild-type parasites. beta-tubulin was used as control. Note the increase in Atg8 protein with time. d The effect of autophagy inhibition by 3-MA (5 mM) on parasite viability was assessed under normal culture conditions. In total, 10 6 parasites were sampled out from growing culture with or without 3-MA everyday (days 1-4). Note that blocking autophagy with 3-MA resulted in significant death of the parasites. Data represent mean +- SEM ( n = 3), * P < 0.05, ** P < 0.005. e Parasites were treated with H 2 O 2 (100 µM), PAT (250 uM), and CCCP (200 µM) for 6 h and stained with MDC. Starved parasites deprived of FCS were used as positive controls for autophagy induction. A separate set was treated with 3-MA to inhibit autophagy. Note significant MDC staining in treated and starved groups as compared with VT cells. Scale bars represent 5 mum. f Cell death assay afte
