Explore
 Validate
 Learn
Learn Western blot
 ELISA
ELISAAntibody data
- Antibody Data
- Antigen structure
- References [0]
- Comments [0]
- Validations
- Western blot [5]
- Immunocytochemistry [4]
- Immunohistochemistry [3]
- Flow cytometry [4]
- Other assay [30]
Submit
Validation data
Reference
Comment
Report error
- Product number
- MA5-15738-1MG - Provider product page

- Provider
- Invitrogen Antibodies
- Product name
- GAPDH Loading Control Monoclonal Antibody (GA1R)
- Antibody type
- Monoclonal
- Antigen
- Recombinant full-length protein
- Description
- This antibody detects GAPDH from BL-21 bacteria, Sf9 insect, Saccharomyces cerevisiae (yeast), human, mouse, rat, rabbit, hamster, and chicken samples. MA5-15738 has been successfully used in Western blot, ICC, IF, IHC (P), FACS and ELISA. MA5-15738 may be stored at 4ºC short term. Add 0.05% sodium azide if desired. For long term storage, store at -20ºC, avoiding freeze/thaw cycles.
- Reactivity
- Human, Mouse, Rat, Bacteria, Canine, Chicken/Avian, Hamster, Rabbit, Yeast
- Host
- Mouse
- Isotype
- IgG
- Antibody clone number
- GA1R
- Vial size
- 1 mg
- Concentration
- 1 mg/mL
- Storage
- Store at 4°C short term. For long term storage, store at -20°C, avoiding freeze/thaw cycles.
No comments: Submit comment
Supportive validation
- Submitted by
- Invitrogen Antibodies (provider)
- Main image

- Experimental details
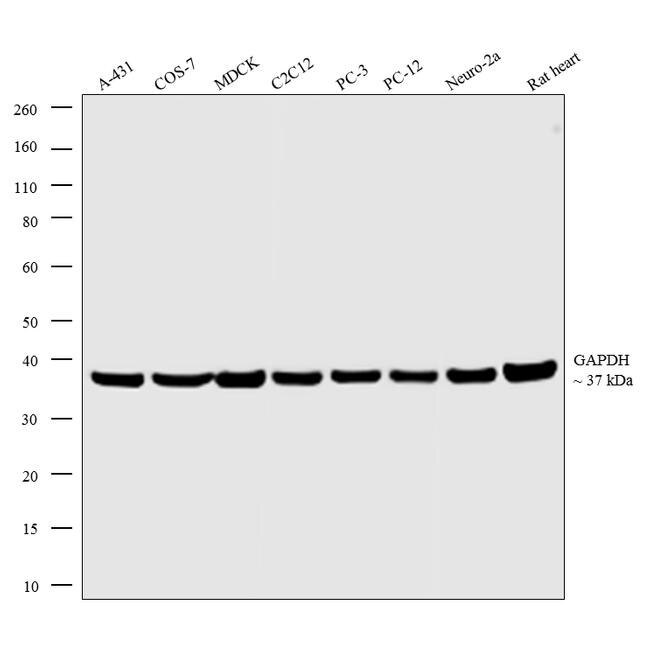
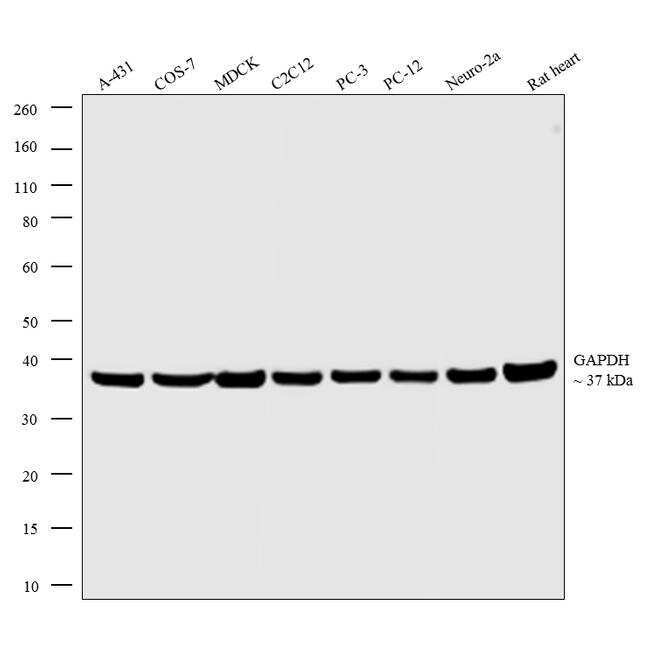
- Western blot analysis was performed on whole cell extracts (30µg lysate) of A-431 (Lane 1), COS-7 (Lane 2), MDCK (Lane 3), C2C12 (Lane 4), PC-3 (Lane 5), PC-12 (Lane 6), Neuro-2a (Lane 7) and tissue extract (30µg lysate) of Rat Heart (Lane 8). The blots were probed with Anti-GAPDH Mouse Monoclonal Antibody (Product # MA5-15738-1MG, 1:4000 dilution) and detected by chemiluminescence using Goat anti-Mouse IgG (H+L) Superclonal™ Secondary Antibody, HRP conjugate (Product # A28177, 0.25µg/mL, 1:4000 dilution). A 37 kDa band corresponding to GAPDH was observed across the cell lines and tissue tested. Known quantity of protein samples were electrophoresed using Novex® NuPAGE® 4-12 % Bis-Tris gel (Product # NP0321BOX), XCell SureLock™ Electrophoresis System (Product # EI0002) and Novex® Sharp Pre-Stained Protein Standard (Product # LC5800). Resolved proteins were then transferred onto a nitrocellulose membrane with iBlot® 2 Dry Blotting System (Product # IB21001). The membrane was probed with the relevant primary and secondary Antibody following blocking with 5 % skimmed milk. Chemiluminescent detection was performed using Pierce™ ECL Western Blotting Substrate (Product # 32106).
- Submitted by
- Invitrogen Antibodies (provider)
- Main image

- Experimental details
- Western blot analysis of GAPDH was performed by loading 20 µg of THP-1 whole cell lysates per well onto an SDS-PAGE gel. Proteins were transferred to a PVDF membrane and blocked with 5% milk in TBST. The membrane was probed with a GAPDH loading control monoclonal antibody (Product # MA5-15738) at a dilution of 1:5000 overnight at 4°C, washed in TBST, and probed with a HRP-conjugated goat anti-mouse IgG at a dilution of 1:40,000 for 1 hr at room temperature. Detection was performed using ECL substrate. Data courtesy of the Innovators Program.
- Submitted by
- Invitrogen Antibodies (provider)
- Main image

- Experimental details
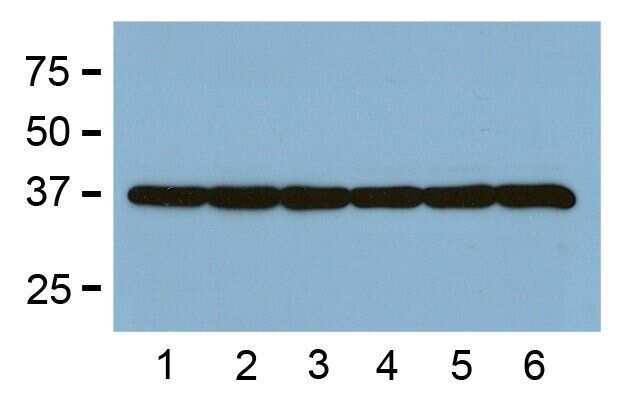
- 1:2000 (0.5 µg/mL) Ab dilution used in WB of 5 µg/lane tissue lysates from human (1), mouse (2), rat (3), rabbit (4), chicken (5), and hamster (6).
- Submitted by
- Invitrogen Antibodies (provider)
- Main image

- Experimental details
- WB from BL-21 bacteria (1), Sf9 insect (2), and Saccharomyces cerevisiae (3)

- Submitted by
- Invitrogen Antibodies (provider)
- Main image

- Experimental details
- Western blot analysis was performed on whole cell extracts (30µg lysate) of A-431 (Lane 1), COS-7 (Lane 2), MDCK (Lane 3), C2C12 (Lane 4), PC-3 (Lane 5), PC-12 (Lane 6), Neuro-2a (Lane 7) and tissue extract (30µg lysate) of Rat Heart (Lane 8). The blots were probed with Anti-GAPDH Mouse Monoclonal Antibody (Product # MA5-15738-1MG, 1:4000 dilution) and detected by chemiluminescence using Goat anti-Mouse IgG (H+L) Superclonal™ Secondary Antibody, HRP conjugate (Product # A28177, 0.25µg/mL, 1:4000 dilution). A 37 kDa band corresponding to GAPDH was observed across the cell lines and tissue tested. Known quantity of protein samples were electrophoresed using Novex® NuPAGE® 4-12 % Bis-Tris gel (Product # NP0321BOX), XCell SureLock™ Electrophoresis System (Product # EI0002) and Novex® Sharp Pre-Stained Protein Standard (Product # LC5800). Resolved proteins were then transferred onto a nitrocellulose membrane with iBlot® 2 Dry Blotting System (Product # IB21001). The membrane was probed with the relevant primary and secondary Antibody following blocking with 5 % skimmed milk. Chemiluminescent detection was performed using Pierce™ ECL Western Blotting Substrate (Product # 32106).
Supportive validation
- Submitted by
- Invitrogen Antibodies (provider)
- Main image
- Experimental details
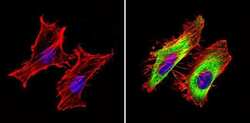
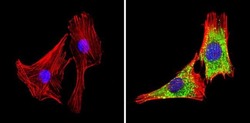
- Immunofluorescent analysis of GAPDH (green) showing staining in the in the cytoplasm of Hela cells (right) compared to a negative control without primary antibody (left). Formalin-fixed cells were permeabilized with 0.1% Triton X-100 in TBS for 5-10 minutes and blocked with 3% BSA-PBS for 30 minutes at room temperature. Cells were probed with a GAPDH loading control antibody (Product # MA5-15738) in 3% BSA-PBS at a dilution of 1:100 and incubated overnight at 4ºC in a humidified chamber. Cells were washed with PBST and incubated with a DyLight-conjugated secondary antibody in PBS at room temperature in the dark. F-actin (red) was stained with a fluorescent red phalloidin and nuclei (blue) were stained with Hoechst or DAPI. Images were taken at a magnification of 60x.
- Submitted by
- Invitrogen Antibodies (provider)
- Main image
- Experimental details
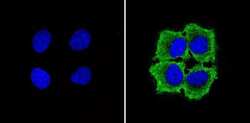
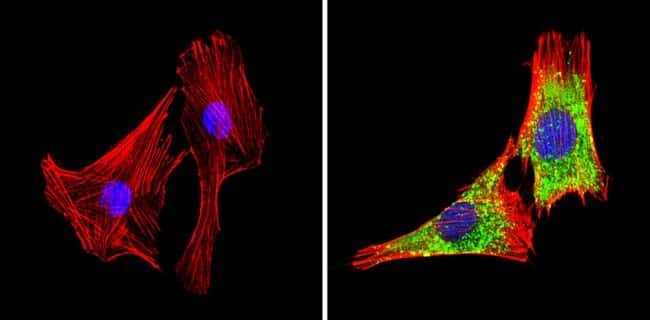
- Immunofluorescent analysis of GAPDH (green) showing staining in the in the cytoplasm of MCF-7 cells (right) compared to a negative control without primary antibody (left). Formalin-fixed cells were permeabilized with 0.1% Triton X-100 in TBS for 5-10 minutes and blocked with 3% BSA-PBS for 30 minutes at room temperature. Cells were probed with a GAPDH loading control antibody (Product # MA5-15738) in 3% BSA-PBS at a dilution of 1:100 and incubated overnight at 4ºC in a humidified chamber. Cells were washed with PBST and incubated with a DyLight-conjugated secondary antibody in PBS at room temperature in the dark. Nuclei (blue) were stained with Hoechst or DAPI. Images were taken at a magnification of 60x.

- Submitted by
- Invitrogen Antibodies (provider)
- Main image
- Experimental details
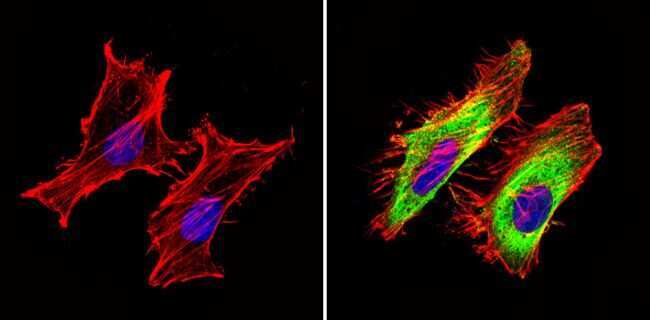
- Immunofluorescent analysis of GAPDH (green) showing staining in the in the cytoplasm of C2C12 cells (right) compared to a negative control without primary antibody (left). Formalin-fixed cells were permeabilized with 0.1% Triton X-100 in TBS for 5-10 minutes and blocked with 3% BSA-PBS for 30 minutes at room temperature. Cells were probed with a GAPDH loading control antibody (Product # MA5-15738) in 3% BSA-PBS at a dilution of 1:100 and incubated overnight at 4ºC in a humidified chamber. Cells were washed with PBST and incubated with a DyLight-conjugated secondary antibody in PBS at room temperature in the dark. F-actin (red) was stained with a fluorescent red phalloidin and nuclei (blue) were stained with Hoechst or DAPI. Images were taken at a magnification of 60x.
- Submitted by
- Invitrogen Antibodies (provider)
- Main image
- Experimental details
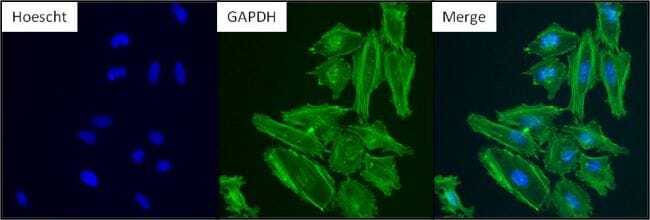
- Immunofluorescent analysis of GAPDH (green) in HeLa. Formalin-fixed cells were permeabilized with 0.1% Triton X-100 in TBS for 10 minutes at room temperature and blocked with 5% normal goat serum (Product # 31873) for 15 minutes at room temperature. Cells were probed with a GAPDH monoclonal antibody (Product # MA5-15738) at a dilution of 1:100 for at least 1 hour at room temperature, washed with PBS, and incubated with DyLight 488 goat anti-mouse IgG secondary antibody (Product # 35502) at a dilution of 1:400 for 30 minutes at room temperature. Nuclei (blue) were stained with Hoechst 33342 dye (Product # 62249). Images were taken on a Thermo Scientific ArrayScan or ToxInsight Instrument at 20X magnification.
Supportive validation
- Submitted by
- Invitrogen Antibodies (provider)
- Main image
- Experimental details
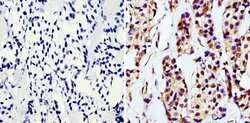
- Immunohistochemistry analysis of GAPDH showing staining in the nucleus and cytoplasm of paraffin-embedded human breast carcinoma (right) compared with a negative control without primary antibody (left). To expose target proteins, antigen retrieval was performed using 10mM sodium citrate (pH 6.0), microwaved for 8-15 min. Following antigen retrieval, tissues were blocked in 3% H2O2-methanol for 15 min at room temperature, washed with ddH2O and PBS, and then probed with a GAPDH monoclonal antibody (Product # MA5-15738) diluted in 3% BSA-PBS at a dilution of 1:200 overnight at 4°C in a humidified chamber. Tissues were washed extensively in PBST and detection was performed using an HRP-conjugated secondary antibody followed by colorimetric detection using a DAB kit. Tissues were counterstained with hematoxylin and dehydrated with ethanol and xylene to prep for mounting.

- Submitted by
- Invitrogen Antibodies (provider)
- Main image
- Experimental details
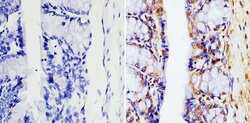
- Immunohistochemistry analysis of GAPDH showing staining in the nucleus and cytoplasm of paraffin-embedded mouse colon tissue (right) compared with a negative control without primary antibody (left). To expose target proteins, antigen retrieval was performed using 10mM sodium citrate (pH 6.0), microwaved for 8-15 min. Following antigen retrieval, tissues were blocked in 3% H2O2-methanol for 15 min at room temperature, washed with ddH2O and PBS, and then probed with a GAPDH monoclonal antibody (Product # MA5-15738) diluted in 3% BSA-PBS at a dilution of 1:100 overnight at 4°C in a humidified chamber. Tissues were washed extensively in PBST and detection was performed using an HRP-conjugated secondary antibody followed by colorimetric detection using a DAB kit. Tissues were counterstained with hematoxylin and dehydrated with ethanol and xylene to prep for mounting.

- Submitted by
- Invitrogen Antibodies (provider)
- Main image

- Experimental details
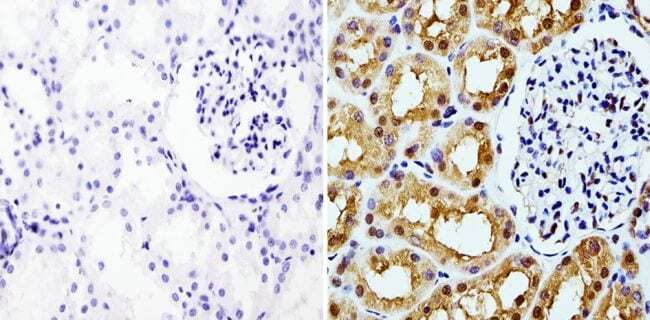
- Immunohistochemistry analysis of GAPDH showing staining in the nucleus and cytoplasm of paraffin-embedded human kidney tissue (right) compared with a negative control without primary antibody (left). To expose target proteins, antigen retrieval was performed using 10mM sodium citrate (pH 6.0), microwaved for 8-15 min. Following antigen retrieval, tissues were blocked in 3% H2O2-methanol for 15 min at room temperature, washed with ddH2O and PBS, and then probed with a GAPDH monoclonal antibody (Product # MA5-15738) diluted in 3% BSA-PBS at a dilution of 1:100 overnight at 4°C in a humidified chamber. Tissues were washed extensively in PBST and detection was performed using an HRP-conjugated secondary antibody followed by colorimetric detection using a DAB kit. Tissues were counterstained with hematoxylin and dehydrated with ethanol and xylene to prep for mounting.
Supportive validation
- Submitted by
- Invitrogen Antibodies (provider)
- Main image

- Experimental details
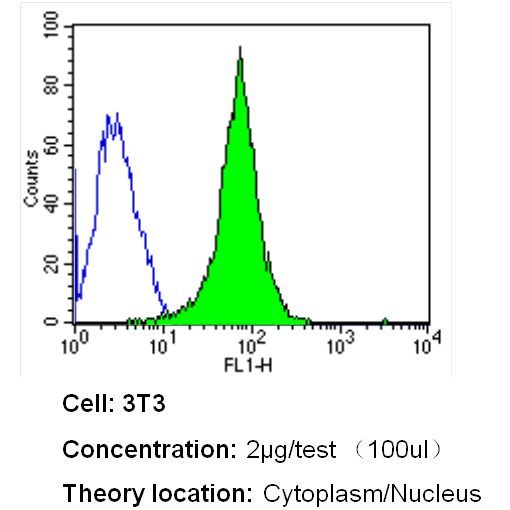
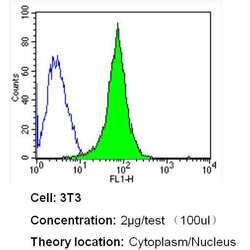
- Flow cytometry analysis of GAPDH in NIH-3T3 cells (green) compared to an isotype control (blue). Cells were harvested, adjusted to a concentration of 1-5x10^6 cells/mL, fixed with 2% paraformaldehyde and washed with PBS. Cells were blocked with a 2% solution of BSA-PBS for 30 min at room temperature and incubated with a GAPDH loading control antibody (Product # MA5-15738) at a dilution of 2 µg/test for 40 min at room temperature. Cells were then incubated for 40 min at room temperature in the dark using a Dylight 488-conjugated secondary antibody and re-suspended in PBS for FACS analysis.
- Submitted by
- Invitrogen Antibodies (provider)
- Main image
- Experimental details
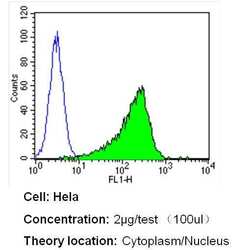
- Flow cytometry analysis of GAPDH in Hela cells (green) compared to an isotype control (blue). Cells were harvested, adjusted to a concentration of 1-5x10^6 cells/mL, fixed with 2% paraformaldehyde and washed with PBS. Cells were blocked with a 2% solution of BSA-PBS for 30 min at room temperature and incubated with a GAPDH loading control antibody (Product # MA5-15738) at a dilution of 2 µg/test for 40 min at room temperature. Cells were then incubated for 40 min at room temperature in the dark using a Dylight 488-conjugated secondary antibody and re-suspended in PBS for FACS analysis.

- Submitted by
- Invitrogen Antibodies (provider)
- Main image
- Experimental details
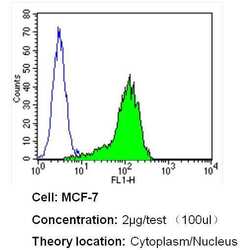
- Flow cytometry analysis of GAPDH in MCF-7 cells (green) compared to an isotype control (blue). Cells were harvested, adjusted to a concentration of 1-5x10^6 cells/mL, fixed with 2% paraformaldehyde and washed with PBS. Cells were blocked with a 2% solution of BSA-PBS for 30 min at room temperature and incubated with a GAPDH loading control antibody (Product # MA5-15738) at a dilution of 2 µg/test for 40 min at room temperature. Cells were then incubated for 40 min at room temperature in the dark using a Dylight 488-conjugated secondary antibody and re-suspended in PBS for FACS analysis.

- Submitted by
- Invitrogen Antibodies (provider)
- Main image
- Experimental details
- Flow cytometry analysis of GAPDH in NIH-3T3 cells (green) compared to an isotype control (blue). Cells were harvested, adjusted to a concentration of 1-5x10^6 cells/mL, fixed with 2% paraformaldehyde and washed with PBS. Cells were blocked with a 2% solution of BSA-PBS for 30 min at room temperature and incubated with a GAPDH loading control antibody (Product # MA5-15738) at a dilution of 2 µg/test for 40 min at room temperature. Cells were then incubated for 40 min at room temperature in the dark using a Dylight 488-conjugated secondary antibody and re-suspended in PBS for FACS analysis.

Supportive validation
- Submitted by
- Invitrogen Antibodies (provider)
- Main image
- Experimental details
- NULL
- Submitted by
- Invitrogen Antibodies (provider)
- Main image
- Experimental details
- NULL
- Submitted by
- Invitrogen Antibodies (provider)
- Main image
- Experimental details
- NULL

- Submitted by
- Invitrogen Antibodies (provider)
- Main image
- Experimental details
- NULL
- Submitted by
- Invitrogen Antibodies (provider)
- Main image

- Experimental details
- NULL
- Submitted by
- Invitrogen Antibodies (provider)
- Main image

- Experimental details
- NULL
- Submitted by
- Invitrogen Antibodies (provider)
- Main image
- Experimental details
- NULL
- Submitted by
- Invitrogen Antibodies (provider)
- Main image
- Experimental details
- NULL

- Submitted by
- Invitrogen Antibodies (provider)
- Main image
- Experimental details
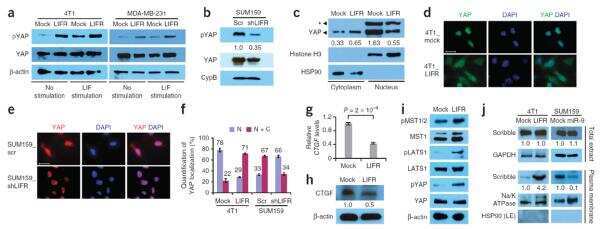
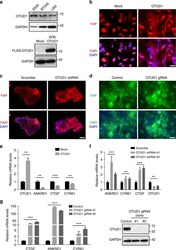
- Fig. 5 OTUD1 inhibits nuclear localization and transcriptional activity of YAP. a Upper panel: immunoblotting of OTUD1 and GAPDH in HEK293A, BT549, and LM2 cell lines. Lower panel: immunoblotting of FLAG-OTUD1 and GAPDH in LM2 cells stably transfected with SFB-OTUD1. b LM2 cells stably overexpressing OTUD1 were immunostained with a YAP-specific antibody (red). DAPI (blue) was used to stain DNA. Scale bar, 20 mum. c , d HEK293A cells expressing OTUD1 shRNA ( c ) or gRNA ( d ) were immunostained with a YAP-specific antibody (red in c ; green in d ). DAPI (blue) was used to stain DNA. Scale bar, 20 mum. e - g qPCR of ANKRD1 , CTGF , and CYR61 in BT549 cells expressing HA-OTUD1 ( e ) and in HEK293A cells expressing OTUD1 shRNA ( f ) or OTUD1 gRNA ( g , left panel). Right panel in g : immunoblotting of OTUD1 and GAPDH in two independent OTUD1 knockout HEK293A clones generated by CRISPR-Cas9. n = 3 biological replicates. Error bars in e - g are s.e.m. Statistical significance was determined by a two-tailed, unpaired Student's t -test. * P < 0.05; ** P < 0.01; *** P < 0.001

- Submitted by
- Invitrogen Antibodies (provider)
- Main image
- Experimental details
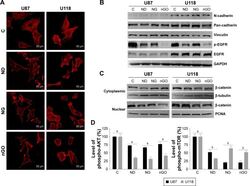
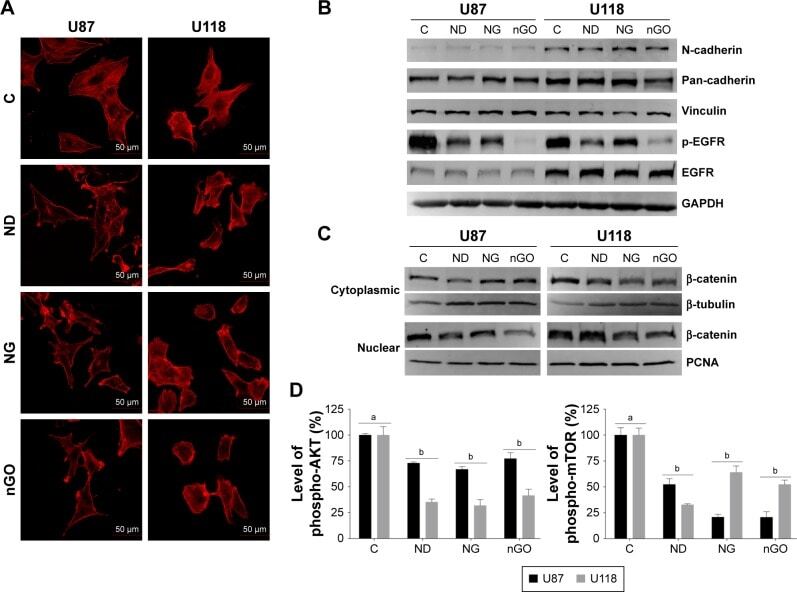
- Figure 5 EGFR/AKT/mTOR and beta-catenin signaling in glioblastoma cells after treated with nanoparticles. Notes: ( A ) Confocal microscope images of U87 and U118 cells actin cytoskeleton. Cells were grown on extracellular matrix for 24 h and treated with diamond nanoparticles, graphite nanoparticles, or graphene oxide nanoparticles at a concentration of 20 mug/mL and incubated for 24 h. F-Actin was stained with phalloidin conjugated with Atto 633. ( B ) Western blot analysis of N-cadherin, pan-cadherin, vinculin, p-EGFR, and EGFR. GAPDH was used as a loading control. ( C ) Western blot analysis of nuclear and cytoplasmic protein fractions used for determination of beta-catenin protein level. PCNA and beta-tubulin were used as loading controls for nuclear and cytoplasmic fractions, respectively. ( D ) ELISA analysis of AKT and mTOR phosphorylation in comparison to control. Treatment with nanoparticles significantly reduced phospho-AKT ( P
- Submitted by
- Invitrogen Antibodies (provider)
- Main image
- Experimental details
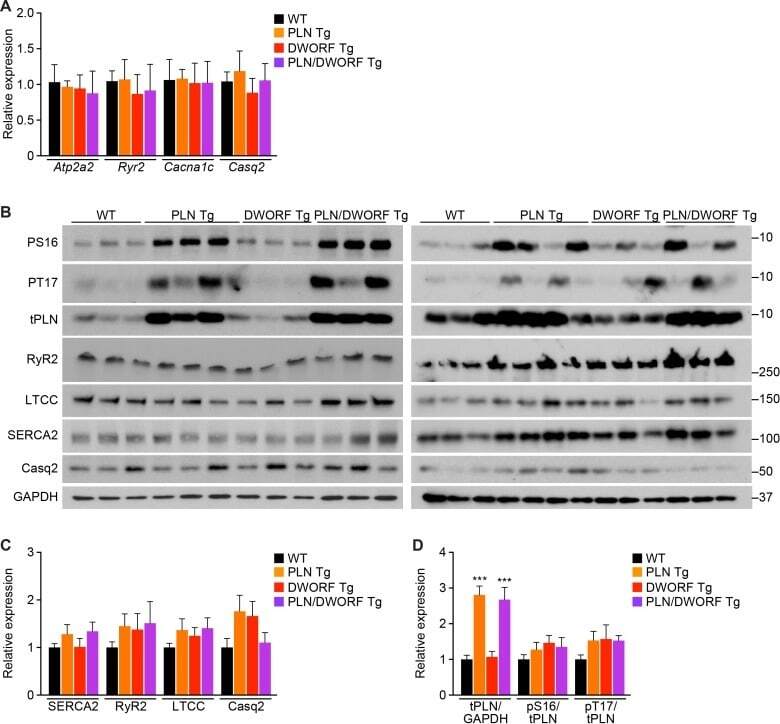
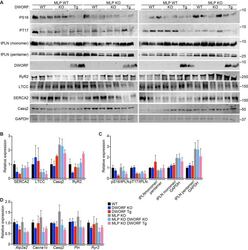
- Figure 2--figure supplement 2. Analysis of RNA and protein expression levels of the major cardiac Ca 2+ -handling proteins in PLN/DWORF Tg mice. ( A ) RNA levels of the indicated genes as quantified by qRT-PCR in 16-week-old heart tissue. Atp2a2 , SERCA2a; Ryr2 , ryanodine receptor 2; Cacna1c, alpha1C-subunit of the L-type Ca 2+ channel; Casq2 , calsequestrin 2. Data are normalized to 18S and presented as expression level relative to WT, mean +-SD for n = 10 mice per genotype. ( B ) Representative immunoblots of cardiac homogenates from mice with the indicated genotypes. PS16, phospho-serine 16 on PLN; PT17, phospho-threonine 17 on PLN; tPLN, total phospholamban; RyR2, ryanodine receptor 2; LTCC, L-type Ca 2+ channel (alpha1C-subunit); Casq2, calsequestrin 2; GAPDH, glyceraldehyde 3-phosphate dehydrogenase. ( C ) Western blots for n = 9-10 mice of each genotype were quantified using ImageJ and data are normalized to GAPDH and expressed as mean +-SD relative to WT. ( D ) Quantification of total phospholamban and its phosphorylation status as assessed by western blot ( B ) and expressed as relative to WT. Western blots were quantified with ImageJ software. Phosphorylation blots (PS16 and PT17) were normalized to total PLN (tPLN). Total PLN was normalized to GAPDH. Data are expressed as mean +-SD for n = 9-10 mice per genotype. Statistical comparisons between groups were evaluated by Student's t-test. p-value *p
- Submitted by
- Invitrogen Antibodies (provider)
- Main image
- Experimental details
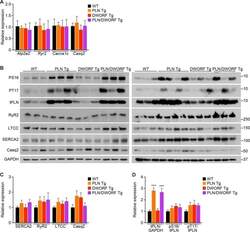
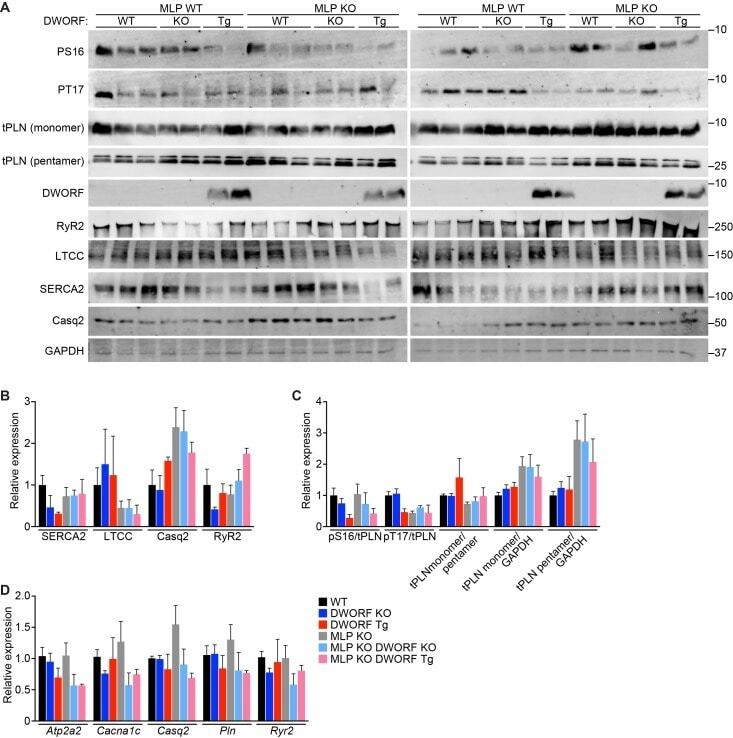
- Figure 6--figure supplement 1. Expression and post-translational modifications of Ca 2+ -handling proteins. ( A ) Immunoblots of cardiac homogenates from mice with the indicated genotypes. ( B ) Immunoblots were quantified using ImageJ and normalized to GAPDH. LTCC, L-type Ca 2+ channel (alpha1C-subunit); Casq2, calsequestrin 2; RyR2, ryanodine receptor 2; GAPDH, glyceraldehyde 3-phosphate dehydrogenase. ( C ) Quantification of the phosphorylation status and oligomerization of phospholamban as assessed by western blot (panel A ) and expressed as relative to WT. Western blots were quantified with ImageJ software. Phosphorylation blots (PS16 and PT17) were normalized to total PLN (tPLN). Total PLN was normalized to GAPDH. tPLN, total phospholamban; PS16, phospho-serine 16 on PLN; PT17, phospho-threonine 17 on PLN. Data are expressed as mean +-SD for n = 4-6 mice per genotype. ( D ) RNA levels of the indicated genes as quantified by qRT-PCR in 8-week-old heart tissue. Atp2a2 , SERCA2a; Cacna1c, alpha1C-subunit of the L-type Ca 2+ channel; Casq2 , calsequestrin 2; Pln , phosholamban; Ryr2 , ryanodine receptor 2. Data are normalized to 18S values and presented as expression level relative to WT, mean +-SD for n = 4-5 mice per genotype.
- Submitted by
- Invitrogen Antibodies (provider)
- Main image
- Experimental details
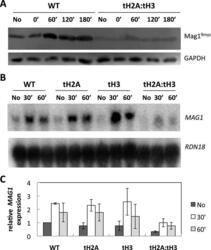
- Figure 3. Mag1 protein expression and MAG1 mRNA expression are reduced in tH2A:tH3 cells. WT and the N-tail deletion mutants were treated with 0.2% MMS for 10 min and further analyzed at the indicated time points. ( A ) Mag1 9myc and GAPDH were detected via western blotting. ( B ) A northern blot detecting MAG1 and reprobed for RDN18 . [We note that the small band shift between the tH3(60') sample and the tH2A:tH3 samples is due to a gel running artifact]. ( C ) Quantification of different gels, such as shown in (B) by normalizing MAG1 levels to that of WT in the absence of MMS. Error bars indicate standard deviations derived from three independent experiments.

- Submitted by
- Invitrogen Antibodies (provider)
- Main image
- Experimental details
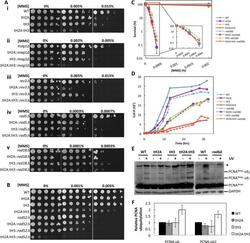
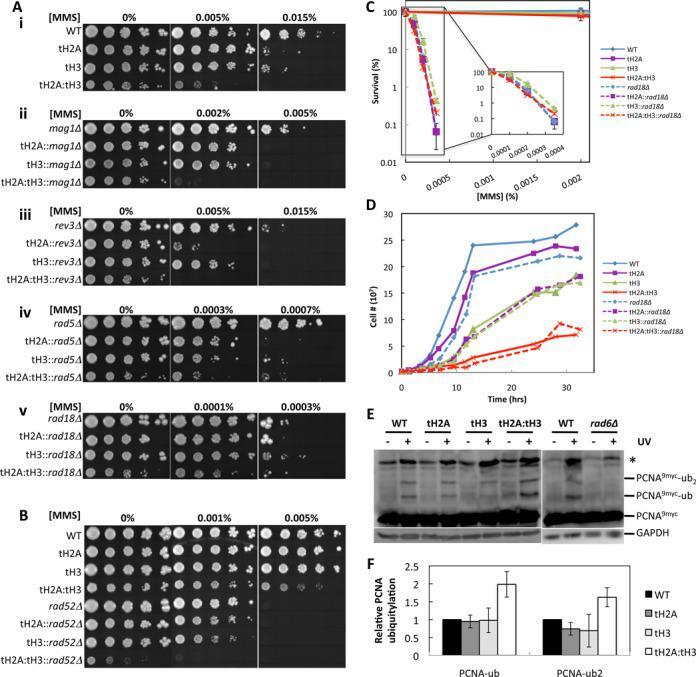
- Figure 6. The N-tails of H2A and H3 are epistatic to RAD18 . ( A ) Epistasis studies of (i) N-tail deletion mutants combinatorially deleted for (ii) MAG1 , (iii) REV3 , (iv) RAD5 and (v) RAD18 . ( B ) Epistasis study of N-tail deletion mutants combinatorially deleted for RAD52 . ( C ) MMS survival assay of WT and N-tail mutants (solid lines) and the N-tail mutants combinatorially deleted for RAD18 (dashed lines). ( D ) Growth curves of the cells in ( C ) in the absence of MMS. ( E ) Western blot of PCNA 9myc in WT and N-tail mutants before UV exposure and after a 1 h recovery in YPD following 100 J/m 2 of UV irradiation. GAPDH is used as the loading control. rad6Delta serves as a negative control for PCNA ubiquitylation. ( F ) Quantifications of (E) by normalizing (PCNA 9myc -ub)/(PCNA 9myc -total) and (PCNA 9myc -ub 2 )/(PCNA 9myc -total) to WT. Error bars indicate standard deviations from three independent experiments.
- Submitted by
- Invitrogen Antibodies (provider)
- Main image
- Experimental details
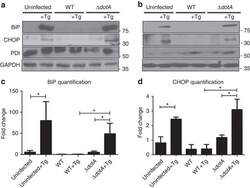
- Figure 1 Expression of two critical components of the UPR, BiP and CHOP are blocked by L. pneumophila ( a ) Caspase 1/11 (-/-) bone marrow derived macrophages or ( b ) HEK-293 FCgamma cells-expressing Fc gamma (HEK-293 FCgamma) were either left uninfected or infected with WT or DeltadotA strains of L. pneumophila at an MOI of 150. Cells were then left untreated or treated with thapsigargin (Tg; 1 mug mul -1 ) for 6 h. BiP, CHOP and PDI protein expression were monitored via immunoblot. GAPDH was used as a loading control. Full blots are provided for Fig. 1a,b in Supplementary Fig. 5 . ( c , d ) BiP and CHOP levels were quantified respectively from three biological replicates using the same experimental conditions in HEK-293 FCgamma cells. Data are depicted as the fold change normalized to uninfected levels. Data represent three independent experiments. Values in all graphs are means+-s.e.m. * P
- Submitted by
- Invitrogen Antibodies (provider)
- Main image
- Experimental details
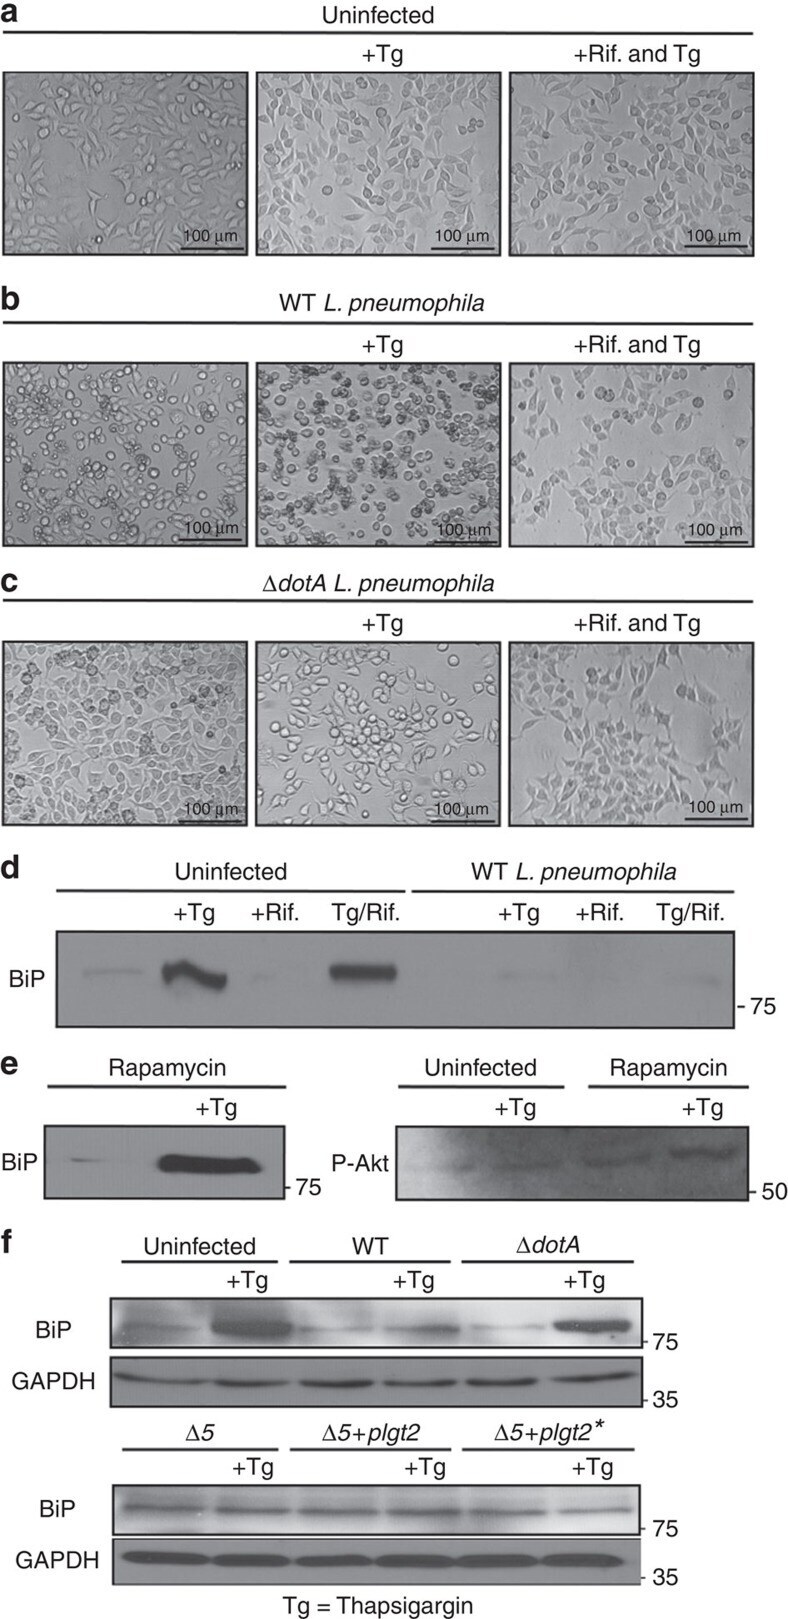
- Figure 3 Suppression of ER stress is an effector driven process that is independent of the mTOR pathway. ( a - c ) HEK-293 FCgamma cells were either left uninfected or infected with WT L. pneumophila or DeltadotA L. pneumophila at an MOI of 150. Cells were then either left untreated or treated with thapsigargin (Tg; 1 mug mul -1 ) or treated with a combination of Tg and the antibiotic Rifampicin (Rif.; 2 mug mul -1 ) for 6 h. After 6 h phase contrast images were taken. ( d ) HEK-293 FCgamma cells were infected at an MOI of 150 with WT L. pneumophila , or left uninfected. Cells were then treated with Rif. alone (2 mug mul -1 ), Rif. with Tg (1 mug mul -1 ), Tg (1 mug mul -1 ) alone or left untreated for 6 h. BiP protein levels were monitored via immunoblot. ( e ) HEK-293 FCgamma cells were untreated or treated with rapamycin (10 nM) or rapamycin with Tg (1 mug mul -1 ) for 6 h. BiP protein levels were then monitored via immunoblot and levels of phosphorylated Akt at serine 473 (P-Akt) were monitored from these lysates via immunoblot. ( f ) RAW 264.7 cells were infected with WT L. pneumophila, dotA , or Delta 5 strains of L. pneumophila at an MOI of 150. BiP protein expression was monitored via immunoblot. GAPDH was used as a loading control. Full blots for Fig. 3d-f are provided in Supplementary Fig. 5 .
- Submitted by
- Invitrogen Antibodies (provider)
- Main image
- Experimental details
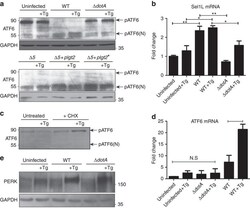
- Figure 6 ATF6 is processed during L. pneumophila infection. ( a ) RAW 264.7 cells were left uninfected or infected with either WT L. pneumophila , DeltadotA , B. Delta5, Delta5+plgt2, or Delta5 plgt2* (catalytically dead lgt2) at an MOI of 150. Cells were then left untreated or treated with thapsigargin (Tg; 1 mug mul -1 ) for 6 h. Full-length ATF6 (pATF6) and cleaved pATF6(N) were monitored via immunoblot. Full blots for Fig. 6a are provided in Supplementary Fig. 5 . ( b ) HEK-293 FCgamma cells infected with either WT L. pneumophila or DeltadotA and then treated for 6 h with Tg (1 mug mul -1 ). Sel1L mRNA levels were then monitored via qRT-PCR, with GAPDH serving as an endogenous control. Two biological replicates were used each with three technical replicates using the identical experimental conditions. Values in all graphs are means+-s.e.m. * P
- Submitted by
- Invitrogen Antibodies (provider)
- Main image
- Experimental details
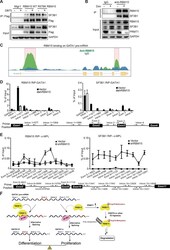
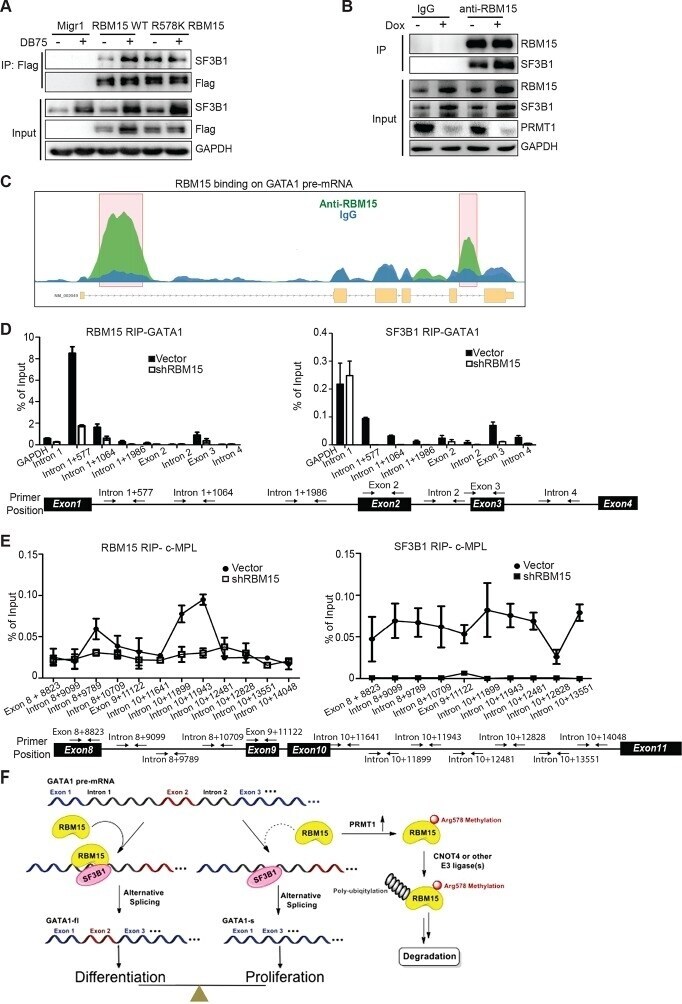
- Figure 7. RBM15 directly recruits the intron-binding splicing factor, SF3B1, for alternative RNA splicing. ( A ) The interaction between SF3B1 and RBM15 in the context of PRMT1-mediated methylation. RBM15-Flag and RBM15 R578K-Flag expressed from two MEG-01 cell lines with or without DB75 treatment were immunoprecipitated with anti-Flag antibody for detecting interaction with SF3B1 by WB. ( B ) The endogenous SF3B1 was co-immunopreciptiated with anti-RBM15 antibody in MEG-01 cells expressing inducible shPRMT1. Normal mouse serum was used as a negative control. ( C ) RBM15 binding profile on GATA1 pre-mRNA based on RIP-seq data. The green peaks are the binding sites for RBM15 and the blue profile is the binding profile for normal IgG. Two biological replicates were used for bioinformatic analysis. The significant peaks were shaded with pink squares. ( D ) The regions where RBM15 (RIP with RBM15 antibody, left panel) and SF3B1 (RIP with SF3B1 antibody right panel) bound on GATA1 pre-mRNA in MEG-01 cells (solid bar) and RBM15 knockdown MEG-01 cells (open bar) were mapped by real-time PCR assays. The locations of primers on the pre-mRNA of GATA1 were shown on the bottom. Three biological replicates were used to calculate the standard deviations. GAPDH intron 1 was used as negative controls for both antibodies. ( E ) The regions on c-MPL pre-mRNA, where RBM15 and SF3B1 bound in MEG-01 cell lines expressing shRBM15 (square line) or expressing pLKO vector (solid dot line), were asses
- Submitted by
- Invitrogen Antibodies (provider)
- Main image

- Experimental details
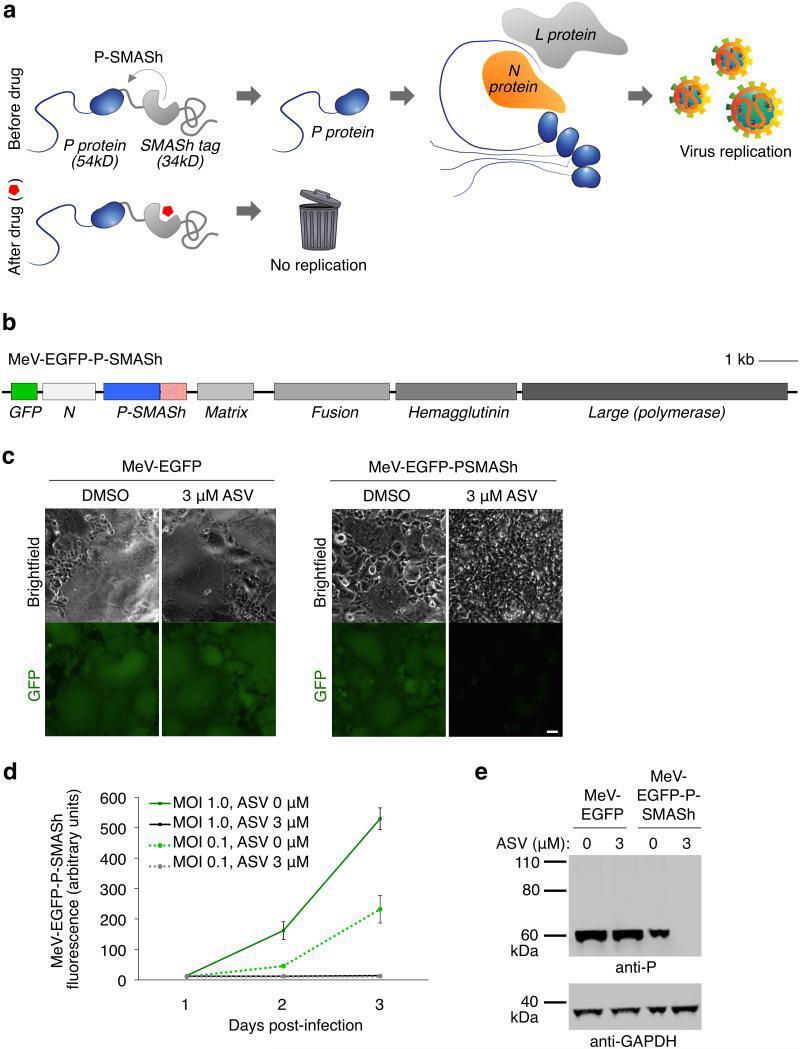
- Figure 6 Generation of a drug-controllable ""SMAShable"" measles vaccine virus. (a) Concept of controlling MeV replication with P-SMASh. In the absence of the drug, essentially unmodified phosphoprotein (P, blue) is released and can successfully form replication complexes with nucleocapsid (N, orange) and large (L) proteins. (b) Genome organization of MeV-EGFP-P-SMASh. Scale bar is 1 kilobase. (c) Regulation of MeV-EGFP-P-SMASh by drug. Vero cells infected with MeV-EGFP or MeV-EGFP-P-SMASh at multiplicity of infection (MOI) of 1 were grown for 72 h in the absence or presence of ASV. Drug inhibited syncytium formation and GFP expression in MeV-EGFP-P-SMASh-infected but not MeV-EGFP-infected cells. Scale bar, 50 mum. (d) Quantification of fluorescence from Vero cells infected with MeV-EGFP-P-SMASh at MOI 1 and 0.1 in the absence or presence of 3 muM ASV ( n = 3, error bars are standard deviation). (e) Drug inhibited P expression in MeV-EGFP-P-SMASh-infected but not MeV-EGFP-infected cells, as assayed by immunoblotting. GAPDH served as a loading control.
- Submitted by
- Invitrogen Antibodies (provider)
- Main image
- Experimental details
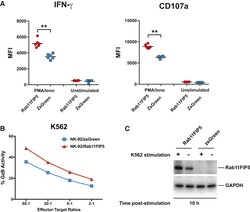
- Figure 7 Overexpression of Rab11Fip5 in NK-92 Cells Increases Cytokine and Granzyme Release (A) Effect of Rab11Fip5 overexpression on IFN-gamma production and degranulation (CD107a expression) of NK-92 cells in response to stimulation with PMA/ionomycin. NK-92/Rab11Fip5 (red symbols) and NK-92/ZsGreen cells (blue symbols) were stimulated with 500 ng/mL PMA and 5 mug/mL ionomycin for 2 hr in the presence of a CD107a antibody and the protein transport inhibitor monensin. Dots represent MFIs from 6 replicate wells. Significance determined by Wilcoxon-Mann-Whitney (ns, not significant; ** p < 0.01). (B) Granzyme B (GzB)-based cytotoxicity assays performed using NK-92/Rab11Fip5 (red) or NK-92/ZsGreen control (blue) cells as effectors and K562 cells as targets at different effector:target ratios. The percentage of cells positive for proteolytically active GzB is represented as % GzB activity. The average values from 3 independent experiments performed in triplicate are shown. (C) Western blot of Rab11Fip5 expression in NK-92 cells transduced with a RAB11FIP5 expression vector or zsGreen vector control, in the presence or absence of K562 target cell stimulation (5:1 effector:target ratio). Cells were analyzed at 10 hr post stimulation. GAPDH used as protein loading control. See also Figure S7 .
- Submitted by
- Invitrogen Antibodies (provider)
- Main image
- Experimental details
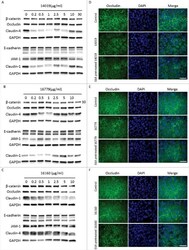
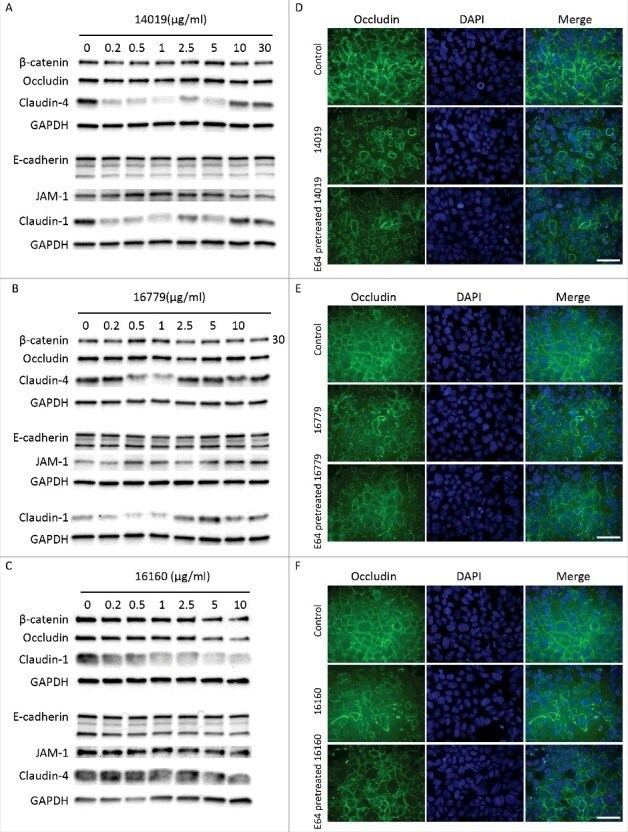
- Figure 5. G. intestinalis secreted cysteine proteases have effects on epithelial barrier proteins. A, B, C. Levels of tight junction and adherence junction proteins in Caco-2 whole cell extracts were examined after 24 h of recombinant cysteine proteases treatment (A, 14019; B, 16779; C, 16160), respectively, by Western blot analysis, with GAPDH used as a loading control. Barrier proteins were detected with a mouse or rabbit anti-barrier protein antibody and then incubated with a HR- conjugated mouse or rabbit antibody. D E, F. The localization of occludin in Caco-2 cells visualized by immunofluorescence microscopy. Caco-2 monolayers were incubated with 2.5 ug/ml of 14019 (D), 16779 (E), 16160 (F) in the absence or presence of E64 (10 uM) for 24 h, followed by fixation of PFA. Occludin was detected with a mouse anti-occludin antibody and then incubated with an Alexa Fluor 488-conjugated mouse antibody. Images were taken by a Zeiss Axioplan II Imaging fluorescence microscope and analyzed by ZEN 2.1 software. Bar = 50 um.
- Submitted by
- Invitrogen Antibodies (provider)
- Main image
- Experimental details
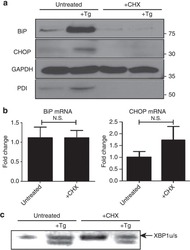
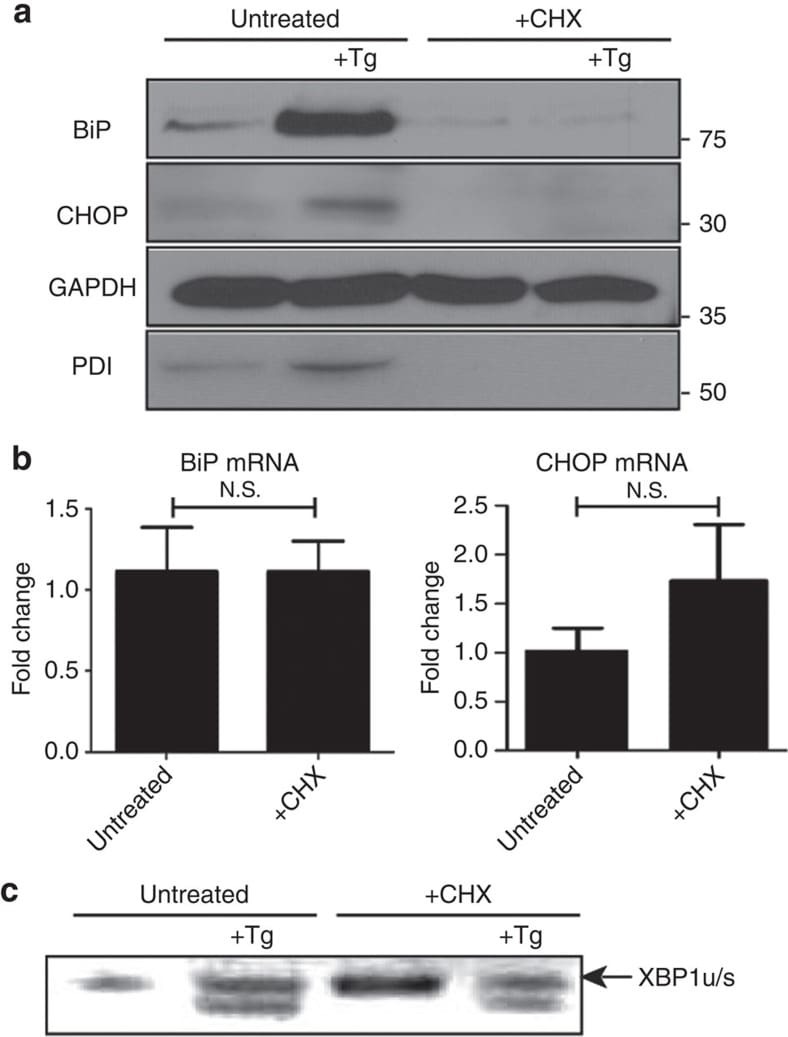
- Figure 5 Global protein translation inhibition does not the affect the UPR in the same manner as L. pneumophila infection. ( a ) RAW 264.7 cells were left untreated or treated with either thapsigargin (Tg; 1 mug mul -1 ), CHX (1 mug mul -1 ), or a combination of both for 6 h. Protein levels of UPR targets BiP, CHOP and PDI were monitored via immunoblot. ( b ) RAW267.4 macrophage cells were treated with CHX or left untreated and BiP and CHOP mRNA levels were monitored via qRT-PCR. Three internal replicates were performed, values in all graphs are means+-s.e.m. * P
- Submitted by
- Invitrogen Antibodies (provider)
- Main image
- Experimental details
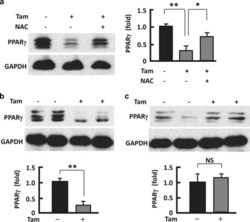
- Figure 6 Counteracting or normalizing ROS reduced Tam effect on PPAR gamma . ( a ) Western blotting analysis (left panel) of PPAR gamma in 3T3L1 adipocytes after 48-h treatment with Tam (128 mu M) or Tam (128 mu M) plus NAC (1 mM), with densitometric analysis (right panel) of western blotting images using the NIH ImageJ software; n =3-5. ( b ) At week 2 after Tam administration, western blotting (upper panel) was performed to analyze PPAR gamma , with densitometric analysis (lower panel) of western blotting images using the NIH ImageJ software; n =3-5. ( c ) At week 6 after Tam administration, western blotting (upper panel) was performed to analyze PPAR gamma , with densitometric analysis (lower panel) of western blotting images using the NIH ImageJ software; n =3-5. GAPDH (glyceraldehyde 3-phosphate dehydrogenase) was probed as a loading control. * P

- Submitted by
- Invitrogen Antibodies (provider)
- Main image

- Experimental details
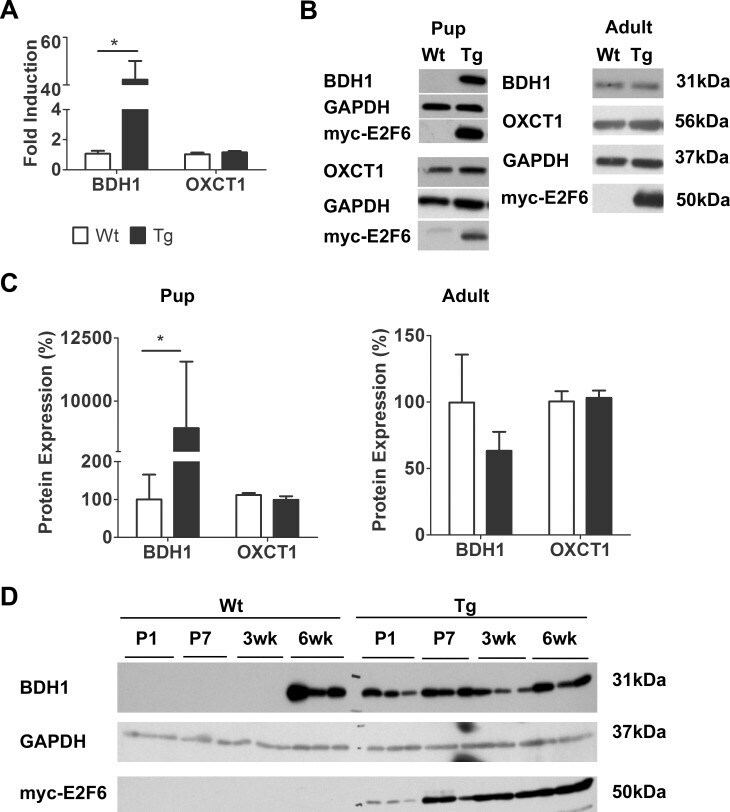
- Fig 1 E2F6 Activates BDH1 Expression in Neonatal Myocardium. ( A) Bdh1 (beta-hydroxybutyrate dehydrogenase 1) and Oxct1 (succinyl-CoA: 3-oxoacid-CoA transferase) transcript levels in Wt and Tg myocardium 7 days after birth. Expression is normalized to Gapdh . Results represent mean+-SEM values (n = 5-7). ( B) Representative immunoblots of protein from Wt and Tg mouse myocardium at post-natal day 1 (pups) and 6wks of age (adult) examined with the anti-BDH1 and anti-OXCT1. ( C) Densitometric quantification of BDH1 and OXCT1 expression from immunoblots. Expression is normalized against GAPDH. Results represent mean+-SEM values (n = 4). ( D) Immunoblot of protein from Wt and Tg myocardium with BDH1 at the indicated time points after birth.* P
- Submitted by
- Invitrogen Antibodies (provider)
- Main image
- Experimental details
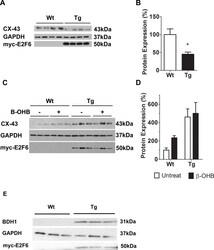
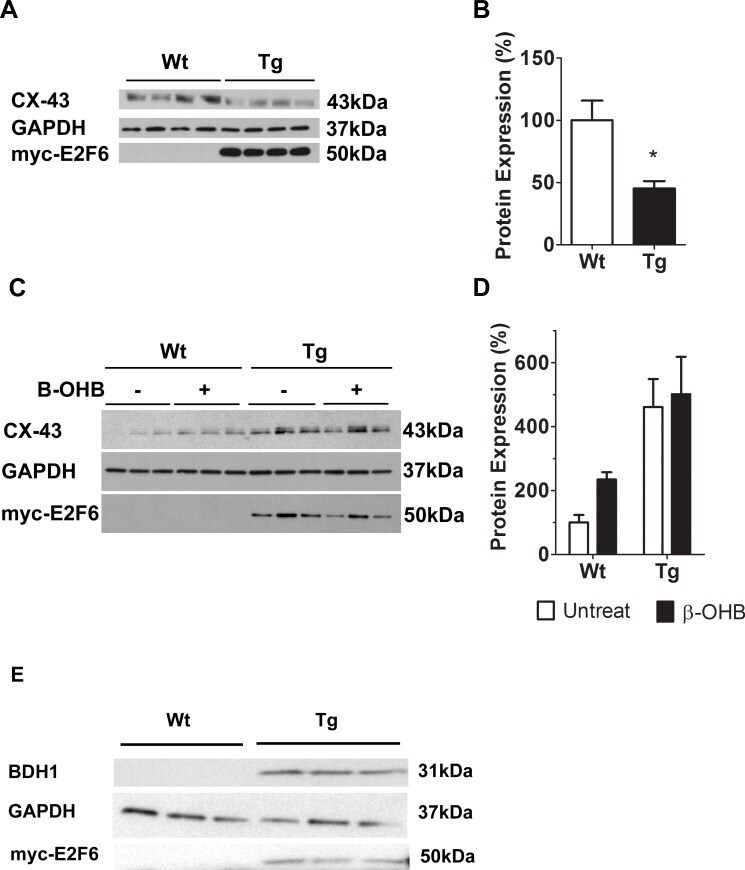
- Fig 5 beta-OHB Regulates CX-43 Protein Expression in Neonatal Cardiomyocytes. ( A) Representative immunoblot of protein isolated from Wt and Tg myocardium at post-natal day 1 with anti-CX-43. ( B) Densitometric quantification of CX-43 immunoblot. Expression is normalized against GAPDH. Results represent mean+-SEM values (n = 4). ( C) Representative immunoblot analyses of protein from Wt and Tg neonatal cardiomyocytes following incubation with or without beta-OHB (beta-hydroxybutyrate). ( D) Densitometric quantification of CX-43 in treated and non-treated neonatal cardiomyocytes. Expression is normalized against GAPDH. Results represent the mean+-SEM values (n = 3-5). A two-way ANOVA was used to measure statistical significance. ( E ) Representative immunoblot analysis of BDH1 in Wt and Tg neonatal cardiomyocytes. * P
- Submitted by
- Invitrogen Antibodies (provider)
- Main image
- Experimental details
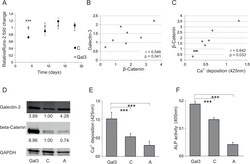
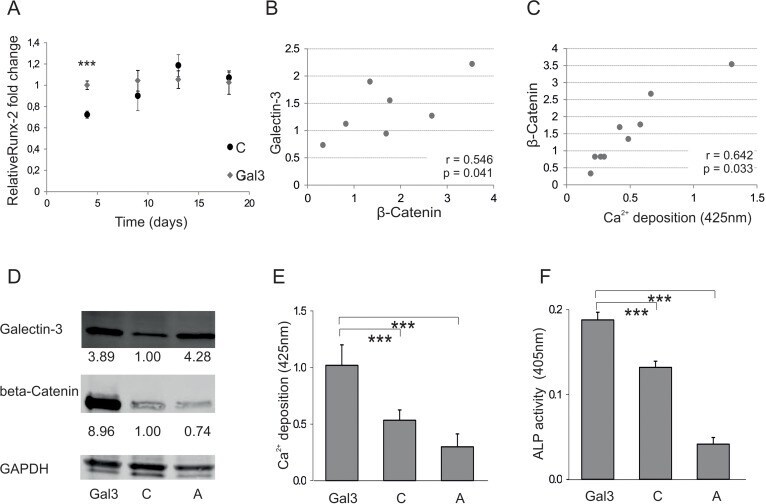
- Figure 4 Galectin-3s molecular way of action ( A ) Relative fold change of Runx-2 mRNA levels during osteogenic differentiation over a time course of 18 days. Runx-2 mRNA levels of Galectin-3 overexpressing (Gal3) (indicated in grey squares) or empty vector control transfected cells (C) (displayed by black dots) were evaluated by qPCR and normalized to GAPDH. Runx-2 mRNA transcription was significantly increased at day 4 of differentiation in Galectin-3 overexpressing ASCs (Gal3) compared to empty vector control transfected cells (C) Levels of empty vector control transfected cells are displayed as black dots and data obtained from Galectin-3 overexpressing cells as grey dots. ( B-C ) Spearman correlation of beta-Catenin protein levels before induction of osteogenic differentiation to ( B ) intracellular Galectin-3 levels or (C) corresponding mineralization capacity of ASCs. ( D ) Overexpression of Galectin-3 wild type (Gal3) and Serine-96 to Alanine (A) mutant compared to empty vector control transfected ASCs (C) was confirmed by Western blot. Galectin-3 as well as beta-Catenin protein levels have been normalized to GAPDH ( E-F ) ASCs overexpressing the Galectin-3 mutant (A) showed a significant reduction in their osteogenic differentiation capacity compared to Galectin-3 wild type (Gal3) overexpressing cells as analysed by ( E ) Alizarin Red S staining ( F ) ALP activity assay and ( G ) qPCR on Osteonectin. ( H-J ) ASCs were either untreated (untreated) or exposed to cell p
- Submitted by
- Invitrogen Antibodies (provider)
- Main image

- Experimental details
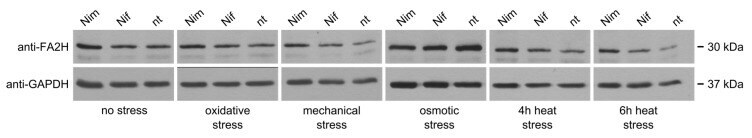
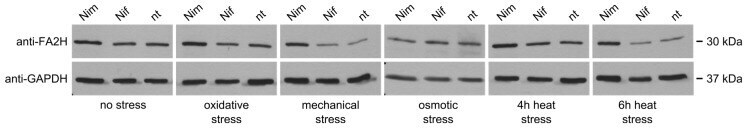
- Figure 5 FA2H protein levels in undifferentiated Neuro2a cells. 20 ug total protein was loaded per sample on a 12% sodium dodecyl sulfate-polyacryl amide (SDS-PAA) gel. One representative out of at least three biologically independent experiments is displayed. Nim = nimodipine pre-treatment (20 uM); Nif = nifedipine pre-treatment (20 uM) nt = no drug pre-treatment; anti-FA2H = rabbit anti-FA2H antibody (1:1000); anti-GAPDH = mouse anti-GAPDH antibody (1:5000; loading control).
- Submitted by
- Invitrogen Antibodies (provider)
- Main image
- Experimental details
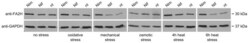
- Figure 6 FA2H protein levels in undifferentiated Neuro2a cells. 20 ug total protein was on loaded per sample on a 12% SDS-PAA gel. One representative out of at least three biologically independent experiments is displayed. Nim = nimodipine pre-treatment (20 uM); Nif = nifedipine pre-treatment (20 uM) nt = no drug pre-treatment; anti-FA2H = rabbit anti-FA2H antibody (1:1000); anti-GAPDH = mouse anti-GAPDH antibody (1:5000; loading control).
- Submitted by
- Invitrogen Antibodies (provider)
- Main image
- Experimental details
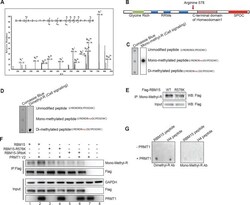
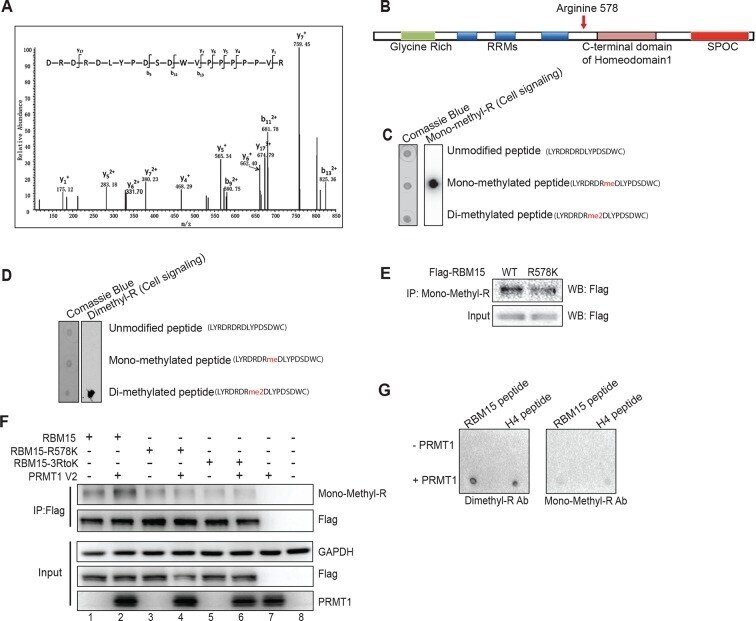
- Figure 1--figure supplement 3. Mapping the methylation site for RBM15. ( A ) Tandem mass spectrometry analysis for Flag-tagged RBM15 purified from 293T cells overexpressing RBM15-Flag. The arrow indicates the modified peptide. ( B ) Schematic diagram shows domains on RBM15. ( C ) Dot blot to test the antibody (Mono-R100 from Cell Signaling, Danvers, MA) recognizing monomethylated RBM15 peptide based on mass spectrometry analysis. Nitrocellulose membrane was spotted with peptides with no modification, with arginine mono-methylated or with arginine asymmetrically dimethylated. The peptide sequences were listed on the right side of the dot blot gel. ( D ) Dot blot to test the antibody (D4H5 from Cell Signaling) which recognizes asymmetrically dimethylated RBM15 peptide. Peptides were spotted in the same order as in panel C. ( E ) IP-WBwestern blot for RBM15 protein in Meg-01 cell lines expressing Flag-tagged RBM15 and Flag-tagged RBM15 R578K. Anti-monomethyl arginine antibody was used for immunoprecipitation and the ectopically expressed RBM15 proteins were detected by Flag antibody. ( F ) IP-western blotting assays for detecting methylated RBM15 and R3K mutant expressed in 293T cells. RBM15-R3K stands for RBM15 protein with all the arginines in the LYRDRDRD sequence mutated to lysines. ( G ) The in vitro methylation reaction with peptide (LYRDRDRDLY) incubated with purified PRMT1. H4 peptide (20 mer) was used as a positive control. The methylated peptide was detected by the D4H
- Submitted by
- Invitrogen Antibodies (provider)
- Main image

- Experimental details
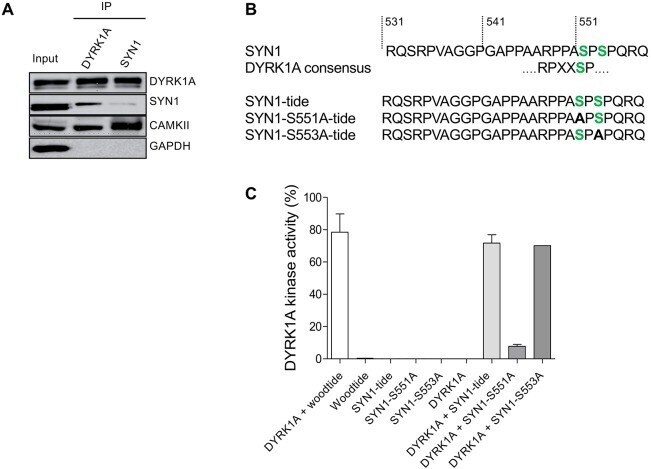
- Fig. 9. Direct interaction of DYRK1A and SYN1, phosphorylation of SYN1 by DYRK1A. (A) DYRK1A and SYN1 were immunoblotted following immunoprecipitation from wt mice brain extracts. DYRK1A or SYN1 present in the starting material (Input) were recovered in the IPs. SYN1 (74 kDa) was present in the DYRK1A IP and DYRK1A (85 kDa) was detected in the SYN1 IP, suggesting that these two proteins interact directly. Positive control of the SYN1 IP was performed using an anti-CAMKII antibody. As expected, CAMKII (50 kDa) was present in the SYN1 IP. DYRK1A IP also brought down CAMKII, suggesting complexes between SYN1, CAMKII and DYRK1A. (B) Sequence of SYN1 in the vicinity of Ser551 matches with the consensus DYRK1A phosphorylation site. Based on this sequence, three peptides were synthesized and used as potential substrates: SYN1, SYN1-S551A and SYN1-S553A. (C) Kinase activity of recombinant DYRK1A towards the three different SYN1peptides. SYN1 and SYN1-S553A peptides were phosphorylated at the same level as Woodtide by recombinant DYRK1A (71.7%+-5.2%, 70.1% and 78.4%+-11.4%, respectively). No significant catalytic activity was measured with the SYN1-S551A peptide (7.9%+-1.2%).