Explore
 Validate
 Learn
Learn Western blot
Antibody data
- Antibody Data
- Antigen structure
- References [0]
- Comments [0]
- Validations
- Western blot [1]
- Other assay [19]
Submit
Validation data
Reference
Comment
Report error
- Product number
- TAB1001 - Provider product page

- Provider
- Invitrogen Antibodies
- Product name
- GAPDH Polyclonal Antibody
- Antibody type
- Polyclonal
- Antigen
- Synthetic peptide
- Description
- TAB1001 detects GAPDH in samples. TAB1001 has been successfully used in Western Blot applications. The TAB1001 immunogen is a KLH conjugated peptide representing human GAPDH.
- Reactivity
- Human
- Host
- Rabbit
- Isotype
- IgG
- Vial size
- 100 µg
- Concentration
- 1 mg/mL
- Storage
- 4° C, store in dark, DO NOT FREEZE!
No comments: Submit comment
Supportive validation
- Submitted by
- Invitrogen Antibodies (provider)
- Main image
- Experimental details
- Western blot analysis of GAPDH using a polyclonal antibody (Product # TAB1001).
Supportive validation
- Submitted by
- Invitrogen Antibodies (provider)
- Main image

- Experimental details
- NULL
- Submitted by
- Invitrogen Antibodies (provider)
- Main image
- Experimental details
- NULL

- Submitted by
- Invitrogen Antibodies (provider)
- Main image

- Experimental details
- NULL
- Submitted by
- Invitrogen Antibodies (provider)
- Main image
- Experimental details
- NULL

- Submitted by
- Invitrogen Antibodies (provider)
- Main image

- Experimental details
- NULL
- Submitted by
- Invitrogen Antibodies (provider)
- Main image
- Experimental details
- NULL
- Submitted by
- Invitrogen Antibodies (provider)
- Main image

- Experimental details
- NULL
- Submitted by
- Invitrogen Antibodies (provider)
- Main image
- Experimental details
- NULL
- Submitted by
- Invitrogen Antibodies (provider)
- Main image
- Experimental details
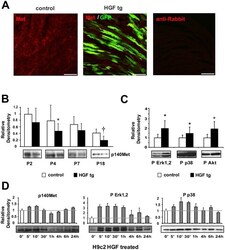
- Figure 2 Analysis of Met expression and downstream signalling activation in neonatal cardiomyocytes. (A) Immunofluorescence of Met receptor (red) and GFP (green) in neonatal (P7) heart samples of control (left panel) and HGF tg mice (middle panel). A negative control of secondary antibody was included (right panel). Bars: 50um. (B) Western blot of Met (p140Met) protein in control and HGF tg mice at different ages post-birth (P2 n = 6 n = 7, P4 n = 8 n = 6, P7 n = 10 n = 11, P18 n = 9 n = 14). Representative blots are shown below densitometric quantification (normalized on GAPDH loading control, relative to P2 control). Controls vs HGF tg mice: *p

- Submitted by
- Invitrogen Antibodies (provider)
- Main image
- Experimental details
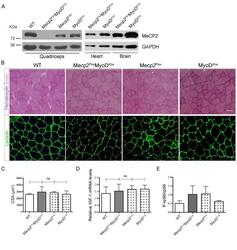
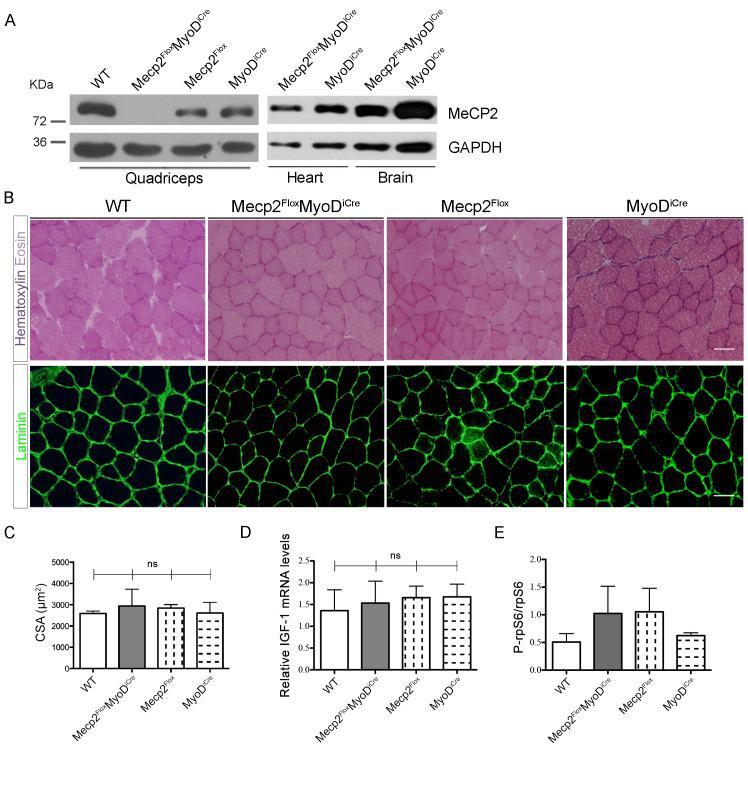
- Fig 4 Muscle specific deletion of Mecp2 does not lead to the observed muscular alterations. (A) WBs confirm the specific skeletal muscle deletion of Mecp2 in the transgenic Mecp2 Flox MyoD iCre mice. WT, Mecp2 Flox and MyoD iCre genotypes are used as controls. (B) Representative TA cross-sections stained with Hematoxylin and Eosin (upper panels) or immunostained for Laminin (bottom panels). Scale bar = 50 mum. (C) Mean CSA +- s.e.m. showing no statistically significant differences between Mecp2 Flox MyoD iCre mice fibers and control ones. At least 130 myofibers were counted for each animal. Significance was calculated using one-way ANOVA (ns: 0.8520). (D) Mecp2 Flox MyoD iCre mice and controls show similar levels of Gast IGF-1 mRNA. Significance was calculated using one-way ANOVA (n>=3; ns: 0.9283). (E) Graph showing similar levels of P-rpS6 between Mecp2 Flox MyoD iCre quadriceps and the corresponding controls. Data are represented as mean +- s.e.m. (n = 2).
- Submitted by
- Invitrogen Antibodies (provider)
- Main image
- Experimental details
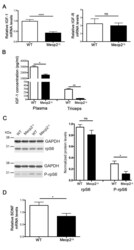
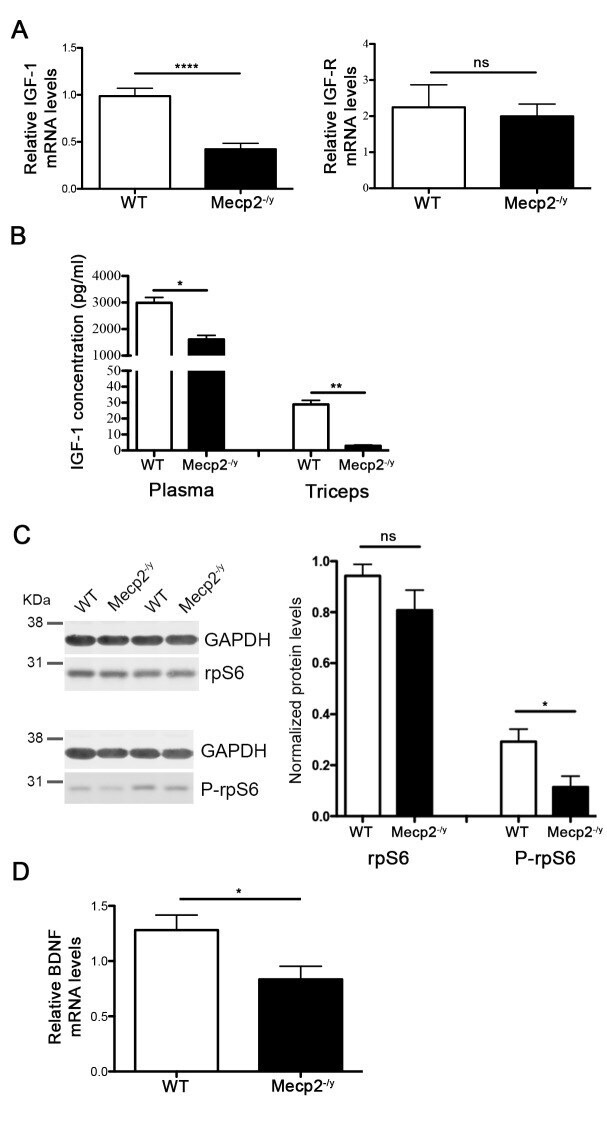
- Fig 2 Mecp2 -/y muscles exhibit deregulated protein synthesis signalling pathways. (A) qPCR evaluation of IGF-1 (n = 8) and IGF-R (n = 3) mRNA expression in WT and Mecp2 -/y gastrocnemius. All data points were calculated in triplicate, normalized to GAPDH and represented as gene expression relative to WT expression. Significance is calculated with t test (**** P value:
- Submitted by
- Invitrogen Antibodies (provider)
- Main image
- Experimental details
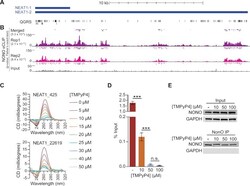
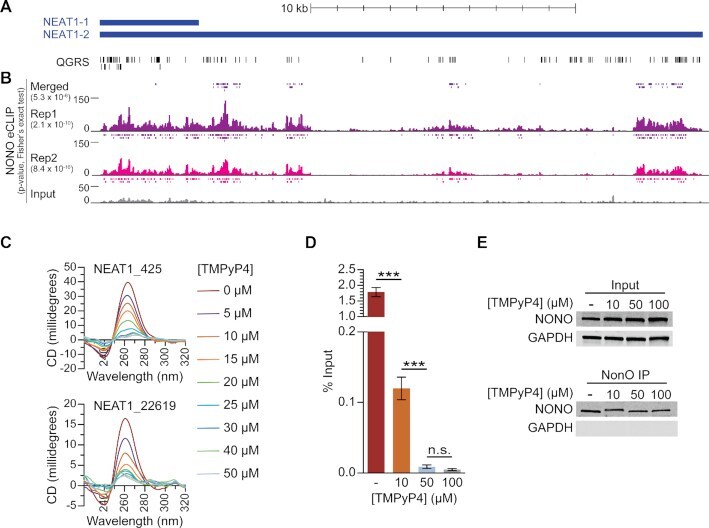
- Figure 6. NONO binds to NEAT1 through G-quadruplex motifs. ( A ) Quadruplex-forming G-rich sequences (QGRS) mapped to NEAT1 are shown as tall bars (black). ( B ) NONO eCLIP data mapped to NEAT1. Reads are plotted by intensity and called peaks are shown as short bars. Tracks, from top to bottom: Merged peaks, determined by replication and adjustment for input (dark purple); Replicate 1 read intensity plot with called peaks directly beneath (purple); Replicate 2 read intensity plot with called peaks directly beneath (pink); size-matched paired input read intensity plot (grey). The statistical significance of overlap between QGRS and each set of peaks was determined using the two-tailed Fisher's exact test, with P -values shown in parentheses beneath each corresponding track label. ( C ) Circular dichroism of 5 muM NEAT1_425 and NEAT1_22619 G-quadruplex RNAs following addition of TMPyP4 at increasing concentrations. ( D ) NEAT1 enrichment by NONO RNA-IP with addition of TMPyP4. RNA-IP for NONO was performed on HEK293T cell lysate. Various concentrations of TMPyP4 were added to lysate before immunoprecipitation. RT-qPCR was performed to measure NEAT1 enrichment, expressed as percentage of input ( n = 4). '***' indicates P < 0.0005; 'n.s.' indicates P >= 0.05 (two-tailed t -test). ( E ) Western blot of RNA-IP samples described in (D) and 5% input. GAPDH was blotted as a negative control for IP enrichment.
- Submitted by
- Invitrogen Antibodies (provider)
- Main image
- Experimental details
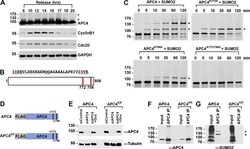
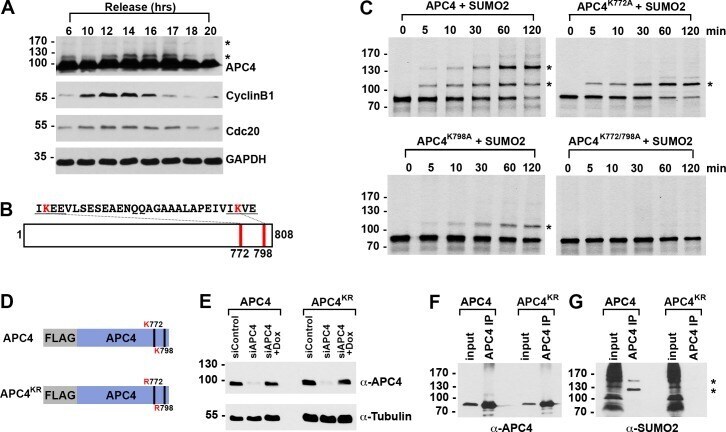
- Figure 1. APC4 is sumoylated in a cell-cycle-dependent manner at two C-terminal lysines. ( A ) HeLa cells were synchronized in S-phase using a double-thymidine arrest and released for varying time points. Whole cell lysates were analyzed by immunoblotting for APC4, Cyclin B1, Cdc20, and glyceraldehyde 3-phosphate dehydrogenase (GAPDH) as a loading control. Asterisks indicate sumoylated forms of APC4. ( B ) APC4 contains two C-terminal SUMO consensus site lysines at 772 and 798. ( C ) Full-length wild-type APC4 or the indicated lysine to alanine substitution mutants were expressed in rabbit reticulocyte lysate in the presence of [ 35 S]-methionine and incubated for the indicated times in modification reactions containing SUMO E1 and E2 enzymes and SUMO2. Proteins were detected by SDS-PAGE and autoradiography. Asterisks indicate sumoylated forms of APC4. ( D ) Constructs coding for FLAG-tagged versions of wild type APC4 or a sumoylation-deficient mutant containing arginine substitutions at lysines 772 and 798 (APC4 KR ) were used to generate stable inducible cell lines in YFP-H2B HeLa cells. ( E ) Endogenous APC4 was depleted by siRNA, and FLAG-APC4 or FLAG-APC4 KR stable cell lines were induced by doxycycline for 48 hr. Immunoblot analysis using APC4 and tubulin-specific antibodies reveals that FLAG-APC4 and FLAG-APC4 KR are expressed at near endogenous levels. ( F-G ) Co-immunoprecipitations were performed with an antibody against APC4, followed by immunoblotting for APC4
- Submitted by
- Invitrogen Antibodies (provider)
- Main image
- Experimental details
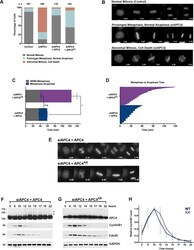
- 10.7554/eLife.29539.007 Figure 2. APC4 sumoylation is required for timely metaphase-anaphase transition. ( A ) Cells were transfected with control or APC4-specific siRNAs for 48 hr followed by 16 hr of timelapse live cell acquisition. siAPC4 transfected cells were also induced to express FLAG-APC4 or FLAG-APC4 KR . Analysis represents mitotic progression time beginning with nuclear envelope breakdown (NEBD) to anaphase onset. Quantification of mitotic phenotypes is shown. Prolonged metaphase is defined by >60 min in metaphase plate alignment before anaphase onset. Abnormal metaphase is defined by inability to generate a metaphase plate and defects in chromosomal cohesion. n > 100 for each cell line. ( B ) Cells representative of each mitotic phenotype categorized in ( A ) are featured with timestamps in minutes. ( C ) Mitotic progression beginning with NEBD to metaphase plate alignment and from metaphase plate alignment to anaphase onset was quantified in FLAG-APC4 and FLAG-APC4 KR expressing cells. Experiments were performed in triplicate; means are displayed and error bars represent standard deviations. n = 50 for each cell line. Two-tailed t-tests were used to calculate significance: p=0.38 for differences in FLAG-APC4 and FLAG-APC4 KR timing from NEBD-metaphase, p

- Submitted by
- Invitrogen Antibodies (provider)
- Main image
- Experimental details
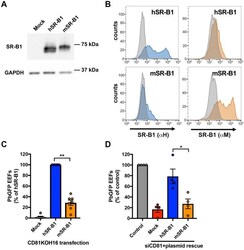
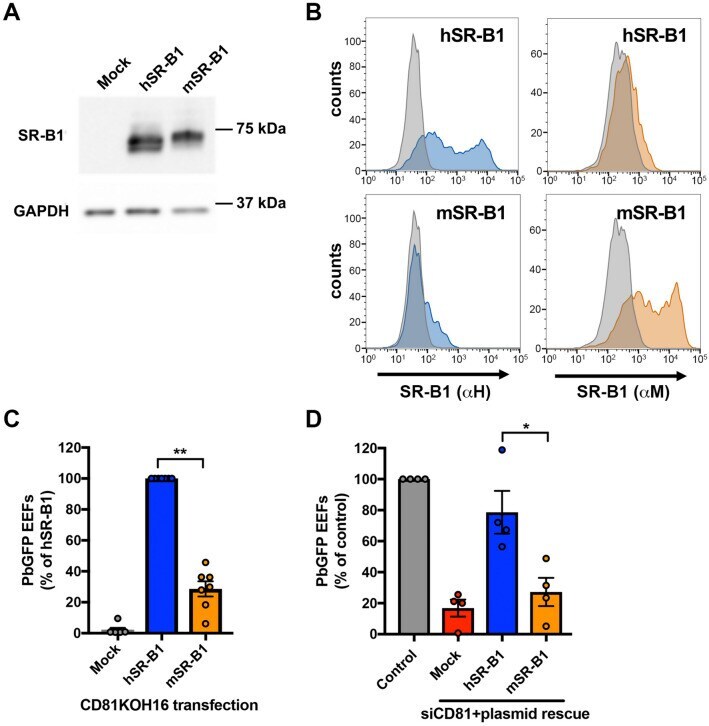
- Figure 3 Mouse SR-B1 poorly supports P. berghei sporozoite invasion. (A,B) CD81KOH16 cells were transfected with either mouse or human SR-B1 plasmids, or no plasmid as a control (Mock). Total protein expression was analyzed using polyclonal anti-SR-B1 antibodies (Ab24603) by western blot (A) with GAPDH as a loading control. Surface protein expression was analyzed by flow cytometry (B) using anti-human ""alphaH"" SR-B1 polyclonal rabbit serum (blue) and anti-mouse ""alphaM"" polyclonal antibodies NB400-113 (orange). The grey histogram represents untransfected cells labeled with the corresponding antibody. (C,D) CD81KOH16 (C) and WT Hepa1-6 cells treated with siRNA against CD81 24 h before (D) , were transfected with mouse or human SR-B1 plasmids, or no plasmid as a negative control (Mock), and then infected with PbGFP sporozoites. EEF numbers were counted by microscopy after UIS4 staining, 24 h after sporozoite addition. The mean control values for each experiment were 59, 139, 214, 245, 299, 315 and 383 EEFs/well in hSR-B1-transfected CD81KOH16 cells (C) , and 30, 140, 155 and 215 EEFs/well in control Hepa1-6 cells (D) . * p < 0.05; ** p < 0.01 (repeated measures one-way ANOVA followed by Tukey's multiple comparisons test).
- Submitted by
- Invitrogen Antibodies (provider)
- Main image
- Experimental details
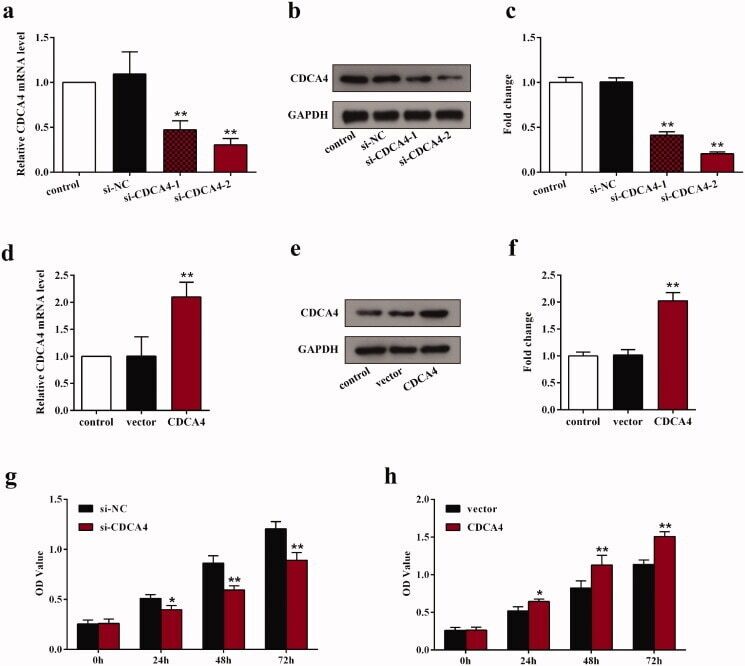
- Figure 2. The influence of CDCA4-knockdown and -overexpression on the CDCA4 expression and WiT49 cells proliferation. (a-b) mRNA expression (a) and protein expression levels (b) of CDCA4 were measured by qRT-PCR (a) and western blot (b) analyses after transfected with control, si-NC, si-CDCA4-1, and si-CDCA4-2 in WiT49 cells. (c) Quantification of b. ** p < 0.01 vs. control or si-NC group. (d-e) mRNA expression (d) and protein expression levels (e) of CDCA4 were examined by qRT-PCR (d) and western blot (e) analyses after transfected with control, pcDNA3.1-vector, and pcDNA3.1-CDCA4 in WiT49 cells. (f) Quantification of e. ** p < 0.01 vs . control or vector group. (g-h) The influences of CDCA4-knockdown (g) and -overexpression (h) on the WiT49 cells proliferation were determined by CCK8 assay. ** p < 0.01 vs . si-NC or vector group.
- Submitted by
- Invitrogen Antibodies (provider)
- Main image
- Experimental details
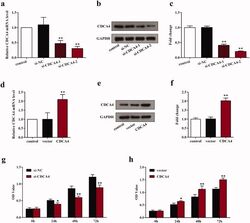
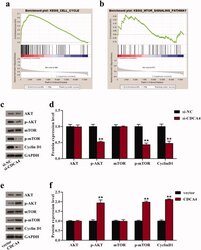
- Figure 4. CDCA4 affected cell cycle and AKT/mTOR signaling pathway. (a-b) GSEA was utilized to identify the relative signaling pathway associated with high CDCA4 expression. (c-f) The effects of CDCA4-knockdown (c-d) and -overexpression (e-f) on the AKT/mTOR relative markers and Cyclin D1 protein were evaluated using western blot analysis. (d) Quantification of c. (f) Quantification of e. ** p < 0.01 vs . si-NC or vector group.

- Submitted by
- Invitrogen Antibodies (provider)
- Main image
- Experimental details
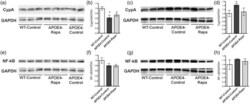
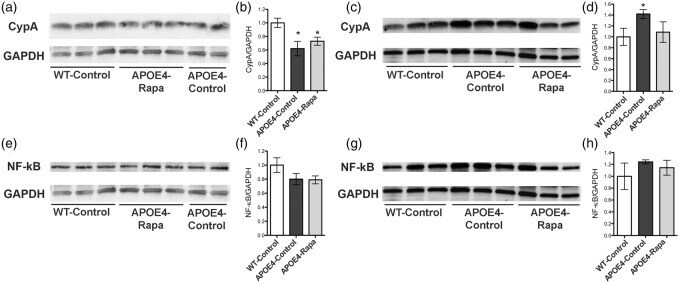
- Figure 5. Rapamycin restoring CypA levels in brain vasculature of APOE4 mice. (a,b) Immunoblots of cortical CypA lysates and the corresponding quantitative analyses; (c,d) immunoblots of microvascular CypA lysates and the corresponding quantitative analyses; (e,f) immunoblots of cortical NF-kappaB lysates and the corresponding quantitative analyses; (g,h) immunoblots of microvascular NF-kappaB lysates and the corresponding quantitative analyses. Data are presented as mean +- standard error of the mean. * P < 0.05. CypA: cyclophilin A; NF-kappaB: nuclear factor-kappab.
- Submitted by
- Invitrogen Antibodies (provider)
- Main image
- Experimental details
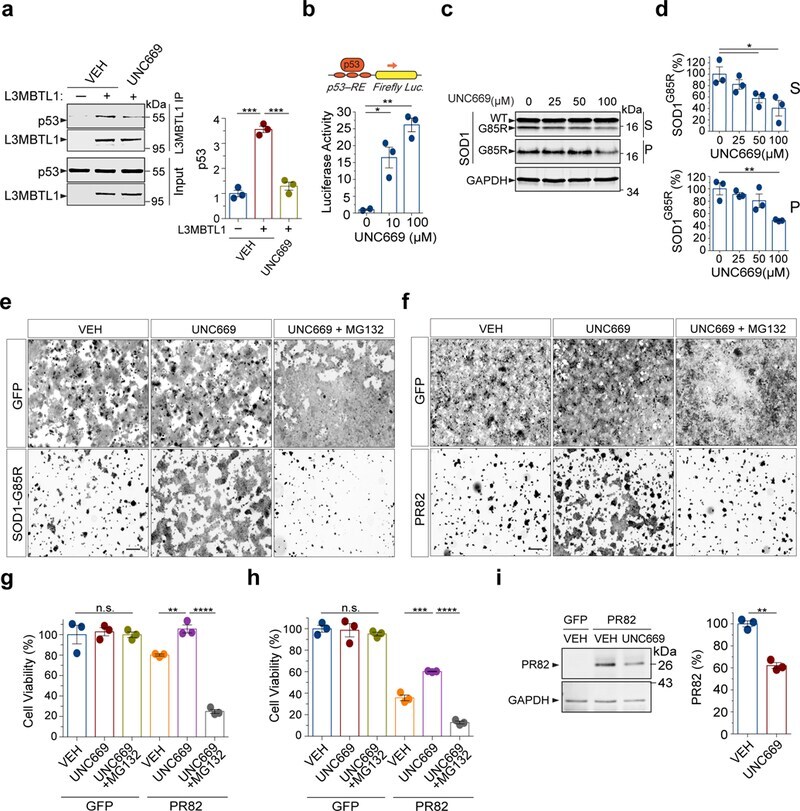
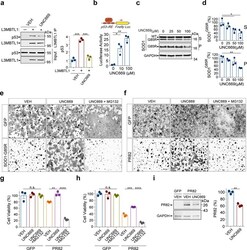
- Figure 5 L3MBT1 antagonist UNC669 protects against proteotoxicity in mammaliancells. ( a ) Co-immunoprecipitation analysis of Flag-tagged L3MBTL1and endogenous p53 in HEK293 cells treated with 12.5 uM UNC669 or vehiclecontrols (n=3 independent experiments; *** P(VEH)=0.0002, *** P(UNC669)=0.0004).( b ) HEK293 cells treated with increased concentrations ofUNC669 show increased p53 protein transcriptional activity, as measured by thep53 response element (p53-RE)-mediated luciferase activity assay (n=3independent experiments; * P=0.03; ** P=0.002). ( c ) HEK293 cellsexpressing SOD1 G85R were treated with increasing concentrations ofUNC669 (top) and the S and P fractions were analyzed by western blotting andprobed with antibodies against SOD1 and GAPDH. ( d ) Quantificationof SOD1 G85R western blot analyses in (c) (n=3 independentexperiments; * P