 Explore
 Validate
 Learn
Learn Western blot
 Immunohistochemistry
Antibody data
- Antibody Data
- Antigen structure
- References [0]
- Comments [0]
- Validations
- Western blot [1]
- Immunocytochemistry [1]
- Flow cytometry [1]
- Other assay [8]
Submit
Validation data
Reference
Comment
Report error
- Product number
- 44-804G - Provider product page

- Provider
- Invitrogen Antibodies
- Product name
- Phospho-IR/IGF1R (Tyr1162, Tyr1163) Polyclonal Antibody
- Antibody type
- Polyclonal
- Antigen
- Synthetic peptide
- Description
- The antibody has been negatively preadsorbed using a non-phosphopeptide corresponding to the site of phosphorylation to remove antibody reactive with non-phosphorylated insulin/insulin-like growth factor-1 receptor (IR/IGF1R). The final product is generated by affinity chromatography using an IR/IGF1R-derived peptide that is phosphorylated at tyrosines 1162 and 1163 (tyrosines 1135 and 1136 for IGF1R. The antiserum was produced against a chemically synthesized phosphopeptide derived from the region of IR/IGF1R that contains tyrosines 1162 and 1163 of the human insulin receptor (IR) as numbered according to Ebina, et al. (1150 and 1151 according to Ullrich et al.). The corresponding residues in the IGF1R are 1135 and 1136. The sequence is conserved in mouse and rat for both the IR and IGF1R. Although exhibiting a preference for IR/IGF1R, this antibody has been shown by both peptide competition and protein blotting to react with other dual-phosphotyrosine motifs from proteins such as c-Met and Shc. This antibody has been used in western blotting and previous lots of this antibody have been used in immunostaining. Positive controls used with this antibody in western analysis were Chinese hamster ovary cells transfected with a vector containing human insulin receptor (CHO-T) and stimulated with insulin, or 3T3-L1 cells stimulated with insulin.
- Reactivity
- Human
- Host
- Rabbit
- Isotype
- IgG
- Vial size
- 100 µL
- Storage
- -20°C
No comments: Submit comment
Supportive validation
- Submitted by
- Invitrogen Antibodies (provider)
- Main image

- Experimental details
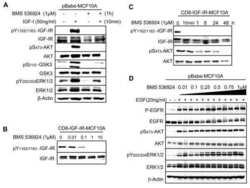
- Upregulation and Antibody-Peptide Competition. Extracts of CHO-T cells over-expressing the human insulin receptor unstimulated (1) or stimulated with 100 nM insulin for 10 min at 37°C (2-5) were resolved by SDS-PAGE on a 10% Tris-glycine gel and transferred to PVDF. The membrane was blocked with a 5% BSA-TBST buffer overnight at 4°C and incubated with the IR/IGF1R (pYpY1162/1163) antibody for two hours at room temperature in a 3% BSA-TBST buffer, following prior incubation with: no peptide (1, 5), the phosphopeptide immunogen (2), the non-phosphorylated peptide corresponding to the phosphopeptide immunogen (3), or a generic phosphotyrosine-containing peptide (4). After washing, the membrane was incubated with goat F (ab’)2 anti-rabbit IgG HRP-conjugate (Product # ALI4404) and signals were detected using the Pierce SuperSignal™method. The data show that only the phosphopeptide corresponding to IR/IGF1R (pYpY1162/1163) completely blocks the antibody signal, demonstrating the specificity of the antibody. The data also show the up-regulation of this site upon stimulation with insulin in this cell system.

Supportive validation
- Submitted by
- Invitrogen Antibodies (provider)
- Main image

- Experimental details
- Immunofluorescence analysis of IR/IGF1R (pYpY1162/1163) was done on 70% confluent log phase MCF7 cells treated with insulin (100nM for 5 min). The cells were fixed with 4% paraformaldehyde for 15 minutes, permeabilized with 0.25% Triton X-100 for 10 minutes, and blocked with 5% BSA for 1 hour at room temperature. The cells were labeled with IR/IGF1R (pYpY1162/1163) Rabbit polyclonal Antibody (Product # 44-804G) at 2 µg/mL in 1% BSA and incubated for 3 hours at room temperature and then labeled with Alexa Fluor 488 Goat Anti-Rabbit IgG Secondary Antibody (Product # A-11008) at a dilution of 1:400 for 30 minutes at room temperature (Panel a: green). Nuclei (Panel b: blue) were stained with SlowFade® Gold Antifade Mountant DAPI (Product # S36938). F-actin (Panel c: red) was stained with Alexa Fluor 594 Phalloidin (Product # A12381). Panel d is a merged image showing membrane localization. Panel e shows untreated MCF7 cells. Panel f shows no primary antibody control. The images were captured at 20X magnification.

Supportive validation
- Submitted by
- Invitrogen Antibodies (provider)
- Main image

- Experimental details
- Flow cytometry analysis of IR/IGF1R [pY1162/pY1163] was done on MCF7 cells treated with Insulin (100nM, 5 minutes). Cells were fixed with 70% ethanol for 10 minutes, permeabilized with 0.25% Tritonª X-100 for 20 minutes, and blocked with 5% BSA for 30 minutes at room temperature. Cells were labeled with IR/IGF1R [pY1162/pY1163] Rabbit Polyclonal Antibody (44804G, red histogram) or with rabbit isotype control (pink histogram) at 3-5 µg/million cells in 2.5% BSA. After incubation at room temperature for 2 hours, the cells were labeled with Alexa Fluor¨ 488 Goat Anti-Rabbit Secondary Antibody (A11008) at a dilution of 1:400 for 30 minutes at room temperature. The representative 10,000 cells were acquired and analyzed for each sample using an Attune¨ Acoustic Focusing Cytometer. The purple histogram represents unstained control cells and the green histogram represents no-primary-antibody control.

Supportive validation
- Submitted by
- Invitrogen Antibodies (provider)
- Main image

- Experimental details
- NULL

- Submitted by
- Invitrogen Antibodies (provider)
- Main image

- Experimental details
- NULL

- Submitted by
- Invitrogen Antibodies (provider)
- Main image
- Experimental details
- NULL

- Submitted by
- Invitrogen Antibodies (provider)
- Main image

- Experimental details
- NULL

- Submitted by
- Invitrogen Antibodies (provider)
- Main image

- Experimental details
- NULL

- Submitted by
- Invitrogen Antibodies (provider)
- Main image

- Experimental details
- Figure 4 Peripheral insulin signaling in 12-month-old mice on methionine restriction (MR) and control diet. Insulin signaling was assessed by administering either a saline ( n = 3) or low dose of insulin (0.8 mU g -1 ) ( n = 5-6) to mice, via i.p. injection, after a 5-h fast. Levels of phosphorylated IR (tyr 1162/1163), protein kinase B/Akt (ser473), S6 (ser235/236), IR-beta, total Akt, and total S6 were measured by immunoblotting in (A) epididymal white adipose tissue (WAT), (C) liver, and (E) gastrocnemius muscle in 12-month-old mice fed MR or control diet. Immunoblots were normalized to Ponceau S and total protein in (B) epididymal WAT, (D) liver, and (F) gastrocnemius muscle in 12-month-old mice fed MR or control diet. Data were analyzed as fold change relative to control-fed insulin-injected mice. Significance was calculated by two-tailed Student's t -test (* P < 0.05). Data are represented as mean +- SEM. Black hatch bars, 12-month-old control-fed mice injected with saline; black bars, 12-month-old control-fed mice injected with insulin; white crossed bars, 12-month-old MR-fed mice injected with saline; white bars, 12-month-old MR-fed mice injected with insulin.

- Submitted by
- Invitrogen Antibodies (provider)
- Main image

- Experimental details
- Figure 6 Effects of 48-h methionine restriction (MR) treatment on body weight, FGF21 and glucose homeostasis. (A) Body weight in mice fed MR or control diet ( n = 13). Significance was calculated by repeated measures two-way ANOVA with Bonferroni multiple comparison post hoc tests (* P < 0.05). (B) Serum FGF21 ( n = 13) and (C) hepatic gene expression of FGF21 ( n = 6) in mice fed MR or control diet. Data for gene expression were analyzed as fold change relative to control-fed mice. Significance was calculated by two-tailed Student's t -test (* P < 0.05). (D) Glucose tolerance as assessed by a glucose tolerance test (dose of glucose = 2 g kg -1 ) after a 5-h fast in mice fed MR or control diet ( n = 9-10). Significance was calculated by repeated measures two-way ANOVA with Bonferroni multiple comparison post hoc tests (* P < 0.05). Black bars/circles, control-fed mice; white bars/circles, MR-fed mice. Insulin signaling was assessed by administering either a saline ( n = 3) or high dose of insulin (10 mU g -1 ) ( n = 5-6) to mice, via i.p. injection, after a 5 h fast. (E) Levels of phosphorylated IR (tyr 1162/1163), protein kinase B/Akt (ser473), S6 (ser235/236), IR-beta, total Akt, and total S6 were measured by immunoblotting in liver in mice fed MR or control diet. (F) Immunoblots were normalized to Ponceau S and total protein in liver in mice fed MR or control diet. Data were analyzed as fold change relative to control-fed insulin-injected mice. Significance was calculated

- Submitted by
- Invitrogen Antibodies (provider)
- Main image
- Experimental details
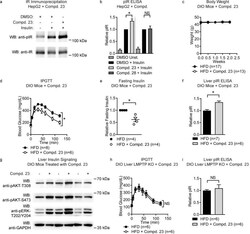
- Figure 5 Compd. 23 increases liver cell insulin signaling, is orally bioavailable and reverses diabetes in obese mice (a-b) HepG2 hepatocytes were incubated overnight with 10 muM compound (Compd.) or dimethylsulfoxide (DMSO) and stimulated with 10 nM insulin for 5 min or left unstimulated (Unst.). Insulin receptor (IR) tyrosine phosphorylation was assessed by (a) Western blotting of anti-IR immunoprecipitations (representative of 2 independent experiments) and (b) phosphoIR (pIR) ELISA (data from 5 independent experiments, Compd. 23 : p=0.0079, Compd. 28 : p=0.1667). (c-g) Diet-induced obese (DIO) male B6 mice were treated with 0.05% w/w Compd. 23 in high-fat diet (HFD) or HFD alone for 2 weeks. (c) Body weight during treatment (HFD, n=17; Compd. 23 , n=13). (d) Intraperitoneal glucose tolerance test (IPGTT), p=0.0162 (HFD, n=8; Compd. 23 , n=6). (e) Fasting plasma insulin levels, relative to littermates fed HFD, p=0.0235 (HFD, n=4; Compd. 23 , n=4). (f-g) Mice were injected intraperitoneally with insulin and livers harvested after 10 min. (f) Liver IR tyrosine phosphorylation, p=0.0002 (HFD, n=7; Compd. 23 , n=6). (g) Western blot of liver homogenates (HFD, n=3; Compd. 23 , n=3). (h-i) DIO liver-specific LMPTP KO mice were treated with Compd. 23 (HFD, n=6; Compd. 23 , n=6) as in (c-g) . (h) IPGTT, p=0.6120. (i) Liver IR tyrosine phosphorylation, p=0.2791. (b-f,h-i) Mean+-SEM. *, p=0.05): (b) Kolmogorov-Smirnov test, (d,h) Two-Way ANOVA, (e) two-
