 Explore
 Validate
 Learn
Learn Immunocytochemistry
Antibody data
- Antibody Data
- Antigen structure
- References [0]
- Comments [0]
- Validations
- Immunocytochemistry [1]
- Other assay [10]
Submit
Validation data
Reference
Comment
Report error
- Product number
- MA1-065-A488 - Provider product page

- Provider
- Invitrogen Antibodies
- Product name
- Clathrin Heavy Chain Monoclonal Antibody (X22), Alexa Fluor™ 488
- Antibody type
- Monoclonal
- Antigen
- Purifed from natural sources
- Description
- MA1065A488 detects clathrin heavy chain in non-human primate, bovine, human, rat and mouse tissues as well as hamster (CHO) cells. The MA1065A488 immunogen is purified human brain clathrin heavy chain. Electron microscopy and proteolysis mapping demonstrate that MA1065A488 binding occurs towards the central hub of the triskelion, N-terminal to the light chain binding regions.
- Reactivity
- Human, Mouse, Rat, Bovine, Hamster
- Host
- Mouse
- Conjugate
- Green dye
- Isotype
- IgG
- Antibody clone number
- X22
- Vial size
- 50 µL
- Concentration
- 1 mg/mL
- Storage
- 4° C, store in dark, DO NOT FREEZE!
No comments: Submit comment
Supportive validation
- Submitted by
- Invitrogen Antibodies (provider)
- Main image

- Experimental details
- Immunofluorescent analysis of Clathrin Heavy Chain (green) in HeLa cells. The cells were fixed with 4% Paraformaldehyde in PBS for 15 minutes at room temperature, and blocked with 3% BSA in PBS (Product # 37525) for 30 minutes at room temperature. Cells were stained with a Clathrin Heavy Chain Monoclonal Antibody, AlexaFluor 488 conjugate (Product # MA1-065-A488) at a dilution of 5 µg/mL in blocking buffer for 1 hour at room temperature protected from light. Nuclei (blue) were stained with Hoechst Dye (Product # 62249) at a dilution of 1:10,000 in blocking buffer. Images were taken on a Thermo Scientific ToxInsight Instrument at 20X magnification.
- Conjugate
- Green dye

Supportive validation
- Submitted by
- Invitrogen Antibodies (provider)
- Main image

- Experimental details
- NULL
- Conjugate
- Green dye

- Submitted by
- Invitrogen Antibodies (provider)
- Main image
- Experimental details
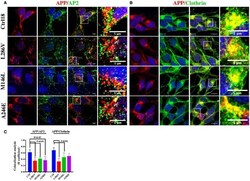
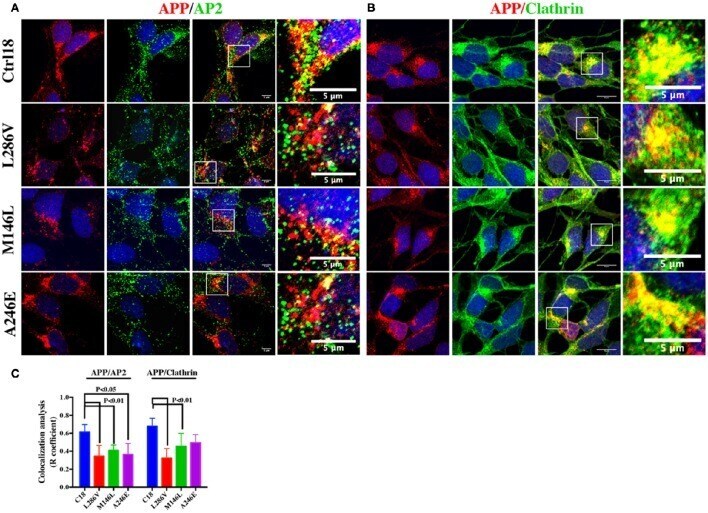
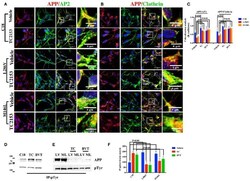
- Figure 2 The extent of Clathrin/APP and AP2/APP colocalization is reduced in NSCs from patients with AD . Confocal microscopy analysis of double staining using rabbit anti-APP and mouse anti-AP2 (A) and mouse anti-Clathrin (B) in control (C18) and AD neurons with PS1 mutations (L286V; M146L; A246E). Colocalization analysis is reported in (C) . The (R) coefficient (Pearson's coefficient) was used for the quantitative and comparative analyses. The extent of colocalization was calculated in at least five separate fields per slide in 10 different slides for each NSCs. The data are expressed as mean +- SEM. Scale bars are 5 mum for APP/AP2 and 6 mum for APP/Clathrin colocalization. Scale bars in high-resolution pictures are 5 mum. Statistically significant differences were calculated by one-way ANOVA and Tukey's post hoc test.
- Conjugate
- Green dye
- Submitted by
- Invitrogen Antibodies (provider)
- Main image
- Experimental details
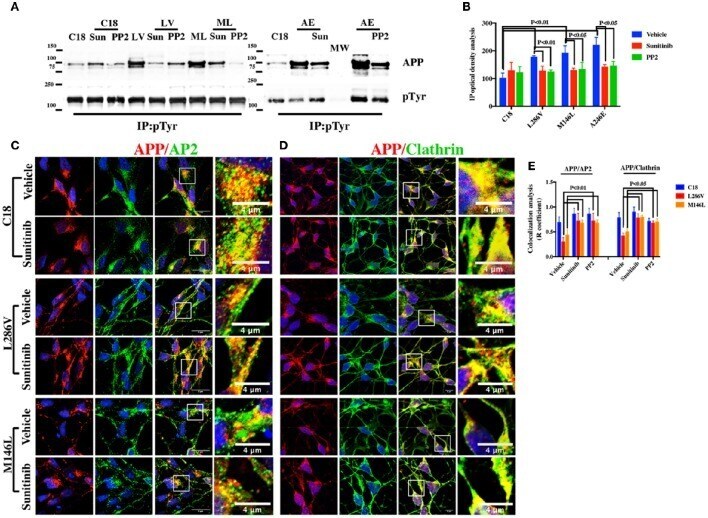
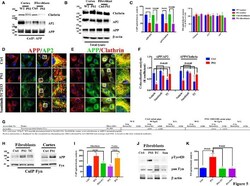
- Figure 3 Tyr kinase inhibitors restore APP colocalization with Clathrin and AP2 in NSCs from patients with AD . (A) IP analysis of control and PS1 neurons that were exposed, or not exposed, to Sunitinib and PP2. Control C18 and AD samples (LV, ML, AE) were immunoprecipitated with anti-pTyr agarose conjugated antibody (4G10) and analyzed with rabbit anti-APP (clone Y188). The image is representative of four independent experiments. Quantification is reported in (B) . Data were normalized with pTyr pulled down levels (input) and expressed as % of C18. Statistically significant differences were calculated by one-way ANOVA for repeated measures followed by Tukey's post hoc test for multiple comparisons. Confocal microscopy analysis of double staining using rabbit anti-APP and mouse anti-AP2 (C) and mouse anti-Clathrin (D) in controls and in neurons carrying L286V or M146L mutation on PS1 gene following exposure to the Tyr kinase inhibitor Sunitinib. The panels are representative of four different experiments performed in triplicate. (E) reports quantitative analysis of APP colocalization to AP2 and Clathrin after 12 h of exposure to Sunitinib. (E) also reports colocalization analysis after PP2 exposure. The (R) coefficient (Pearson's coefficient) was used for the quantitative and comparative analyses. The extent of colocalization was calculated in five separate fields per slide in five different slides for each experimental point. The data are expressed as mean +- SEM.
- Conjugate
- Green dye
- Submitted by
- Invitrogen Antibodies (provider)
- Main image
- Experimental details
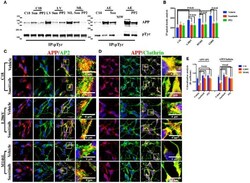
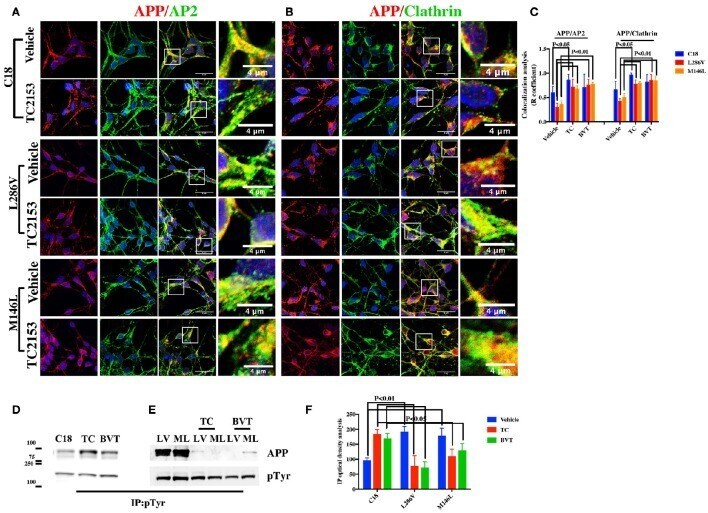
- Figure 4 Tyr phosphatase inhibitors reduce APP colocalization with Clathrin and AP2 and increase phosphorylation of APP Tyr in control neurons . Confocal microscopy analysis of double staining with rabbit anti-APP and mouse anti-AP2 (A) or mouse anti-Clathrin (B) in C18, L286V, and M146L neurons before and after Tyr phosphatase inhibitor (TC2153) exposure. The panels are representative of five different experiments performed in duplicate. (C) Colocalization analysis of APP to AP2 and Clathrin following incubation with TC2153 and BVT948 (BVT) inhibitors in C18 neurons and in AD neurons. The (R) coefficient (Pearson's coefficient) was used for the quantitative and comparative analyses. The extent of colocalization was calculated in five separate fields per slide in four different slides for each experimental point. The data are expressed as mean +- SEM. Scale bars 6 mum and 4 mum. Statistically significant differences were calculated by one-way ANOVA and Tukey's post hoc test. (D,E) . IP analysis of C18 (D) and AD neurons (E) before and after exposure to TC2153 and BVT948 (TC, BVT). Samples were immunoprecipitated with anti-pTyr agarose conjugated antibody (4G10) and analyzed with rabbit anti-APP (clone Y188). Densitometric analysis is reported in (F) . Data were normalized with IgG levels and expressed as % of C18. Statistically significant differences were calculated using Student's t -test.
- Conjugate
- Green dye
- Submitted by
- Invitrogen Antibodies (provider)
- Main image
- Experimental details
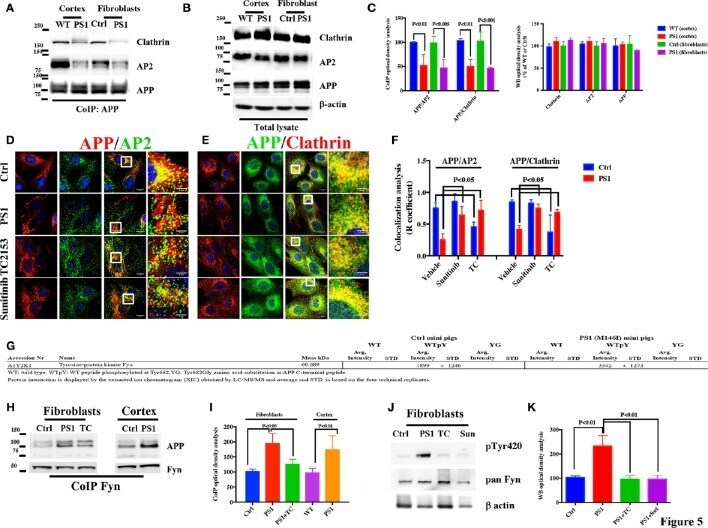
- Figure 5 APP/AP2 and APP/Clathrin binding analysis in cortical tissues and fibroblasts of Gottingen minipigs with a PS1 M146I mutation in the PS1 gene . (A) CoIP analysis of cortical tissues and fibroblasts from control (Ctrl) and PS1 M146I minipigs. Samples were immunoprecipitated with rabbit anti-APP and analyzed with mouse anti-Clathrin (Clath) and mouse anti-AP2. (B) WB analysis of total lysate from controls (WT and Ctrl) and PS1 M146I minipigs. Densitometric analysis is reported in (C) . Data were normalized to the corresponding beta-actin values and expressed as % of Ctrl. Data from CoIP samples were normalized to the corresponding APP input amount and expressed as % of Ctrl. Statistically significant differences were calculated using Student's t -test. (D,E) Confocal microscopy analysis of double staining with rabbit anti-APP and mouse anti-AP2 (D) and mouse anti-Clathrin (E) in fibroblasts from Ctrl and PS1M146I minipigs in the presence of TC2153 or Sunitinib. The panels are representative of five different experiments performed in duplicate in Ctrl and PS1 fibroblasts from two independent control (Ctrl 1-2) and three PS1 (PS1a-c) minipigs. Colocalization analysis is reported in (F) . The (R) coefficient (Pearson's coefficient) was used for the quantitative and comparative analyses. The extent of colocalization was calculated in six separate fields per slide in four different slides for each cell line. Scale bars 1 muM and 5 muM in high magnification. Statis
- Conjugate
- Green dye
- Submitted by
- Invitrogen Antibodies (provider)
- Main image
- Experimental details
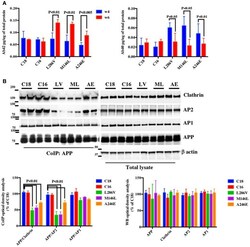
- Figure 1 APP binding to Clathrin and AP2 is compromised in AD neurons. (A) ELISA analysis for secreted Abeta42 (Ab42) and Abeta40 (Ab40) levels from controls (C18 and C16) and AD neurons carrying mutations in the PS1 gene (L286V, M146L, and A246E) after 4 and 6 weeks in culture. Abeta levels were assessed from media after 24 h of plating. Data are expressed as pg/mug (pg/ug) of total protein. Each data point is the mean +- SEM of triplicate determinations of four independent experiments. (B) Co-Immunoprecipitation (CoIP) analysis from controls (C18, C16) and AD neurons (LV, ML, AE). Samples were immunoprecipitated with rabbit anti-APP (clone Y188) and analyzed with mouse anti-Clathrin (clone X22), mouse anti-AP2 (clone AP6), and rabbit anti-AP1 (left panel). The right panel shows total levels of APP, Clathrin, AP2, and AP1 expression in the same samples. Densitometric analysis is reported below. Data from total lysate samples were normalized to the corresponding beta-actin values and expressed as % of C18. Data from IP samples were normalized to the corresponding APP input band and expressed as % of C18. The data are representative of five independent experiments. Statistically significant differences were calculated by one-way ANOVA and Tukey's post hoc test.
- Conjugate
- Green dye

- Submitted by
- Invitrogen Antibodies (provider)
- Main image
- Experimental details
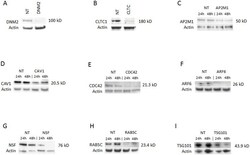
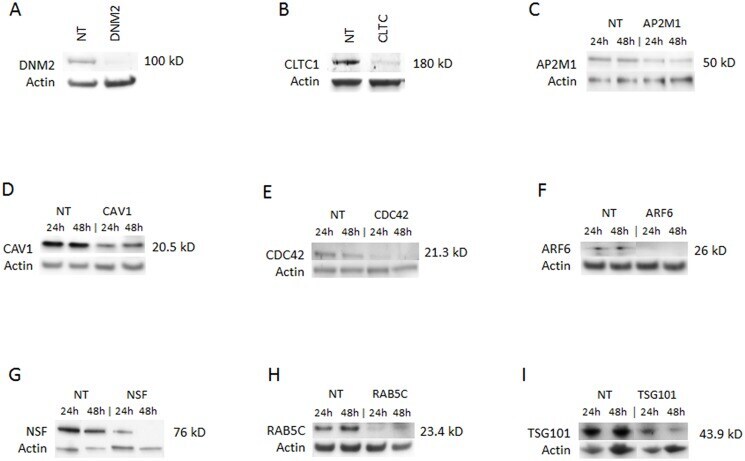
- Fig 2 Knockdown of selected genes required for ANDV infection. Western blots of indicated proteins after knockdown with gene-specific siRNA against (A) dynamin 2 (DNM2); (B) clathrin heavy chain (CLTC); (C) AP2M1; (D) caveolin 1 (CAV1); (E) CDC42; (F) ARF6; (G) NSF; (H) RAB5C; or (I) TSG101; or non-targeting siRNA transfection control (NT). siRNAs were transfected into HMVEC-L at the concentration of 100 nM for 48 h (see Table 1 for more information regarding these genes). The cells were then infected with ANDV (MOI = 0.5) for 24 h or 48 h. Western blots were performed post infection to ensure knockdown of the specific protein expression. Molecular weight of each specific protein is indicated on the right side of each panel. The blots were also probed with beta-actin specific antibody as the gel-loading control. (A) and (B) show only the results collected at 48 h.
- Conjugate
- Green dye
- Submitted by
- Invitrogen Antibodies (provider)
- Main image
- Experimental details
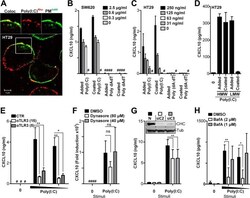
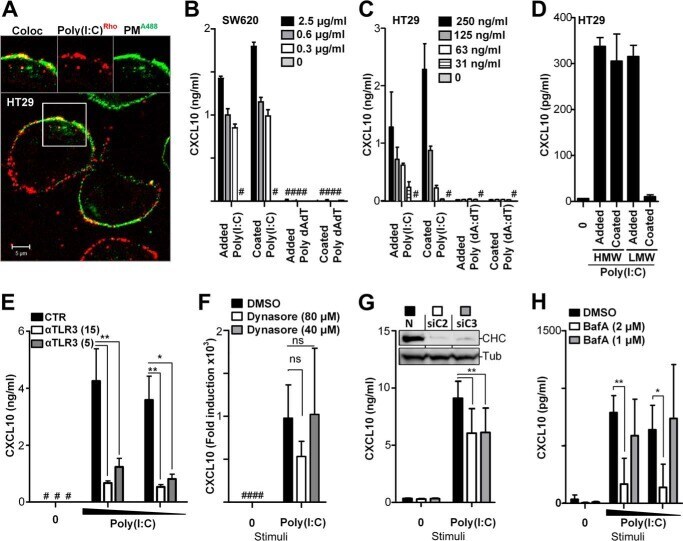
- Figure 5. CXCL10 production in metastatic IECs is elicited independent of poly(I:C) internalization but requires endosomal acidification. A , confocal microscopy image of HT29 cells treated with poly(I:C) Rhodamine ( red , 5 mug/ml) for 2 h before cells were washed and fixed, and the plasma membrane ( PM ) was stained with an antibody against Na,K-ATPase ( PM A488 , green ). Images ( top ) show co-localization ( Coloc , left ) and single tracks of poly(I:C) Rhodamine ( center ) and plasma membrane PM A488 staining ( right ) of the area denoted by the square in the main image. Scale bar = 5 mum. B and C , SW620 ( B ) or HT29 ( C ) cells were treated with poly(I:C) ( Added Poly(I:C) ) or double-stranded DNA dA:dT ( Added dA:dT ) added in solution or by plating cells in wells precoated with poly(I:C) ( Coated Poly(I:C) ) or dA:dT ( Coated dA:dT ) with the given concentrations for 24 h before CXCL10 release was determined by ELISA. D , CXCL10 production in HT29 cells exposed to HMW poly(I:C) or LMW poly(I:C) (2 mug/ml) either added in solution ( Added ) or by plating cells in wells precoated with poly(I:C) ( Coated ) for 21 h. E , CXCL10 release in HT29 cells pretreated with anti-TLR3 (15 or 5 mug/ml) or control goat IgG (15 mug/ml) for 1 h prior to stimulation with poly(I:C) (5 or 2 mug/ml) for 10 h. CXCL10 content in the supernatant was assessed by ELISA. **, p < 0.01; *, p < 0.05 versus cells pretreated with control IgG (two-way ANOVA, Bonferroni post-test). The results in A-D
- Conjugate
- Green dye
- Submitted by
- Invitrogen Antibodies (provider)
- Main image

- Experimental details
- Figure 1 W13-induced PM tubules provide an internalization pathway for beta1-integrin. ( a ) COS1 cells grown on coverslips expressing the membrane marker GFP-mem were incubated with an anti-beta1-integrin rat antibody for 30 minutes at 4 degC to avoid endocytosis, followed by incubation for 10 minutes at 37 degC to allow internalization in the presence of W13 (20 min, 4.5 ug/ml). After fixation, beta1-integrin was detected with an Alexa-555 labeled anti-rat antibody, and images were acquired with a confocal microscope (Leica TCS SP5). The higher magnification insets show beta1-integrin localization in W13-induced tubules (green arrowheads). ( b , c ) Following the same procedure explained as in ( a ), beta1-integrin was detected with an Alexa-647 labeled anti-rat antibody and EEA1 with a specific antibody and the secondary Alexa-555 anti-mouse in untreated ( b ) or W13-treated cells ( c ). Insets show beta1-integrin in EEA1-positive endosomes (red arrowheads) ( b ) or in tubules (green arrowheads) ( c ) (bars, 10 um). ( d , e ) Quantification of internalized beta1-integrin ( d ) and transferrin ( e ), as explained in the Materials and Methods , in COS1 cells expressing GFP-mem or GFP-Rac1 G12V for the indicated conditions (W13t, cells presenting tubules; W13nt, cells without tubules). Mean values +- standard error of the mean (SEM) from three independent experiments are shown. Statistical significance between different conditions and the corresponding control was determined
- Conjugate
- Green dye

- Submitted by
- Invitrogen Antibodies (provider)
- Main image

- Experimental details
- Figure 5 PICALM/clathrin-dependent endocytosis of Abeta-LRP1 complex by brain endothelial cells a-b , Colocalization of LRP1-Abeta40 complex with PICALM ( a ) and clathrin heavy chain (CHC) ( b ) in human brain endothelial cells (BEC) within 30 s of FAM-Abeta40 (250 nM) treatment. c , Immunostaining for LRP1, PICALM and CHC without Abeta (- Abeta). Dapi, nuclear staining (blue). Insets: higher magnification. Bar=10 um. d , Quantification of LRP1 puncta colocalized with PICALM in a, c and with CHC in b, c , and FAM-Abeta40 puncta colocalized with LRP1 and PICALM in a, b . Means +- s.d. from 3 primary isolates in triplicate. p
- Conjugate
- Green dye
