Explore
 Validate
 Learn
Learn Western blot
 Immunohistochemistry
Antibody data
- Antibody Data
- Antigen structure
- References [0]
- Comments [0]
- Validations
- Immunohistochemistry [1]
- Chromatin Immunoprecipitation [2]
Submit
Validation data
Reference
Comment
Report error
- Product number
- PA5-17563 - Provider product page

- Provider
- Invitrogen Antibodies
- Product name
- Phospho-RNA pol II CTD (Ser2, Ser5) Polyclonal Antibody
- Antibody type
- Polyclonal
- Antigen
- Synthetic peptide
- Description
- It is not recommended to aliquot this antibody.
- Reactivity
- Human, Mouse, Rat
- Host
- Rabbit
- Isotype
- IgG
- Vial size
- 100 µL
- Concentration
- 24 µg/mL
- Storage
- -20°C
No comments: Submit comment
Supportive validation
- Submitted by
- Invitrogen Antibodies (provider)
- Main image
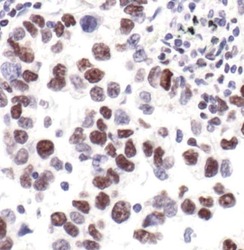
- Experimental details
- Immunohistochemistry was performed on paraffin-embedded human lung carcinoma tissue. To expose target proteins, antigen retrieval was performed by boiling tissue sections in 10mM sodium citrate buffer, pH 6.0 for 10 minutes. Following antigen retrieval, endogenous peroxidase activity was quenched with 3% hydrogen peroxide for 10 minutes, tissues were blocked in 5% normal goat serum in TBST for 1 hour at room temperature, and then probed with a Phospho-Rpb1 CTD (pSer2/5) polyclonal antibody (Product # PA5-17563) at a dilution of 1:25 overnight at 4°C. Detection was performed using an HRP-conjugated anti-rabbit IgG secondary reagent system followed by DAB substrate. Tissues were counterstained with Hematoxylin and visualized by light microscopy.

Supportive validation
- Submitted by
- Invitrogen Antibodies (provider)
- Main image

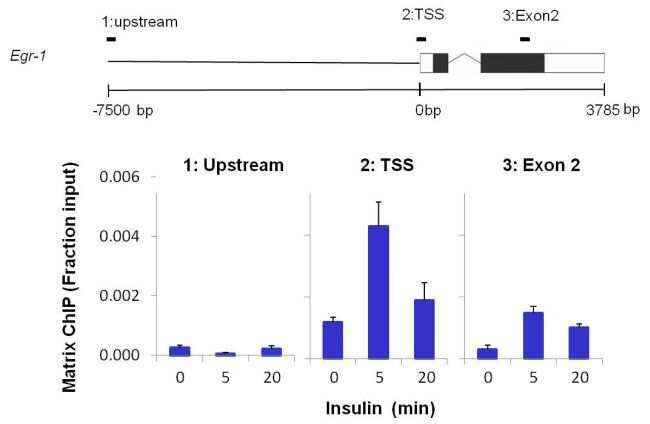
- Experimental details
- Chromatin immunoprecipitation of Phospho-Rpb1 CTD (pSer2/5) was performed on cross-linked chromatin from 1 x 10^6 HTC-IR rat hepatoma cells treated with insulin for 0, 5, or 20 minutes. Immunoprecipitation was performed using a multiplex microplate Matrix ChIP assay (see reference for Matrix ChIP protocol: http://www.ncbi.nlm.nih.gov/pubmed/22098709) with 1 µL/100 µL well volume of a Phospho-Rpb1 CTD (pSer2/5) polyclonal antibody (Product # PA5-17563). Chromatin aliquots from ~1 x 10^5 cells were used per ChIP pull-down. Quantitative PCR data were done in quadruplicate using 1 µL of eluted DNA in 2 µL SYBR real-time PCR reactions containing primers to amplify 7kb upstream of the Egr1 gene, promoter-exon1 (transcription start site, TSS) of Egr1, or exon-2 of Egr1. PCR calibration curves were generated for each primer pair from a dilution series of sheared total rat genomic DNA. Quantitation of immunoprecipitated chromatin is presented as signal relative to the total amount of input chromatin. Results represent the mean +/- SEM for three experiments. A schematic representation of the Egr-1 locus is shown above the data where boxes represent exons (black boxes = translated regions, white boxes = untranslated regions), the zigzag line represents an intron, and the straight line represents upstream sequence. Regions amplified by Egr-1 primers are represented by the black bars above the schematic. Data courtesy of the Innovators Program.
- Submitted by
- Invitrogen Antibodies (provider)
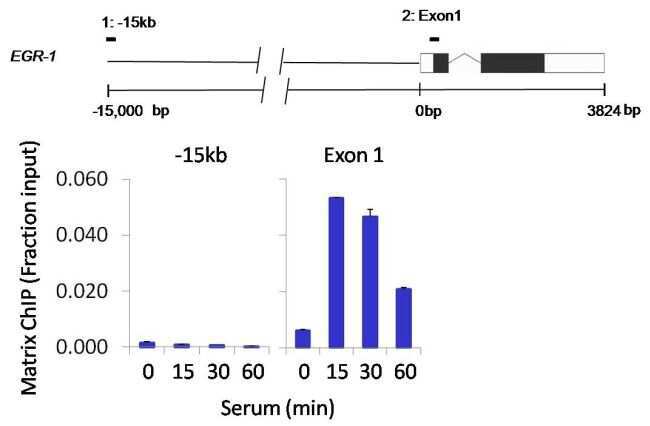
- Main image
- Experimental details
- Chromatin immunoprecipitation analysis of Phospho-Rpb1 CTD pSer2/5 was performed using cross-linked chromatin from 1 x 10⁶ HCT116 colon carcinoma cells treated with serum for 0, 15, 30, and 60 minutes. Immunoprecipitation was performed using a multiplex microplate Matrix ChIP assay (see reference for Matrix ChIP protocol: http://www.ncbi.nlm.nih.gov/pubmed/22098709) with 1.0 µL/100 µL well volume of a Phospho-Rpb1 CTD pSer2/5 polyclonal antibody (Product # PA5-17563). Chromatin aliquots from ~1 x 10⁵ cells were used per ChIP pull-down. Quantitative PCR data were done in quadruplicate using 1 µL of eluted DNA in 2 µL SYBR real-time PCR reactions containing primers to amplify -15kb upstream of the Egr1 gene or exon-1 of Egr1. PCR calibration curves were generated for each primer pair from a dilution series of sheared total genomic DNA. Quantitation of immunoprecipitated chromatin is presented as signal relative to the total amount of input chromatin. Results represent the mean +/- SEM for three experiments. A schematic representation of the Egr-1 locus is shown above the data where boxes represent exons (black boxes = translated regions, white boxes = untranslated regions); the zigzag line represents an intron; and the straight line represents upstream sequence. Regions amplified by Egr-1 primers are represented by black bars. Data courtesy of the Innovators Program.