 Explore
 Validate
 Learn
Learn Western blot
 ELISA
ELISA Other assay
Antibody data
- Antibody Data
- Antigen structure
- References [0]
- Comments [0]
- Validations
- Other assay [3]
Submit
Validation data
Reference
Comment
Report error
- Product number
- M122 - Provider product page

- Provider
- Invitrogen Antibodies
- Product name
- IL-12 p70 Monoclonal Antibody (20C2)
- Antibody type
- Monoclonal
- Antigen
- Recombinant full-length protein
- Description
- M122 targets IL-12 in ELISA, and WB applications and shows reactivity with Human samples. The M122 immunogen is recombinant human IL-12 (p70). M122 detects IL-12 which has a predicted molecular weight of approximately 23 kDa. The M122 IL12 antibody (clone 20C2) has successfully been paired as the coating antibody in a sandwich ELISA with detection antibody M121B (biotinylated conjugate of clone C8.6) Typical dilutions for sandwich ELISA include 1 µg/mL for coating and 0.125 - 0.25 µg/mL for detection. Antibody M122 (clone 20C2) and biotinylated antibody M121B (clone C8.6) have successfully been used in combination with recombinant IL12 p70 protein SIL12 in ELISA applications. This product has been tested for endotoxins by limulus amoebocyte lysate (LAL) assay and contains an endotoxin concentration of less than or equal to 10 endotoxin units per milligram (EU/mg).
- Reactivity
- Human
- Host
- Rat
- Isotype
- IgG
- Antibody clone number
- 20C2
- Vial size
- 500 µg
- Concentration
- 1.0 mg/mL
- Storage
- -20°C
No comments: Submit comment
Supportive validation
- Submitted by
- Invitrogen Antibodies (provider)
- Main image
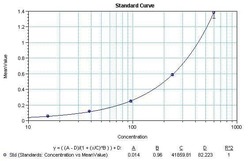
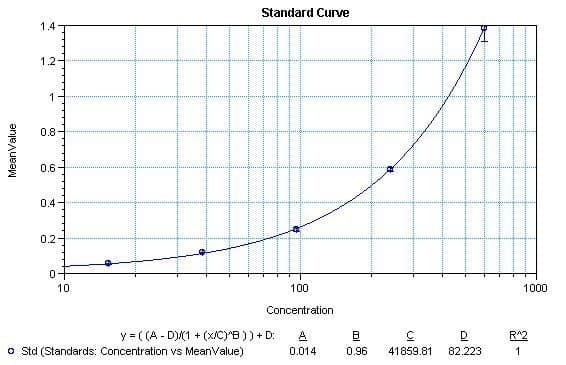
- Experimental details
- Sandwich ELISA analysis of human IL-12 was performed using a Human IL-12 (p70) colorimetric ELISA kit (Product # EHIL12) by loading 50 µL per well of a biotinylated anti-human IL-12 antibody (Product # M121B) in duplicate at 0.03125 µg/mL, and 50 µL per well of Human IL-12 (p70) Recombinant Protein (Product # SIL12) in duplicate at 600, 240, 96, 38.4, 15.4, 0 pg/mL across a 7 µg/mL anti-human IL-12 (Product # M122) pre-coated plate and incubating for 3 hours at room temperature. The plate was washed then incubated with 100 µL per well of Streptavidin-HRP (Product # N504) in all test wells at 1:3,000 for 30 minutes at room temperature. Detection was performed with TMB substrate for 30 minutes at room temperature in the dark. The plate was then stopped with 0.16M sulfuric acid. Absorbances were read on a spectrophotometer at 450-550 nm.
- Submitted by
- Invitrogen Antibodies (provider)
- Main image
- Experimental details
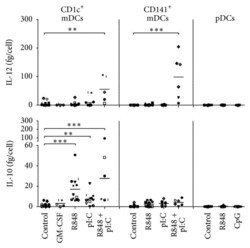
- Figure 2 TLR ligation induces differential cytokine production by human blood DCs. The DCs were stimulated as indicated and cultured overnight at 37degC. IL-10 and IL-12p70 production was analyzed in supernatants of overnight cultures by standard sandwich ELISA ( n >= 6). Each symbol represents one donor (also across the subsets). Significance was determined by Kruskal-Wallis test followed by Dunn's testing comparing different conditions of the same subset ( ** P < .01; *** P < .001).

- Submitted by
- Invitrogen Antibodies (provider)
- Main image

- Experimental details
- Figure 1. Human CD1c + DCs and pDCs cross activate each other. CD1c + DCs and pDCs were cultured overnight, either separately or together, in the presence of indicated stimuli. Maturation was checked on the specific DC subsets within the co-culture. (A) Relative expression of CD86, CD80, PD-L1, and MHC class I and II on pDCs in geometric MFI normalized to pDCs cultured alone with IL-3. (B) Relative expression of CD86, CD80, PD-L1 and MHC class I and II on CD1c + DCs in geometric MFI normalized to CD1c + DCs cultured alone with GM-CSF. (C) IL-12p70, IFN-alpha, and TNF-alpha in supernatants of overnight cultures were analyzed by ELISA. Black bars, pDCs; white bars, CD1c + DCs; gray bars, CD1c + DCs and pDCs. Results are the mean +- SEM of at least five (A, B) or at least three (C) independent experiments. Significance was determined by repeated measures one-way ANOVA, followed by a post-hoc Dunnett's test (* p < 0.05; ** p < 0.01; *** p < 0.001). Only conditions that are significantly different when compared with extra control groups (see Fig. S1) are denoted in the graphs.
