Explore
 Validate
 Learn
Learn711879
antibody from Invitrogen Antibodies
Targeting: OPTN
FIP-2, FIP2, GLC1E, HIP7, HYPL, NRP, TFIIIA-INTP
 Western blot
 Immunocytochemistry
Antibody data
- Antibody Data
- Antigen structure
- References [1]
- Comments [0]
- Validations
- Immunocytochemistry [4]
- Immunohistochemistry [1]
- Other assay [1]
Submit
Validation data
Reference
Comment
Report error
- Product number
- 711879 - Provider product page

- Provider
- Invitrogen Antibodies
- Product name
- Optineurin Recombinant Superclonal™ Antibody
- Antibody type
- Other
- Antigen
- Other
- Description
- This antibody is predicted to react with Monkey, Horse, Cat. Recombinant rabbit Superclonal™ antibodies are unique offerings from Thermo Fisher Scientific. They are comprised of a selection of multiple different recombinant monoclonal antibodies, providing the best of both worlds - the sensitivity of polyclonal antibodies with the specificity of monoclonal antibodies - all delivered with the consistency only found in a recombinant antibody. While functionally the same as a polyclonal antibody - recognizing multiple epitope sites on the target and producing higher detection sensitivity for low abundance targets - a recombinant rabbit Superclonal™ antibody has a known mixture of light and heavy chains. The exact population can be produced in every lot, circumventing the biological variability typically associated with polyclonal antibody production. Note: Formerly called “Recombinant polyclonal antibody”, this product is now rebranded as “Recombinant Superclonal™ antibody”. The physical product and the performance remain unchanged.
- Reactivity
- Human, Mouse, Rat
- Host
- Rabbit
- Isotype
- IgG
- Vial size
- 100 μg
- Concentration
- 0.5 mg/mL
- Storage
- Store at 4°C short term. For long term storage, store at -20°C, avoiding freeze/thaw cycles.
Submitted references Identification of novel lipid droplet factors that regulate lipophagy and cholesterol efflux in macrophage foam cells.
Robichaud S, Fairman G, Vijithakumar V, Mak E, Cook DP, Pelletier AR, Huard S, Vanderhyden BC, Figeys D, Lavallée-Adam M, Baetz K, Ouimet M
Autophagy 2021 Nov;17(11):3671-3689
Autophagy 2021 Nov;17(11):3671-3689
No comments: Submit comment
Supportive validation
- Submitted by
- Invitrogen Antibodies (provider)
- Main image
- Experimental details
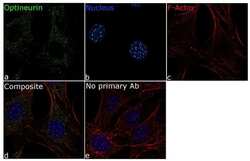
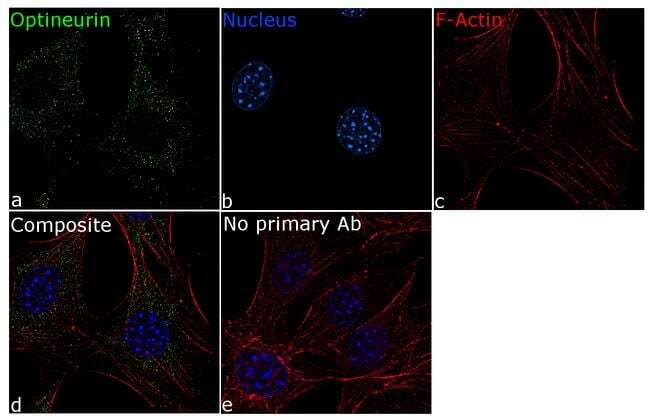
- For immunofluorescence analysis, NIH 3T3 cells were fixed and permeabilized for detection of endogenous Optineurin using Anti- Optineurin Recombinant Rabbit Polyclonal Antibody (Product # 711879, 5 µg/mL) and labeled with Goat anti-Rabbit IgG (H+L) Superclonal™ Secondary Antibody, Alexa Fluor® 488 conjugate (Product # A27034, 1:2000). Panel a) shows representative cells that were stained for detection and localization of Optineurin protein (green), Panel b) is stained for nuclei (blue) using SlowFade® Gold Antifade Mountant with DAPI (Product # S36938). Panel c) represents cytoskeletal F-actin staining using Rhodamine Phalloidin (Product # R415, 1:300). Panel d) is a composite image of Panels a, b and c clearly demonstrating cytoplasmic localization of Optineurin. Panel e) represents control cells without primary antibody to assess background. The images were captured at 60X magnification.

- Submitted by
- Invitrogen Antibodies (provider)
- Main image
- Experimental details
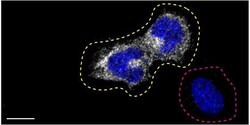
- Immunofluorescence of OPTN was performed using U2OS wild-type and OPTN KO cells that were transfected with a green or a deep red fluorescent dye, respectively. Post-transfection, WT and KO cells were mixed and plated to a 1:1 ratio on coverslips as a mosaic and incubated for 24 hrs. Cells were fixed in 4% PFA (in PBS) for 15 min; cells were permeabilized with 0.1% Triton X-100 for 10 min at RT and blocked with PBS with 5% BSA, 5% goat serum, and 0.01% Triton X-100 for 30 min. Cells were stained with the OPTN Recombinant Rabbit Superclonal™ antibody (Product # 711879) at a 1:500 dilution overnight at 4°C. Secondary antibody incubation was performed using 1 µg/mL of Goat anti-Rabbit IgG (H+L) Highly Cross-Adsorbed Secondary Antibody, Alexa Fluor 555 antibody (Product # A21429) together with DAPI for 1 hr. Imaging was performed with a 40X oil objective and analysis was performed using Image J. Cell image represents a single focal plane; WT and KO cells are outlined with a yellow (WT) or magenta (KO) dashed line. Data courtesy of YCharOS Inc., an open science company with the mission of characterizing commercially available antibodies using knockout validation.

- Submitted by
- Invitrogen Antibodies (provider)
- Main image
- Experimental details
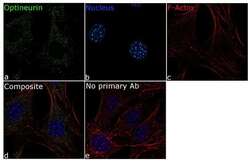
- For immunofluorescence analysis, NIH 3T3 cells were fixed and permeabilized for detection of endogenous Optineurin using Anti- Optineurin Recombinant Rabbit Superclonal™ Antibody (Product # 711879, 5 µg/mL) and labeled with Goat anti-Rabbit IgG (Heavy Chain) Superclonal™ Secondary Antibody, Alexa Fluor® 488 conjugate (Product # A27034, 1:2000). Panel a) shows representative cells that were stained for detection and localization of Optineurin protein (green), Panel b) is stained for nuclei (blue) using SlowFade® Gold Antifade Mountant with DAPI (Product # S36938). Panel c) represents cytoskeletal F-actin staining using Rhodamine Phalloidin (Product # R415, 1:300). Panel d) is a composite image of Panels a, b and c clearly demonstrating cytoplasmic localization of Optineurin. Panel e) represents control cells without primary antibody to assess background. The images were captured at 60X magnification.
- Submitted by
- Invitrogen Antibodies (provider)
- Main image

- Experimental details
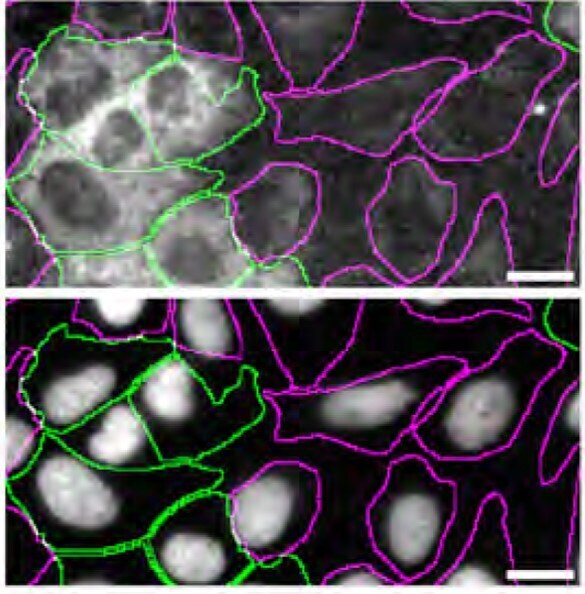
- Immunofluorescence of optineurin was performed using U2OS WT and OPTN KO cells that were labeled with a green or a far-red fluorescent dye, respectively. Post-labeling, WT and KO cells were mixed and plated to a 1:1 ratio in a 96-well plate with an optically clear flat bottom as a mosaic and incubated for 24 hrs. Cells were fixed in 4% PFA (in PBS) for 15 min at RT; cells were permeabilized with 0.1% Triton X-100 for 10 min at RT and blocked with PBS containing 5% BSA, 5% goat serum, and 0.01% Triton X-100 for 30 min at RT. Cells were stained with Optineurin Recombinant Rabbit Superclonal™ Antibody (Product # 711879) at a 1:250 dilution overnight at 4 degrees Celcius. Secondary antibody incubation was performed using 1 µg/mL of Goat anti-Rabbit IgG (H+L) Highly Cross-Adsorbed Secondary Antibody, Alexa Fluor™ 555 (Product # A-21429) together with DAPI for 1 hr at RT. Imaging was performed with a 20X water immersion objective. Representative images where WT and KO cells are outlined with a green (WT) or magenta (KO) line, respectively, are shown. The top and bottom panels show antibody and DAPI stainings, respectively. Scale bar = 10 μm. Data courtesy of YCharOS Inc., an open science company with the mission of characterizing commercially available antibodies using knockout validation.
Supportive validation
- Submitted by
- Invitrogen Antibodies (provider)
- Main image
- Experimental details
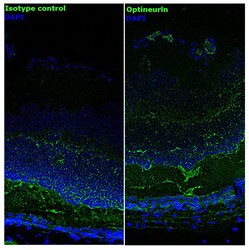
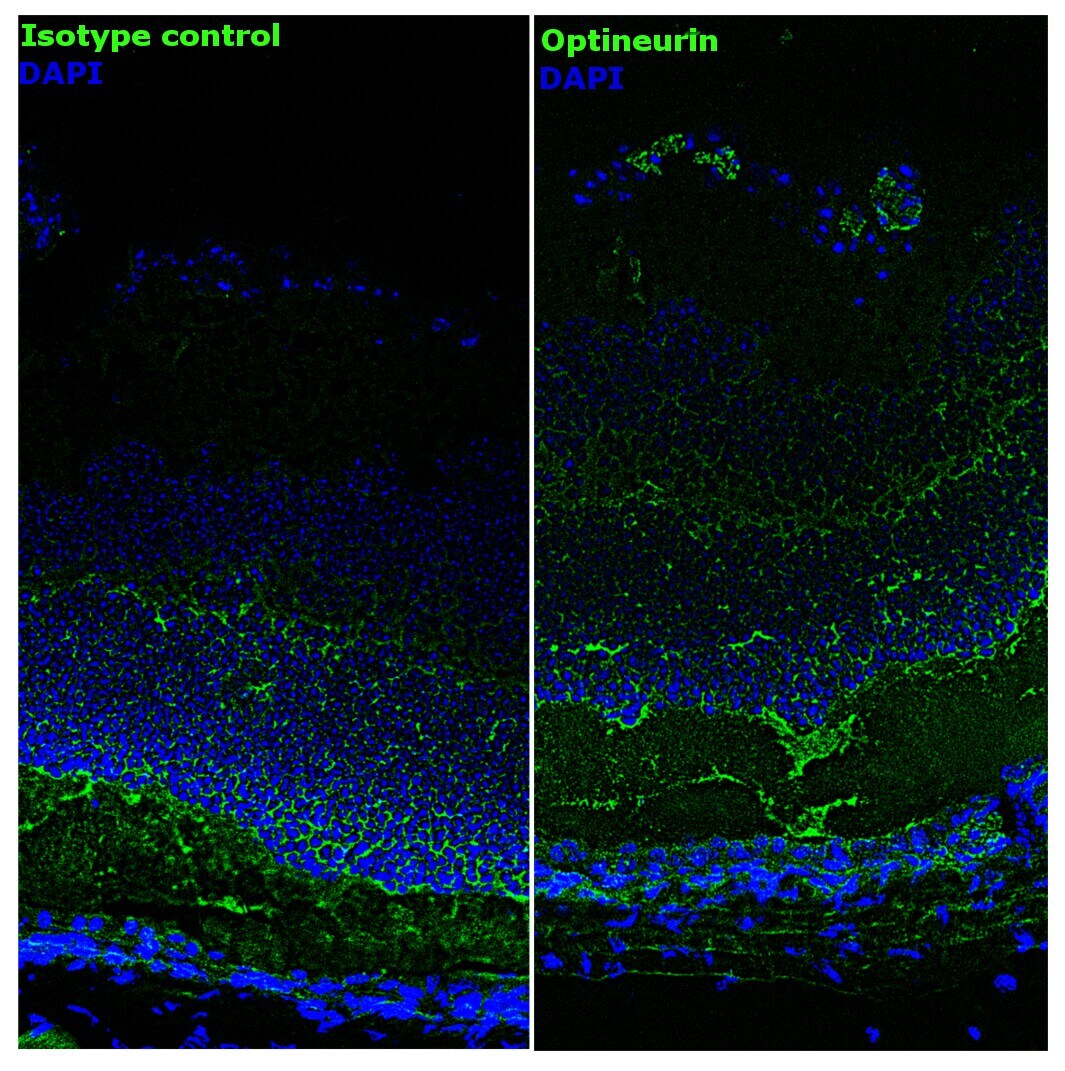
- Immunofluorescence analysis of mouse Retina tissue: Frozen sections were fixed with 4% PFA for 20 min, permeabilized using 0.1% Triton-X 100 for 10 mins and blocked for 1 hour with 2% BSA. Transverse sections of mouse Retina were incubated with Anti-Optineurin Recombinant Rabbit Superclonal™ Antibody (Product # 711879, 1:250 dilution) overnight at 4°C, followed by Goat anti-Rabbit IgG (Heavy Chain) Superclonal™ Secondary Antibody, Alexa Fluor® 488 conjugate (Product # A27034, 1:2000, 45 mins). Nuclei (blue) were stained using SlowFade® Gold Antifade Mountant with DAPI (Product # S36938), Panel a) represents staining with the matched isotype control. Panel b) shows a representative mouse retinal section stained for Optineurin (green). The images were captured at 20X magnification.
Supportive validation
- Submitted by
- Invitrogen Antibodies (provider)
- Main image
- Experimental details
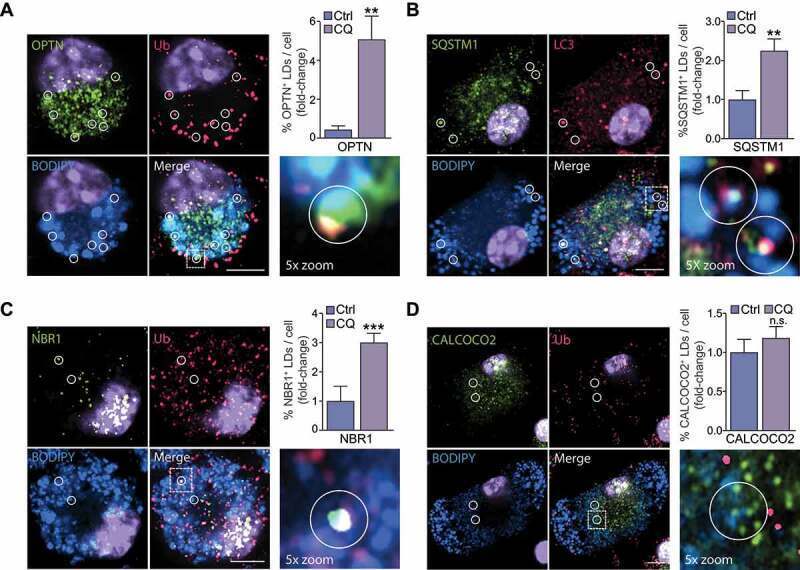
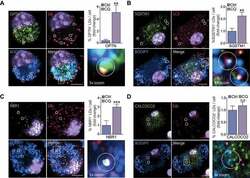
- Figure 4. Selective autophagy receptors (SARs) OPTN, NBR1 and SQSTM1 selectively localize to foam cell lipid droplets (LDs). (A-D) Immunostaining for OPTN (A), SQSTM1 (B), NBR1 (C) or CALCOCO2 (D) in agLDL-loaded mouse bone marrow-derived macrophage foam cells stained with BODIPY 493/503 to label LD neutral lipids, with areas of interest circled. At right, quantification of the percent of cellular LDs tagged with SARs in chloroquine-treated cells (CQ) as compared to control (Ctrl) is shown. Data are expressed as fold-change for the chloroquine treatment relative to untreated from one experiment representative of 3 independent experiments with similar results (mean +- s.e.m). ** P < 0.005, *** P < 0.0005. Representative images are from CQ-treated cells. Scale bar: 5 mum