 Explore
 Validate
 Learn
Learn Western blot
Antibody data
- Antibody Data
- Antigen structure
- References [7]
- Comments [0]
- Validations
- Western blot [5]
- Immunocytochemistry [2]
- Immunohistochemistry [4]
- Other assay [11]
Submit
Validation data
Reference
Comment
Report error
- Product number
- PA5-27650 - Provider product page

- Provider
- Invitrogen Antibodies
- Product name
- XBP1 Polyclonal Antibody
- Antibody type
- Polyclonal
- Antigen
- Recombinant protein fragment
- Description
- Recommended positive controls: 293T, A431, HeLa, HepG2, HepG2 (3 µM Thapsigargin treatment for 24 hr).
- Concentration
- 0.93 mg/mL
Submitted references The Role of Selenoproteins SELENOM and SELENOT in the Regulation of Apoptosis, ER Stress, and Calcium Homeostasis in the A-172 Human Glioblastoma Cell Line.
MicroRNA-210 Regulates Endoplasmic Reticulum Stress and Apoptosis in Porcine Embryos.
Adiponectin Improves In Vitro Development of Cloned Porcine Embryos by Reducing Endoplasmic Reticulum Stress and Apoptosis.
Zinc supplementation alleviates endoplasmic reticulum stress during porcine oocyte in vitro maturation by upregulating zinc transporters.
EGFR targeting enhances the efficiency of chemotherapy through inhibiting IRE1α-XBP1s pathway in colorectal cancer cells.
IRE1α Promotes Zika Virus Infection via XBP1.
CCDC170 affects breast cancer apoptosis through IRE1 pathway.
Varlamova EG, Goltyaev MV, Turovsky EA
Biology 2022 May 25;11(6)
Biology 2022 May 25;11(6)
MicroRNA-210 Regulates Endoplasmic Reticulum Stress and Apoptosis in Porcine Embryos.
Ridlo MR, Kim EH, Kim GA
Animals : an open access journal from MDPI 2021 Jan 18;11(1)
Animals : an open access journal from MDPI 2021 Jan 18;11(1)
Adiponectin Improves In Vitro Development of Cloned Porcine Embryos by Reducing Endoplasmic Reticulum Stress and Apoptosis.
Ridlo MR, Kim EH, Taweechaipaisankul A, Lee BC, Kim GA
Animals : an open access journal from MDPI 2021 Feb 10;11(2)
Animals : an open access journal from MDPI 2021 Feb 10;11(2)
Zinc supplementation alleviates endoplasmic reticulum stress during porcine oocyte in vitro maturation by upregulating zinc transporters.
Ridlo MR, Kim GA, Taweechaipaisankul A, Kim EH, Lee BC
Journal of cellular physiology 2021 Apr;236(4):2869-2880
Journal of cellular physiology 2021 Apr;236(4):2869-2880
EGFR targeting enhances the efficiency of chemotherapy through inhibiting IRE1α-XBP1s pathway in colorectal cancer cells.
Huo M, Zhao Y, Liu X, Gao Y, Zhang D, Chang M, Liu M, Xu N, Zhu H
Journal of Cancer 2020;11(15):4464-4473
Journal of Cancer 2020;11(15):4464-4473
IRE1α Promotes Zika Virus Infection via XBP1.
Kolpikova EP, Tronco AR, Hartigh ABD, Jackson KJ, Iwawaki T, Fink SL
Viruses 2020 Mar 3;12(3)
Viruses 2020 Mar 3;12(3)
CCDC170 affects breast cancer apoptosis through IRE1 pathway.
Wang Q, Zhao Y, Zheng H, Wang Q, Wang W, Liu B, Han H, Zhang L, Chen K
Aging 2020 Dec 3;13(1):1332-1356
Aging 2020 Dec 3;13(1):1332-1356
No comments: Submit comment
Supportive validation
- Submitted by
- Invitrogen Antibodies (provider)
- Main image
- Experimental details
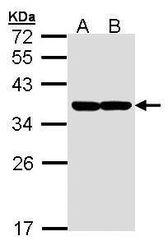
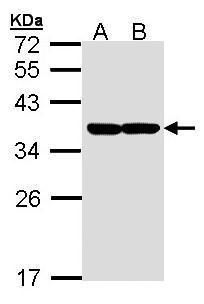
- Western blot analysis of XBP1 using 30 µg of A) MOLT4 and B) Raji lysate. Samples were loaded onto a 12% SDS-PAGE gel and probed with a XBP1 polyclonal antibody (Product # PA5-27650) at a dilution of 1:1000.
- Submitted by
- Invitrogen Antibodies (provider)
- Main image
- Experimental details
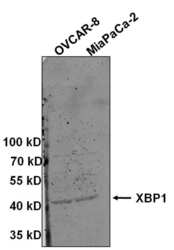
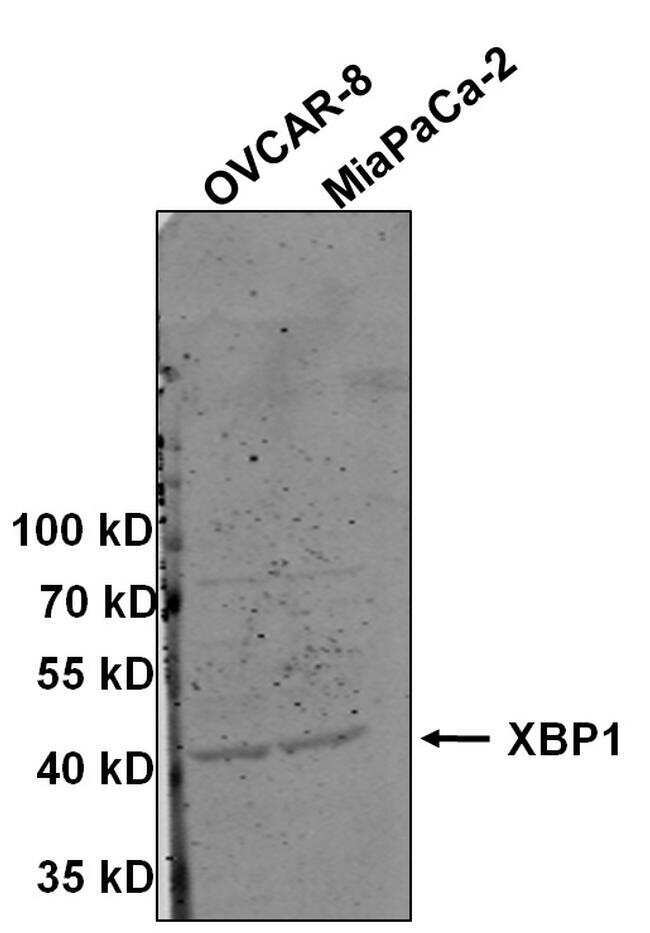
- Western blot analysis of XBP1 was performed by loading 35 µg of OVCAR-8 lysate (lane 1) and 40 µg of MiaPaCa-2 lysate (lane 2) in reducing sample buffer and Page Rµler Protein Ladder (Product # 26616) onto a 10% polyacrylamide gel. Proteins were transferred to PVDF membrane using the wet transfer method. Membrane was blocked in Starting Block Blocking Buffer (Product # 37542). XBP1 was detected at approximately 42 kDa using a XBP1 polyclonal antibody (Product # PA5-27650) at a dilution of 1:1000 in 5% BSA, followed by a goat anti-rabbit IgG DyLight 800 conjugated secondary antibody (Product # SA5-35571) at a dilution of 1:7000. Data courtesy of Antibody Data Exchange Program.
- Submitted by
- Invitrogen Antibodies (provider)
- Main image
- Experimental details
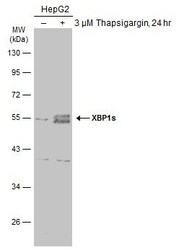
- Western Blot analysis of XBP1 was performed by separating 30 µg of untreated (–) and treated (+) HepG2 whole cell extracts by 10% SDS-PAGE. Proteins were transferred to a membrane and probed with a XBP1 Polyclonal Antibody (Product # PA5-27650) at a dilution of 1:1000.
- Submitted by
- Invitrogen Antibodies (provider)
- Main image
- Experimental details
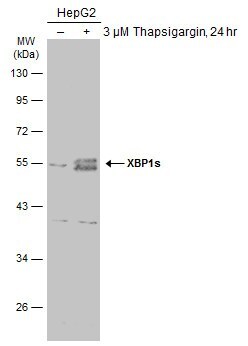
- Western Blot using XBP1 Polyclonal Antibody (Product # PA5-27650). Untreated (–) and treated (+) HepG2 whole cell extracts (30 µg) were separated by 10% SDS-PAGE, and the membrane was blotted with XBP1 Polyclonal Antibody (Product # PA5-27650) diluted at 1:1,000. The HRP-conjugated anti-rabbit IgG antibody was used to detect the primary antibody.
- Submitted by
- Invitrogen Antibodies (provider)
- Main image

- Experimental details
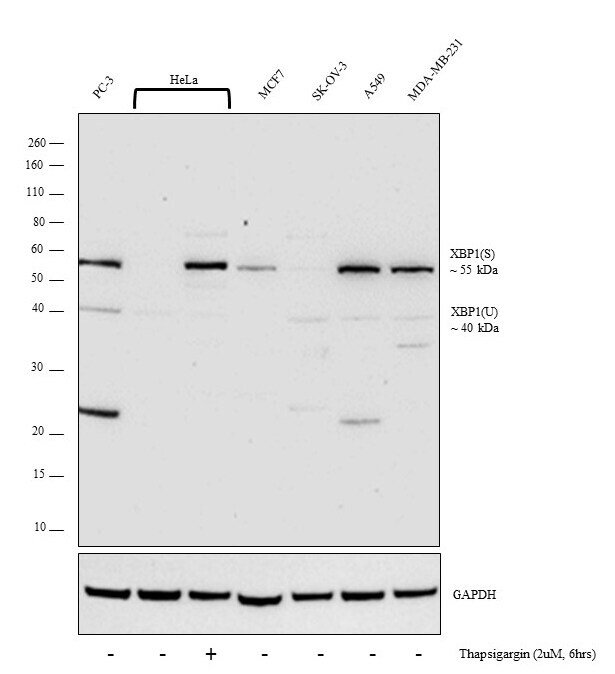
- Western blot analysis was performed on whole cell extract (30 µg lysate) of PC3 (Lane 1), HeLa (Lane 2), HeLa treated with thapsigargin (2uM, 6hrs) (Lane 3), MCF7 (Lane 4), SKOV3 (Lane 5), A549 (Lane 6), and MDA-MB-231 (Lane 7). The blot was probed with Anti-XBP1 Polyclonal Antibody (Product # PA5-27650, 1:3000 dilution) and detected by chemiluminescence using Goat anti-Rabbit IgG (H+L) Superclonal™ Secondary Antibody, HRP conjugate (Product # A27036, 0.25 µg/ml, 1:4000 dilution). A 55 kDa band corresponding to spliced isoform XBP1(S) was detected as the dominant band and the unspliced form XBP1(U) at 40 kDa (upon accumulation of unfolded proteins in the endoplasmic reticulum (ER), the mRNA of this gene is processed to an active form by an unconventional splicing mechanism that is mediated by the endonuclease inositol-requiring enzyme 1 (IRE1). The resulting loss of 26 nt from the spliced mRNA causes a frame-shift and an isoform XBP1(S), which is the functionally active transcription factor. The isoform encoded by the unspliced mRNA, XBP1(U), is constitutively expressed, and thought to function as a negative feedback regulator of XBP1(S), which shuts off transcription of target genes during the recovery phase of ER stress). The antibody also detected unexplained protein at ~25kDa in PC3, SKOV3 and A549.
Supportive validation
- Submitted by
- Invitrogen Antibodies (provider)
- Main image

- Experimental details
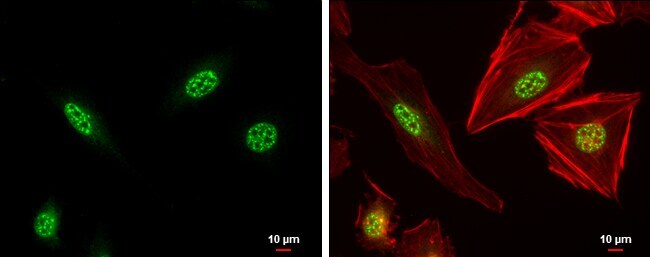
- Immunocytochemistry-Immunofluorescence analysis of XBP1 was performed in HeLa cells fixed in 4% paraformaldehyde at RT for 15 min. Green: XBP1 Polyclonal Antibody (Product # PA5-27650) diluted at 1:500. Red: phalloidin, a cytoskeleton marker. Blue: Hoechst 33342 staining. Scale bar = 10 µm.
- Submitted by
- Invitrogen Antibodies (provider)
- Main image
- Experimental details
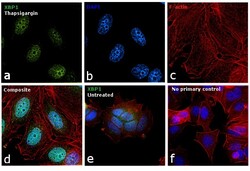
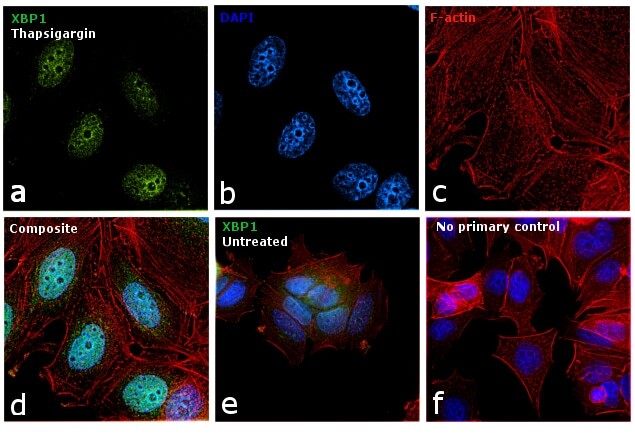
- Immunofluorescence analysis of XBP1 was performed using 70% confluent log phase MCF7 cells treated with thapsigargin (2uM, 6hrs). The cells were fixed with 4% paraformaldehyde for 10 minutes, permeabilized with 0.1% Triton™ X-100 for 15 minutes, and blocked with 1% BSA for 1 hour at room temperature. The cells were labeled with XBP1 Polyclonal Antibody (Product # PA5-27650) at 1:200 dilution in 0.1% BSA, incubated at 4 degree Celsius overnight and then labeled with Goat anti-Rabbit IgG (H+L) Superclonal™ Secondary Antibody, Alexa Fluor® 488 conjugate (Product # A27034) at a dilution of 1:2000 for 45 minutes at room temperature (Panel a: green). Nuclei (Panel b: blue) were stained with SlowFade® Gold Antifade Mountant with DAPI (Product # S36938). F-actin (Panel c: red) was stained with Rhodamine Phalloidin (Product # R415, 1:300). Panel d represents the merged image showing nuclear localization. Panel e represents untreated MCF7 cells. Panel f represents control cells with no primary antibody to assess background. The images were captured at 60X magnification.
Supportive validation
- Submitted by
- Invitrogen Antibodies (provider)
- Main image
- Experimental details
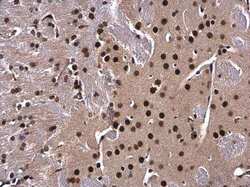
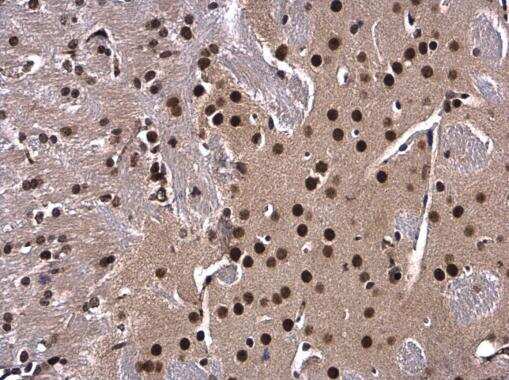
- Immunohistochemistry (Paraffin) analysis of XBP1 was performed in paraffin-embedded mouse brain tissue using XBP1 Polyclonal Antibody (Product # PA5-27650) at a dilution of 1:500.
- Submitted by
- Invitrogen Antibodies (provider)
- Main image
- Experimental details
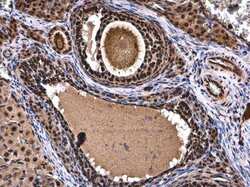
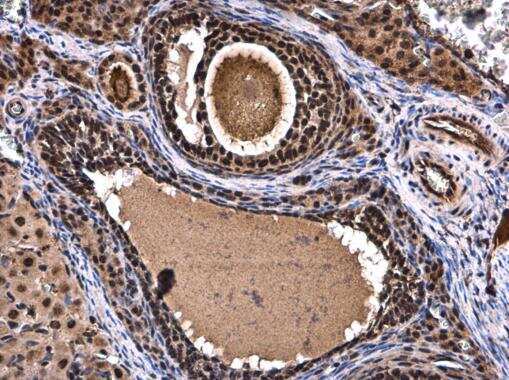
- Immunohistochemistry (Paraffin) analysis of XBP1 was performed in paraffin-embedded rat ovary tissue using XBP1 Polyclonal Antibody (Product # PA5-27650) at a dilution of 1:500.
- Submitted by
- Invitrogen Antibodies (provider)
- Main image
- Experimental details
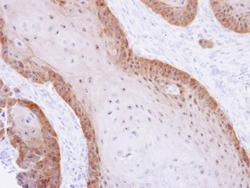
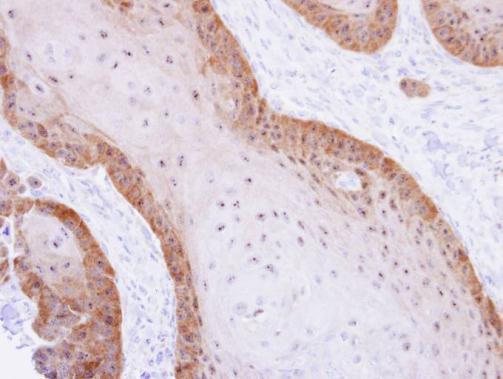
- Immunohistochemical analysis of paraffin-embedded Cal27 xenograft, using XBP1 (Product # PA5-27650) antibody at 1:500 dilution. Antigen Retrieval: Citrate buffer, pH 6.0, 15 min.
- Submitted by
- Invitrogen Antibodies (provider)
- Main image
- Experimental details
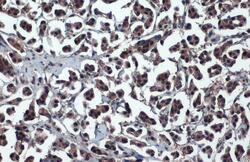
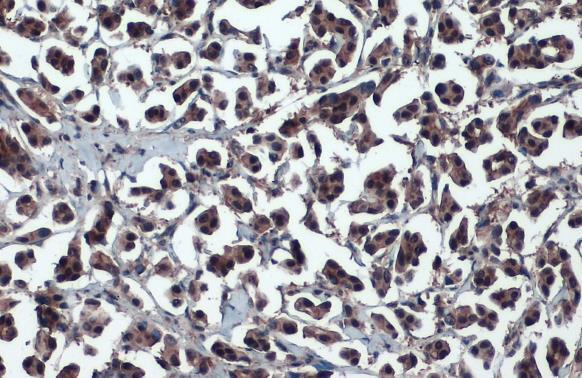
- XBP1 Polyclonal Antibody detects XBP1 protein at cytoplasm and nucleus by immunohistochemical analysis. Sample: Paraffin-embedded human breast carcinoma. XBP1 stained by XBP1 Polyclonal Antibody (Product # PA5-27650) diluted at 1:1,000. Antigen Retrieval: Citrate buffer, pH 6.0, 15 min.
Supportive validation
- Submitted by
- Invitrogen Antibodies (provider)
- Main image

- Experimental details
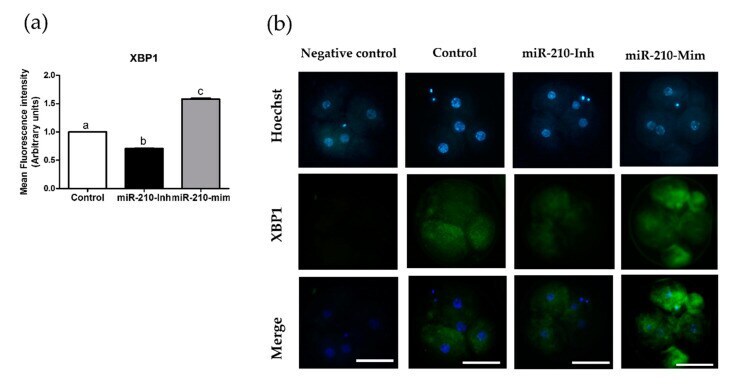
- Figure 1 Expression levels of XBP1 , shown as fluorescence intensity at cleavage stage of microinjected embryos. ( a ) Chart showing the assessment of fluorescence intensity of XBP1 . At least 24 embryos per group from four biological replicates were analyzed. Data are presented as mean +- SEM. Treatment groups pointed out with letters are considered to be statistically significant ( p < 0.05). ( b ) Images showing immunofluorescence staining of embryos (green) in the control, miR-210-inhibitor, and miR-210-mimic treatment groups. Hoechst staining was used to stain DNA (blue), and merged images were created to demonstrate colocalization (scale bars 50 mum; 400x magnification). miR-210-Inh, micro-RNA-inhibitor; miR-210-Mim, micro-RNA-mimic; SEM, standard error of mean.
- Submitted by
- Invitrogen Antibodies (provider)
- Main image
- Experimental details
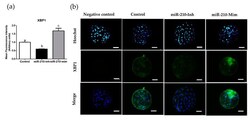
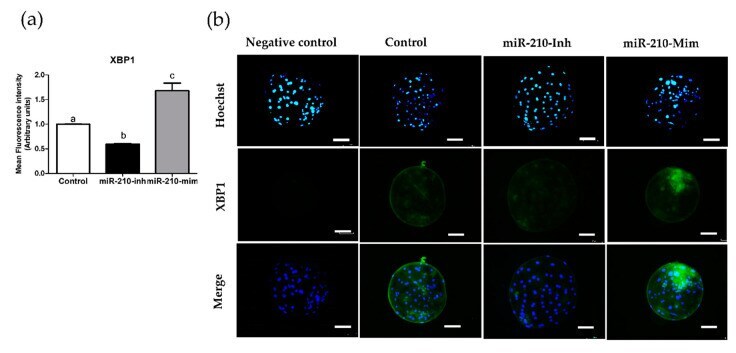
- Figure 2 Expression levels of XBP1 , shown as fluorescence intensity in blastocysts of microinjected embryos. ( a ) Chart showing the assessment of fluorescence intensity of XBP1 . At least 20 embryos per group from four biological replicates were analyzed. Data are presented as mean +- SEM. Treatment groups pointed out with letters are considered to be statistically significant ( p < 0.05). ( b ) Images showing immunofluorescence staining of blastocysts (green) in the control, miR-210-inhibitor, and miR-210-mimic treatment groups. Hoechst staining was used to stain DNA (blue), and merged images were created to demonstrate colocalization (scale bars 50 mum; 400x magnification). miR-210-Inh, micro-RNA-inhibitor; miR-210-Mim, micro-RNA-mimic; SEM, standard error of mean.
- Submitted by
- Invitrogen Antibodies (provider)
- Main image

- Experimental details
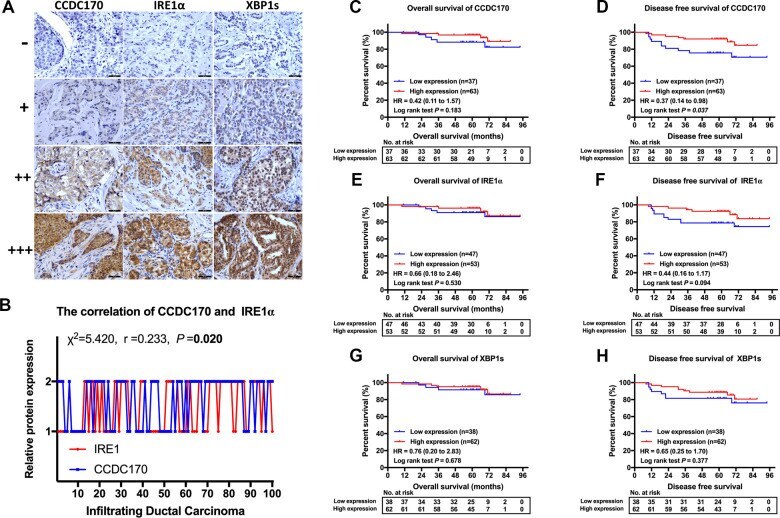
- Figure 2 IHC stain and the prognosis value of CCDC170, IRE1alpha and XBP1s in breast cancer tissues. ( A ) Representative IHC staining of CCDC170, IRE1alpha and XBP1s. Scale bar: 50mum. ( B ) The correlation between CCDC170 and IRE1alpha levels in breast cancer tissues (r = 0.233, P = 0.020). 1, 2 represented low expression (0-2 staining index) and high expression (3-12 staining index) respectively. n = 100 cases. ( C, D ) The CCDC170 high-expression group exhibited better DFS ( P = 0.037), but no significance in OS ( P = 0.183). ( E, F ) The expression of IRE1alpha showed no significance in OS ( P = 0.530) and DFS ( P = 0.094). ( G, H ) The expression of XBP1s showed no significance in OS ( P = 0.678) and DFS ( P = 0.377).
- Submitted by
- Invitrogen Antibodies (provider)
- Main image
- Experimental details
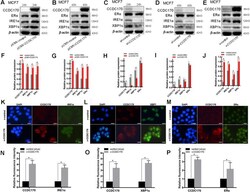
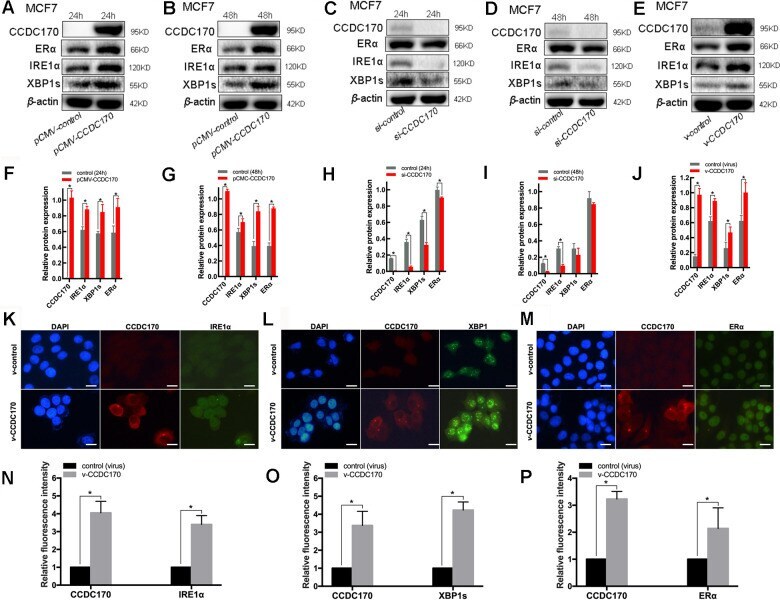
- Figure 3 The protein expression of CCDC170, IRE1alpha and XBP1s in MCF7 breast cancer cells. Representative western blot bands and analysis at 24h ( A, F ) and 48h ( B, G ) of CCDC170 up-regulation, 24h ( C, H ) and 48h ( D, I ) of CCDC170 down-regulation. Representative western blot bands ( E ) and analysis ( J ) in MCF7 breast cancer cells that stably overexpressed CCDC170. beta -actin was used as a reference for calculating the relative protein expression. Representative immunofluorescence images and analysis of IRE1alpha ( K, N ), XBP1s ( L, O ) and ERalpha ( M , P ) in CCDC170-stably-overexpressing MCF7 cells. Scale bar: 50mum. pCMV-CCDC170(control) represented CCDC170-transiently-overexpressing MCF7 cells and controls. v-CCDC170(control) represented CCDC170-stably-overexpressing MCF7 cells and controls. si-CCDC170(control) represented cells with siRNA-mediated knockdown of CCDC170 and the controls. The error bars presented as mean +- Standard Error of Mean (SEM) with analysis of unpaired Student's t-test. * P < 0.05, compared with control group.
- Submitted by
- Invitrogen Antibodies (provider)
- Main image
- Experimental details
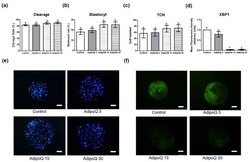
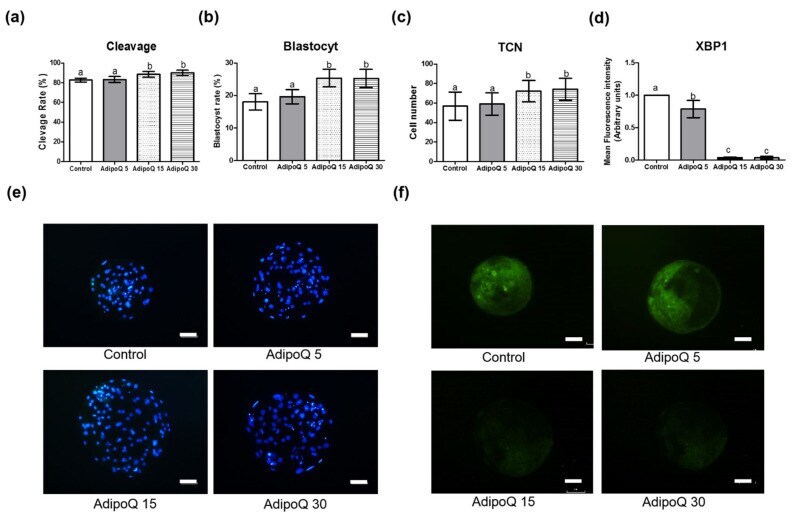
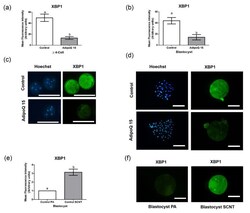
- Figure 1 Effect of adiponectin supplementation of various concentrations during in vitro culture of parthenogenetic activation embryos on cleavage rate ( a ), blastocyst formation rate ( b ), total cell numbers ( c ), and protein expression of XBP1 ( d ); Hoechst staining of blastocysts (Scale bars 50 mum) ( e ) and XBP1 immunofluorescence (scale bars 50 mum) ( f ). Data are expressed as mean +- SD. a,b Bars with different letters indicate significant difference ( p < 0.05). The experiment was performed as at least three independent replicates. AdipoQ 5 = adiponectin 5 mug/mL; AdipoQ 15 = adiponectin 15 mug/mL; AdipoQ 30 = adiponectin 30 mug/mL. TCN, total cell number of blastocysts.
- Submitted by
- Invitrogen Antibodies (provider)
- Main image
- Experimental details
- Figure 2 Effect of 15 mug/mL adiponectin supplementation during in vitro culture of somatic cell nuclear transfer (SCNT) embryos on the protein expression of XBP1 in >=4-cell embryos on day-2 ( a ) and in blastocysts ( b ); Hoechst (blue) and immunofluorescence (green) staining of control and adiponectin-treated >=4-cell embryos (scale bars 200 mum) ( c ) and blastocysts (scale bars 100 mum) ( d ). Comparison of XBP1 expression in the blastocyst stage derived from parthenogenetic activation and SCNT (scale bars 100 mum) ( e , f ). At least 24 embryos per group from 4 biological replicates were analyzed in each experiment. Data are expressed as mean +- SD. a,b Values with letters indicate significant difference ( p < 0.05). The experiment was performed as at least three independent replicates. AdipoQ 15 = adiponectin 15 mug/mL.

- Submitted by
- Invitrogen Antibodies (provider)
- Main image
- Experimental details
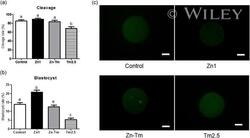
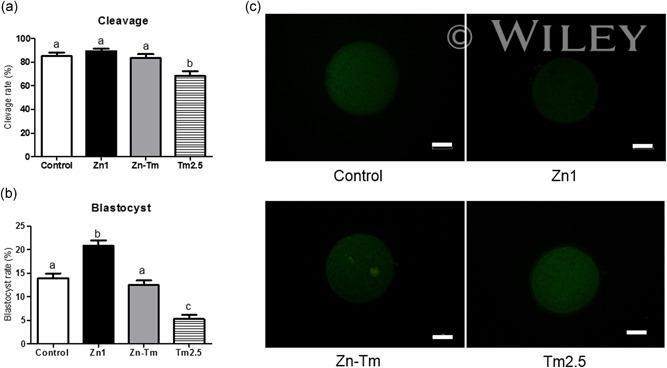
- 3 Figure Effect of zinc supplementation under endoplasmic reticulum stress during in vitro maturation (IVM) on subsequent embryo development measured by cleavage and blastocyst formation rates (a, b). XBP1 immunofluorescence (IF) staining of oocytes after IVM. Scale bars = 50 mum (c). Data are shown as the mean +- SEM . Bars with letters indicate significant differences ( p < .05). At least three independent experiments were performed. Zn1 = zinc 1 mug/ml; Zn-Tm = zinc 1 mug/ml + Tm 2.5 mug/ml; Tm2.5 = Tm 2.5 mug/ml
- Submitted by
- Invitrogen Antibodies (provider)
- Main image

- Experimental details
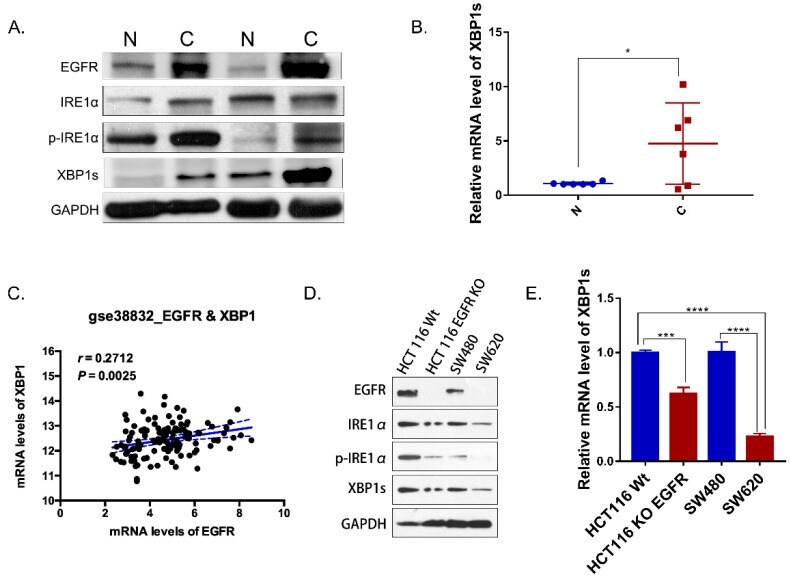
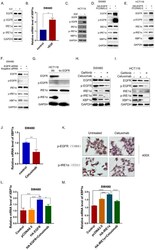
- Figure 1 IRE1alpha-XBP1s pathway and EGFR expression in colorectal cancer. A. Immunoblotting of EGFR, IRE1alpha and XBP1s in paired tumor and normal tissues of colorectal cancer patients. GAPDH was used as a loading control. B. Expression of spliced XBP1 mRNA in 6 paired patient samples via q-PCR (n=6). Values are represented as the mean +- SD (n = 3) for each treatment (*P
- Submitted by
- Invitrogen Antibodies (provider)
- Main image
- Experimental details
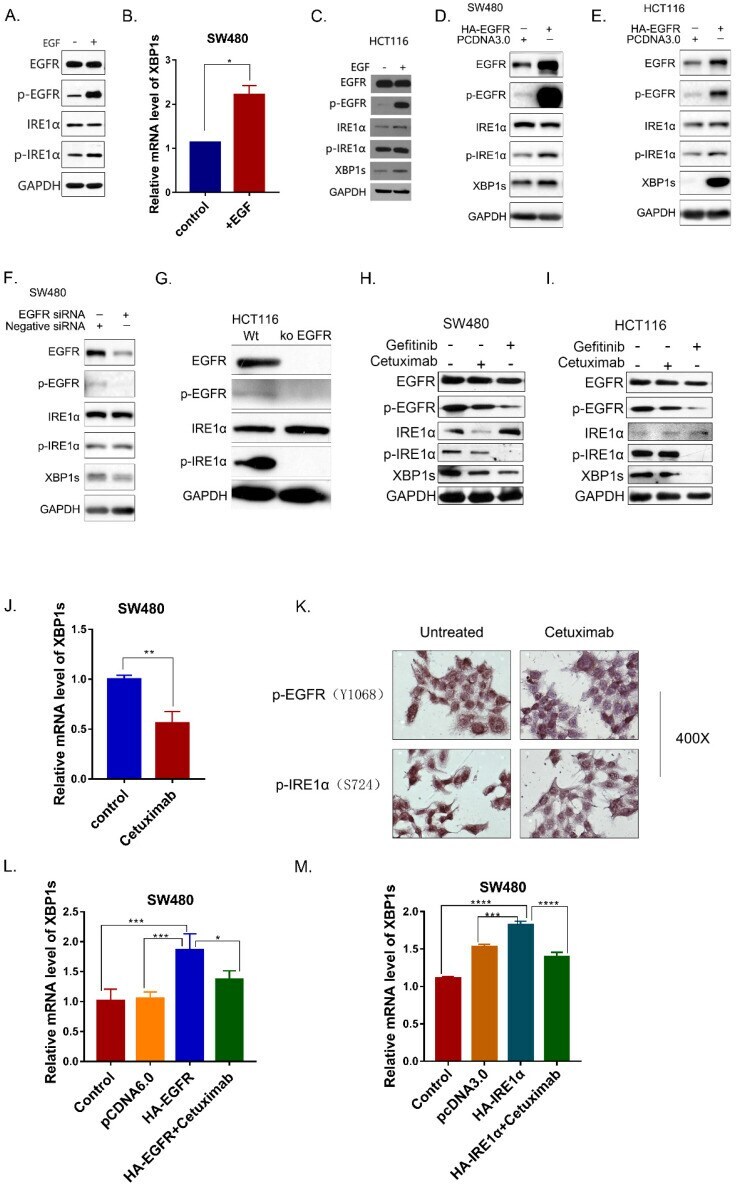
- Figure 2 EGFR activation is associated with IRE1alpha -XBP1s Signaling. A. Phosphorylation of EGFR and IRE1alpha were examined in SW480 cells 30 min after stimulation of EGF (50 ng/mL). B. Expression of spliced XBP1 mRNA in SW480 cells30 min after stimulation of EGF (50 ng/mL). Values are represented as the mean +- SD (n = 3) for each treatment (*P
- Submitted by
- Invitrogen Antibodies (provider)
- Main image
- Experimental details
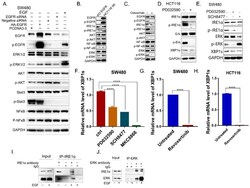
- Figure 3 EGFR signaling activates IRE1alpha through the kinase activity of ERK. A. The molecules of EGFR pathway were detected in SW480 cells by immunoblotting. B. The molecules of EGFR pathway of HCT116 EGFRKO cell line and HCT116 cells were examined by immunoblotting. C. EGFR downstream pathway were detected by immunoblotting in HCT116 treated with cetuximab (12.5mug/mL) for 24hrs. D. Proteins of IRE1alpha-XBP1s pathway in HCT116 cells with the treatment of MEK inhibitor PD0325901 (1 nm) for 24hrs were assessed by immunoblotting. E. p-IRE1alpha (S724) and XBP1s were assessed via immunoblotting after the treatment of MEK inhibitor PD0325901 (1 nm) or ERK inhibitor SCH8477 (5muM) for 24hrs. F. Expression of spliced XBP1 mRNA was assessed in SW480 cells after treatment with MEK inhibitor PD0325901 (1 nm) or ERK inhibitor SCH8477 (5muM). MKC8866 was used as positive control. Values are represented as the mean +- SD (n = 3) for each treatment (****P

- Submitted by
- Invitrogen Antibodies (provider)
- Main image
- Experimental details
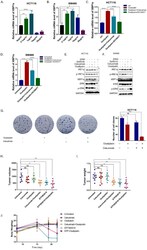
- Figure 5 Cetuximab enhances the efficacy of Oxaliplatin by decreasing the activation of IRE1alpha-XBP1s. A, B. XBP1s expression was detected 24 hrs after oxaliplatin treatment in HCT116 (A) and SW480 (B) cells. Values are represented as the mean +- SD (n = 3) for each treatment (**P
