Explore
 Validate
 Learn
Learn Western blot
 Immunocytochemistry
Antibody data
- Antibody Data
- Antigen structure
- References [1]
- Comments [0]
- Validations
- Immunocytochemistry [5]
- Other assay [4]
Submit
Validation data
Reference
Comment
Report error
- Product number
- PA5-20548 - Provider product page

- Provider
- Invitrogen Antibodies
- Product name
- VPS53 Polyclonal Antibody
- Antibody type
- Polyclonal
- Antigen
- Synthetic peptide
- Description
- A suggested positive control is 293 cell lysate. PA5-20548 can be used with blocking peptide PEP-0668.
- Reactivity
- Human, Mouse, Rat
- Host
- Rabbit
- Isotype
- IgG
- Vial size
- 100 μg
- Concentration
- 1 mg/mL
- Storage
- Maintain refrigerated at 2-8°C for up to 3 months. For long term storage store at -20°C
Submitted references The Golgi-associated retrograde protein (GARP) complex plays an essential role in the maintenance of the Golgi glycosylation machinery.
Khakurel A, Kudlyk T, Bonifacino JS, Lupashin VV
Molecular biology of the cell 2021 Aug 15;32(17):1594-1610
Molecular biology of the cell 2021 Aug 15;32(17):1594-1610
No comments: Submit comment
Supportive validation
- Submitted by
- Invitrogen Antibodies (provider)
- Main image
- Experimental details
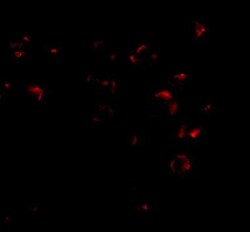
- Immunofluorescent analysis of 293 cells using a VPS53 polyclonal antibody (Product # PA5-20548) at a 25 µg/mL dilution.
- Submitted by
- Invitrogen Antibodies (provider)
- Main image
- Experimental details
- Immunocytochemistry of VPS53 in 293 cells with VPS53 Polyclonal Antibody (Product # PA5-20548) at 5 µg/mL.

- Submitted by
- Invitrogen Antibodies (provider)
- Main image

- Experimental details
- Immunofluorescence of VPS53 in 293 cells with VPS53 Polyclonal Antibody (Product # PA5-20548) at 2.5 µg/mL.

- Submitted by
- Invitrogen Antibodies (provider)
- Main image

- Experimental details
- Immunocytochemistry of VPS53 in 293 cells with VPS53 Polyclonal Antibody (Product # PA5-20548) at 5 µg/mL.

- Submitted by
- Invitrogen Antibodies (provider)
- Main image
- Experimental details
- Immunofluorescence of VPS53 in 293 cells with VPS53 Polyclonal Antibody (Product # PA5-20548) at 2.5 µg/mL.

Supportive validation
- Submitted by
- Invitrogen Antibodies (provider)
- Main image
- Experimental details
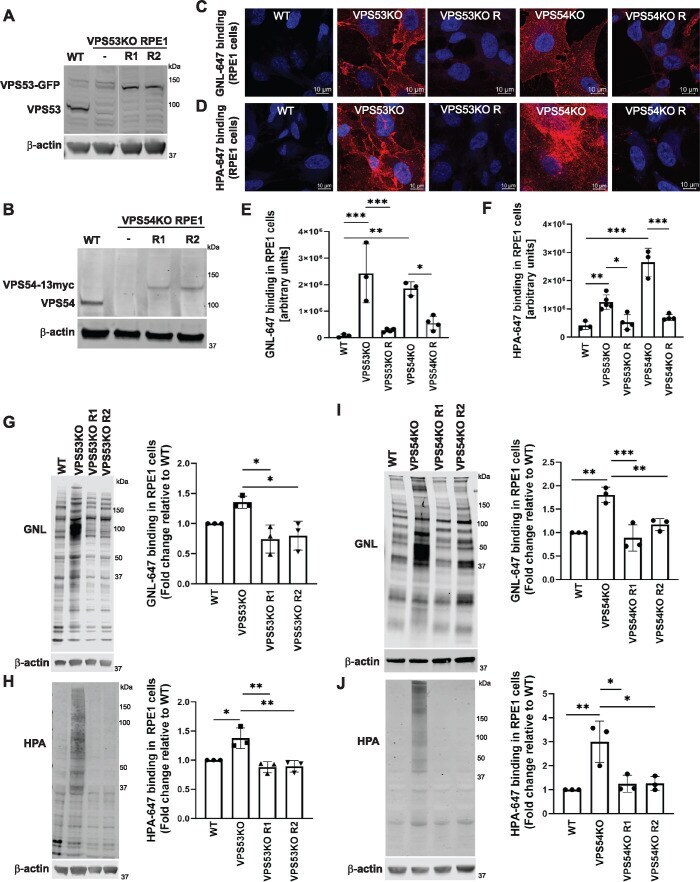
- FIGURE 1: GARP-KO results in Golgi glycosylation defects in RPE1 cells. (A) WB of RPE1 cell lysates from WT, VPS53-KO, and two VPS53-KO rescued clones expressing VPS53-GFP (R1 and R2) probed with anti-VPS53 antibody. (B) WB of RPE1 cell lysates from WT, VPS54-KO, and two VPS54-KO clones rescued with VPS54-13myc (R1 and R2) probed with anti-VPS54 antibodies. (C) Staining of nonpermeabilized WT, VPS53-KO, and VPS54-KO RPE1 cells, and the corresponding rescued cells with the fluorescently conjugated lectin GNL-647 (specific for terminal alpha-D-mannosyl residues). (D) Staining of nonpermeabilized WT, VPS53-KO, and VPS54-KO RPE1 cells and the corresponding rescued cells with the fluorescently conjugated lectin HPA-647 (specific for terminal GalNAc residues). (E) Quantification of GNL-647 binding was done on the basis of the total GNL-647 signal per field. Three different fields were used for the quantification of GNL-647 binding and each field included approximately 80 cells. The y -axis in the bar graph represents relative binding of GNL-647 to the surface of WT, GARP-KOs, and rescued RPE1 cells in arbitrary units. Bar graphs with error bars represent mean +- SD. (F) Quantification of HPA-647 binding was done on the basis of the total HPA-647 signal per field. Bar graphs with error bars represent mean +- SD from three different fields. The y -axis in the bar graph represents relative binding of HPA-647 to the surface of WT, GARP-KOs, and rescued RPE1 cells in arbitrary units. (G
- Submitted by
- Invitrogen Antibodies (provider)
- Main image
- Experimental details
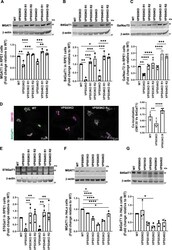
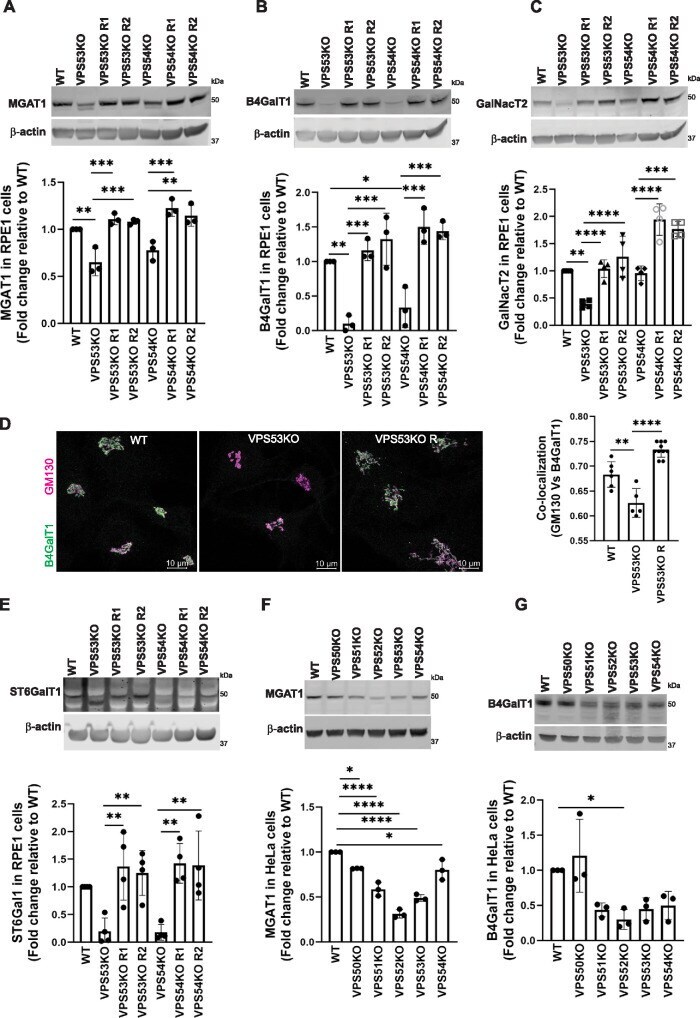
- FIGURE 3: GARP-KO affects the stability of key N- and O- Golgi glycosylation enzymes in RPE1 and HeLa cells. (A-C) WB (top panel) and quantification (bottom panels) of MGAT1 (A), B4GalT1 (B), and GalNacT2 (C) in WT, VPS53-KO, VPS54-KO, and the corresponding rescued RPE1 cells. (D) WT, VPS53-KO, and VPS53-KO rescued RPE1 cells were co-stained for endogenous B4GalT1 (green) and GM130 (magenta), and images were taken (left panel). Colocalization of B4GalT1 with GM130 was determined by calculation of the Pearson's correlation coefficient (right panel). At least 30 cells were imaged per sample for the quantification. Each dot in the bar graph (right panel) represents the colocalization of GM130 and B4GalT1 in several (1 to 10) cells imaged per field. (E) WB (top panel) and quantification (bottom panels) of ST6Gal1 in WT, VPS53-KO, VPS54-KO, and the corresponding rescued RPE1 cells. For quantification of ST6Gal1 blot, the additional low molecular weight band in VPS53-KO cells was not included. (F, G) WB (top panel) and quantification (bottom panels) of MGAT1 (F) and B4GalT1 (G) in WT, VPS50-, VPS51-, VPS52-, VPS53-, and VPS54-KO HeLa cells. Values in bar graphs represent the mean +- SD from three independent experiments. Statistical significance was calculated using one-way ANOVA. **** P
- Submitted by
- Invitrogen Antibodies (provider)
- Main image
- Experimental details
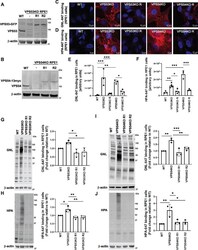
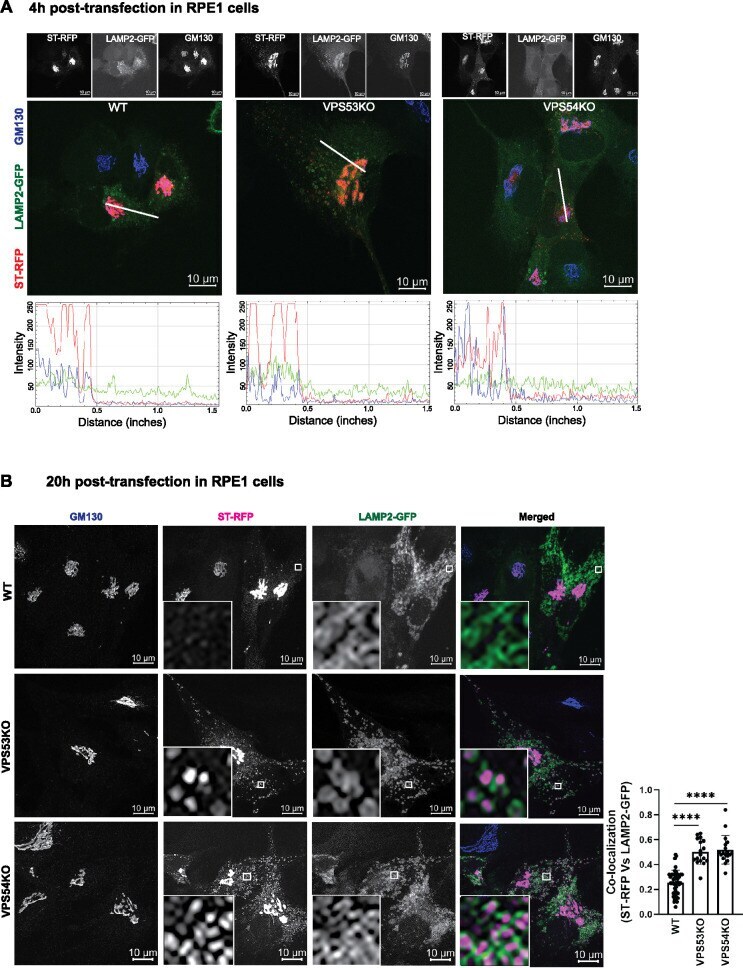
- FIGURE 4: ST-RFP is not retained in the Golgi in GARP-deficient RPE1 cells. (A) WT, VPS53-KO, and VPS54-KO RPE1 cells were co-transfected with plasmids encoding ST-RFP and LAMP2-GFP for 4 h, followed by staining for the Golgi marker GM130. Microscopic images in A show individual channels in grayscale on top of each merged image. Bottom panels in A are the line scan plots of relative intensity over distance that demonstrates the overlap between the channels. Line scan analysis was done using ImageJ. (B) WT, VPS53-KO and VPS54-KO RPE1 cells were co-transfected with plasmids encoding ST-RFP and LAMP2-GFP for 20 h, followed by staining for the Golgi marker GM130. Insets are zoomed in views of the small white-boxed areas (10x inset). Colocalization of ST-RFP with LAMP2-GFP was determined by calculation of the Pearson's correlation coefficient (right panel) in approximately 20 cells. Statistical significance was calculated using one-way ANOVA. **** P
- Submitted by
- Invitrogen Antibodies (provider)
- Main image
- Experimental details
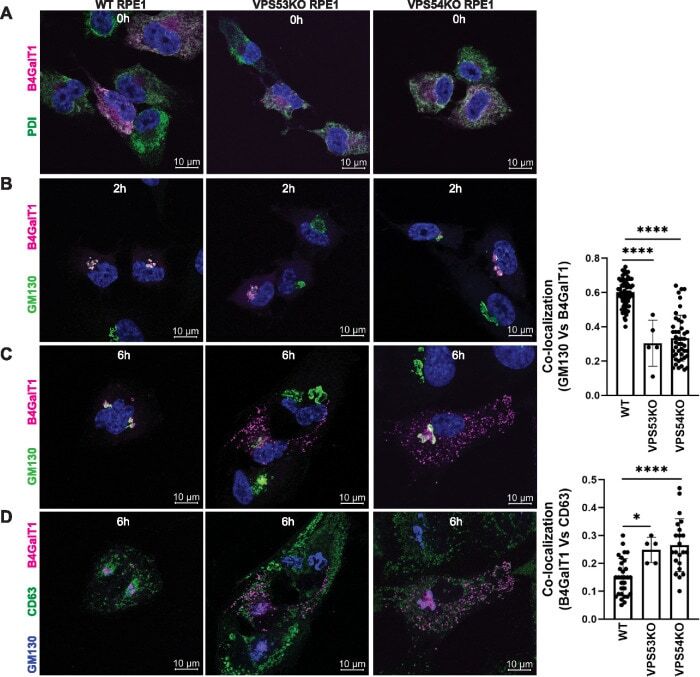
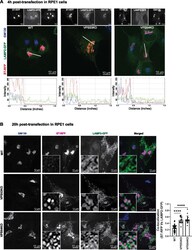
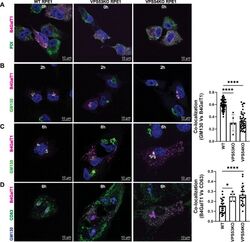
- FIGURE 5: RUSH assay reveals mislocalization of B4GalT1 to endolysosomes in GARP-KO RPE1 cells. RPE1 cells were transfected with plasmids encoding Str-KDEL_flB4GalT1-SBP-mCherry in biotin-free medium. Following overnight incubation, biotin (40 uM) and cycloheximide (50 uM) were added for 0, 2, and 6 h. (A) Colocalization of B4GalT1 with ER marker PDI at time 0. (B, C) Colocalization of B4GalT1 with Golgi protein GM130 at 2 h (B) and 6 h (C). The graph on the right side of C shows the quantification of B4GalT1 and GM130 colocalization at 6 h of biotin/cycloheximide addition. Values in the bar graph represent the mean +- SD of the colocalization between B4GalT1 and GM130 in approximately 40 cells in WT and VPS54-KOs. Colocalization in VPS53-KO cells was measured using each field in approximately 20 cells. Statistical significance was calculated using one-way ANOVA. **** P