Explore
 Validate
 Learn
LearnMA5-16169
antibody from Invitrogen Antibodies
Targeting: DNMT1
CXXC9, DNMT, MCMT
 Western blot
 Immunocytochemistry
 Immunoprecipitation Immunohistochemistry Flow cytometry Chromatin Immunoprecipitation Other assay
Antibody data
- Antibody Data
- Antigen structure
- References [3]
- Comments [0]
- Validations
- Immunocytochemistry [2]
- Immunohistochemistry [1]
- Flow cytometry [3]
- Chromatin Immunoprecipitation [2]
- Other assay [4]
Submit
Validation data
Reference
Comment
Report error
- Product number
- MA5-16169 - Provider product page

- Provider
- Invitrogen Antibodies
- Product name
- DNMT1 Monoclonal Antibody (60B1220.1)
- Antibody type
- Monoclonal
- Antigen
- Synthetic peptide
- Description
- Suggested positive control: human kidney (IHC), mouse ES cells (WB). Immunogen sequence: EKDDREDKEN AFKR
- Reactivity
- Human, Mouse, Rat, Bovine, Porcine
- Host
- Mouse
- Isotype
- IgG
- Antibody clone number
- 60B1220.1
- Vial size
- 100 μg
- Concentration
- 1 mg/mL
- Storage
- Store at 4°C short term. For long term storage, store at -20°C, avoiding freeze/thaw cycles.
Submitted references DNMT1-Mediated DNA Methylation Targets CDKN2B to Promote the Repair of Retinal Ganglion Cells in Streptozotocin-Induced Mongolian Gerbils during Diabetic Retinopathy.
Myocardial tissue-specific Dnmt1 knockout in rats protects against pathological injury induced by Adriamycin.
DNMT1 and HDAC2 Cooperate to Facilitate Aberrant Promoter Methylation in Inorganic Phosphate-Induced Endothelial-Mesenchymal Transition.
Wang X, Zhang J, Liao Y, Jin Y, Yu X, Li H, Yang Q, Li X, Chen R, Wu D, Zhu H
Computational and mathematical methods in medicine 2022;2022:9212116
Computational and mathematical methods in medicine 2022;2022:9212116
Myocardial tissue-specific Dnmt1 knockout in rats protects against pathological injury induced by Adriamycin.
Wu TT, Ma YW, Zhang X, Dong W, Gao S, Wang JZ, Zhang LF, Lu D
Laboratory investigation; a journal of technical methods and pathology 2020 Jul;100(7):974-985
Laboratory investigation; a journal of technical methods and pathology 2020 Jul;100(7):974-985
DNMT1 and HDAC2 Cooperate to Facilitate Aberrant Promoter Methylation in Inorganic Phosphate-Induced Endothelial-Mesenchymal Transition.
Tan X, Xu X, Zeisberg M, Zeisberg EM
PloS one 2016;11(1):e0147816
PloS one 2016;11(1):e0147816
No comments: Submit comment
Supportive validation
- Submitted by
- Invitrogen Antibodies (provider)
- Main image

- Experimental details
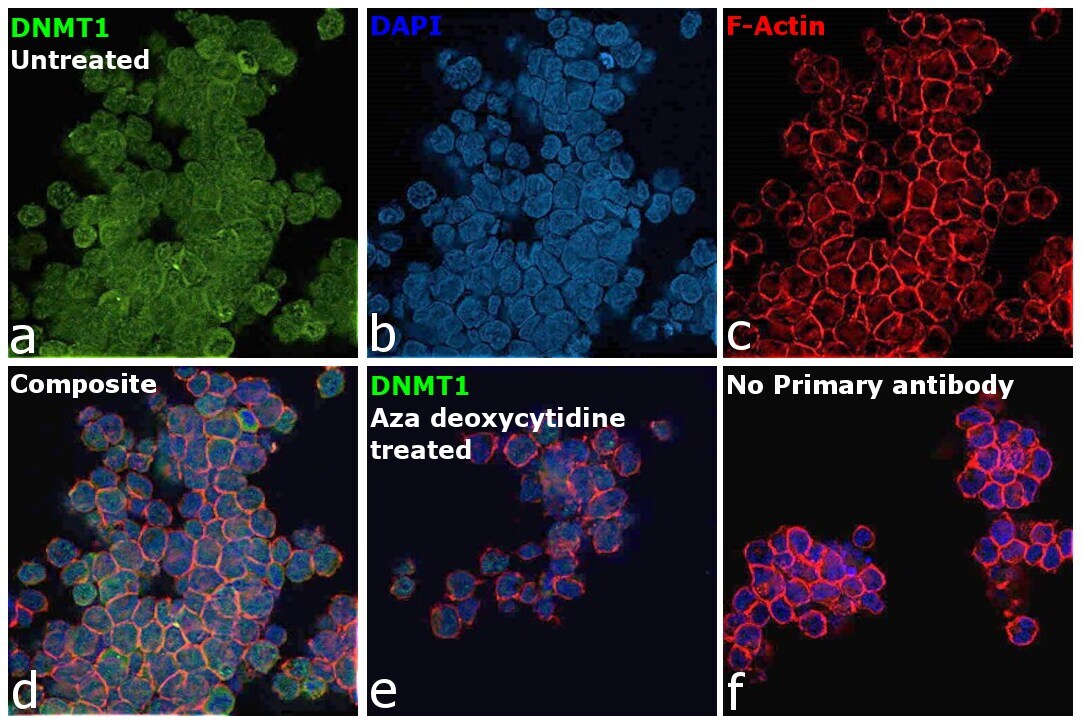
- Immunofluorescence analysis of DNMT1 was performed using 70% confluent log phase K-562 cells. The cells were fixed with 4% paraformaldehyde for 10 minutes, permeabilized with 0.1% Triton™ X-100 for 15 minutes, and blocked with 2% BSA for 1 hour at room temperature. The cells were labeled with DNMT1 Monoclonal Antibody (60B1220.1) (Product # MA5-16169) at 1:10 in 0.1% BSA, incubated at 4 degree celsius overnight and then labeled with Donkey anti-Mouse IgG (H+L) Highly Cross-Adsorbed Secondary Antibody, Alexa Fluor Plus 488 (Product # A32766), (1:2000), for 45 minutes at room temperature (Panel a: Green). Nuclei (Panel b:Blue) were stained with ProLong™ Diamond Antifade Mountant with DAPI (Product # P36962). F-actin (Panel c: Red) was stained with Rhodamine Phalloidin (Product # R415, 1:300). Panel d represents the merged image showing predominant nuclear localization. Panel e represents merged image of K-562 cells treated with 5 µM Aza deoxycytidine for 3 days (medium and drug were replaced every 24 hours). The signal is significantly lower in panel e due to down-regulation of DNMT1 expression upon Aza deoxycytidine treatment. Panel f represents untreated control cells with no primary antibody to assess background. The images were captured at 60X magnification.
- Submitted by
- Invitrogen Antibodies (provider)
- Main image

- Experimental details
- Immunofluorescence analysis of DNMT1 was performed using 70% confluent log phase K-562 cells. The cells were fixed with 4% paraformaldehyde for 10 minutes, permeabilized with 0.1% Triton™ X-100 for 15 minutes, and blocked with 2% BSA for 1 hour at room temperature. The cells were labeled with DNMT1 Monoclonal Antibody (60B1220.1) (Product # MA5-16169) at 1:10 in 0.1% BSA, incubated at 4 degree celsius overnight and then labeled with Donkey anti-Mouse IgG (H+L) Highly Cross-Adsorbed Secondary Antibody, Alexa Fluor Plus 488 (Product # A32766), (1:2000), for 45 minutes at room temperature (Panel a: Green). Nuclei (Panel b:Blue) were stained with ProLong™ Diamond Antifade Mountant with DAPI (Product # P36962). F-actin (Panel c: Red) was stained with Rhodamine Phalloidin (Product # R415, 1:300). Panel d represents the merged image showing predominant nuclear localization. Panel e represents merged image of K-562 cells treated with 5 µM Aza deoxycytidine for 3 days (medium and drug were replaced every 24 hours). The signal is significantly lower in panel e due to down-regulation of DNMT1 expression upon Aza deoxycytidine treatment. Panel f represents untreated control cells with no primary antibody to assess background. The images were captured at 60X magnification.

Supportive validation
- Submitted by
- Invitrogen Antibodies (provider)
- Main image
- Experimental details
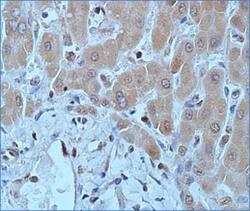
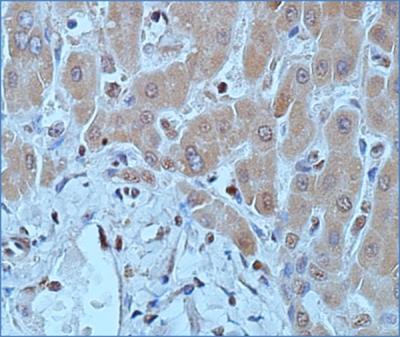
- Immunohistochemical analysis of DNMT1 in Tissue section of human hepatocellular carcinoma. Samples were incubated in DNMT1 monoclonal antibody (Product # MA5-16169) using a dilution of 1:50.
Supportive validation
- Submitted by
- Invitrogen Antibodies (provider)
- Main image
- Experimental details
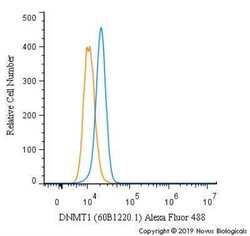
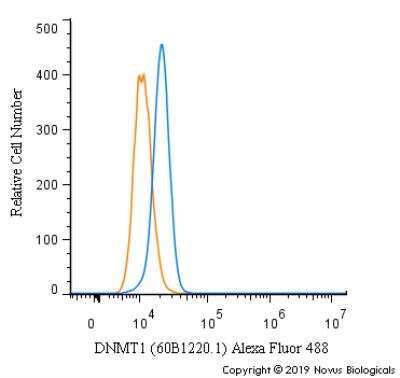
- Flow cytometry of DNMT1 in HeLa cells (blue) and a matched isotype control (orange). Samples were incubated in DNMT1 monoclonal antibody (Product # MA5-16169) using a dilution of 5 µg/mL for 30 minutes at room temperature. Cells were fixed with 4% PFA and then permeabilized with 0.1% saponin. Both antibodies were conjugated to Alexa Fluor 488.
- Submitted by
- Invitrogen Antibodies (provider)
- Main image
- Experimental details
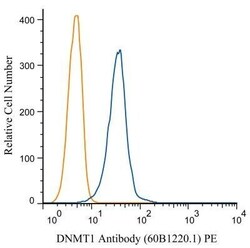
- Flow cytometry of DNMT1 in HeLa cells. Samples were incubated in DNMT1 monoclonal antibody (Product # MA5-16169). Antibody (blue) and a matched isotype control (orange). Cells were fixed with 4% PFA and then permeablized with 0.1% saponin. Both antibodies were conjugated to phycoerythrin (PE).

- Submitted by
- Invitrogen Antibodies (provider)
- Main image

- Experimental details
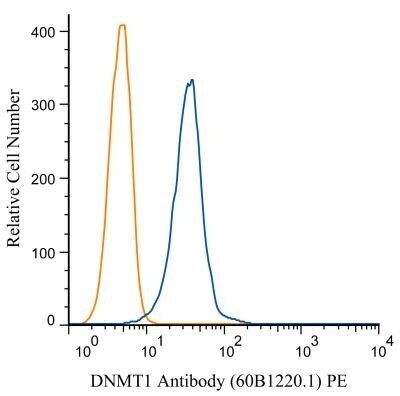
- Flow cytometry of DNMT1 in HeLa cells. Samples were incubated in DNMT1 monoclonal antibody (Product # MA5-16169). Antibody (blue) and a matched isotype control (orange). Cells were fixed with 4% PFA and then permeablized with 0.1% saponin. Both antibodies were conjugated to phycoerythrin (PE).
Supportive validation
- Submitted by
- Invitrogen Antibodies (provider)
- Main image
- Experimental details
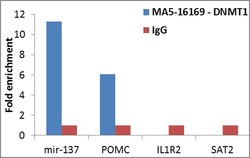
- Enrichment of endogenous DNMT1 protein at specific gene loci using Anti-DNMT1 Antibody: Chromatin Immunoprecipitation (ChIP) was performed using Anti-DNMT1 Mouse Monoclonal antibody (Product # MA5-16169, 4 ug) on sheared chromatin from 2 million HeLa cells using the MAGnify ChIP System (Product # 49-2024). Normal Rabbit IgG was used as a negative IP control. The purified DNA was analyzed by qPCR with PCR primer pairs over mir-137, POMC, IL1R2 (positive) and SAT2 satellite repeats (negative). Data is presented as fold enrichment of the antibody signal versus the negative control IgG using the comparative CT method.

- Submitted by
- Invitrogen Antibodies (provider)
- Main image

- Experimental details
- Enrichment of endogenous DNMT1 protein at specific gene loci using Anti-DNMT1 Antibody: Chromatin Immunoprecipitation (ChIP) was performed using Anti-DNMT1 Mouse Monoclonal antibody (Product # MA5-16169, 4 ug) on sheared chromatin from 2 million HeLa cells using the MAGnify ChIP System (Product # 49-2024). Normal Rabbit IgG was used as a negative IP control. The purified DNA was analyzed by qPCR with PCR primer pairs over mir-137, POMC, IL1R2 (positive) and SAT2 satellite repeats (negative). Data is presented as fold enrichment of the antibody signal versus the negative control IgG using the comparative CT method.

Supportive validation
- Submitted by
- Invitrogen Antibodies (provider)
- Main image
- Experimental details
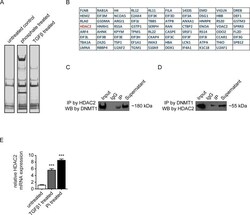
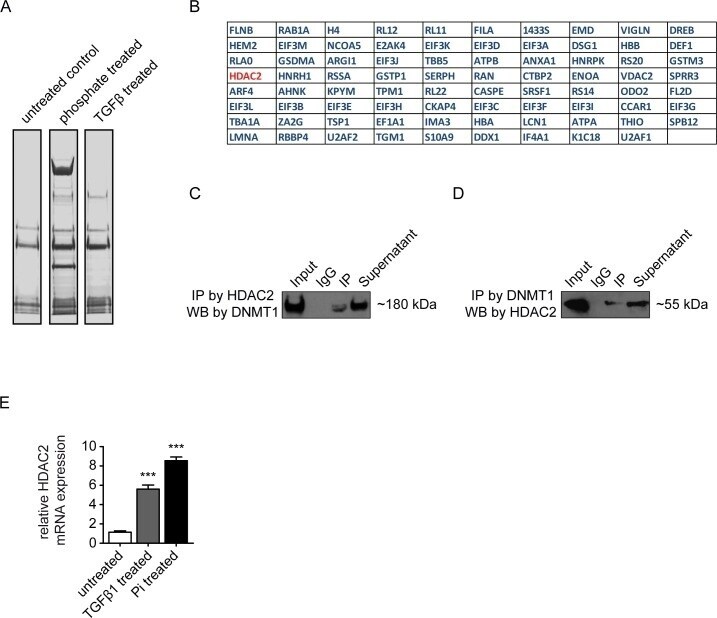
- Fig 5 Mass spectrometry (MS) based proteomics coupled with co-immunoprecipitation for Pi treated and TGF-beta1 cells. (A) Protein complex from phosphate (3mM for 72 hours) and TGFbeta (10ng/ml TGFbeta1 for 4 days) treated cells were immunoprecipitated by DNMT1 antibody and resolved in SDS-PAGE gel which stained by Coomassie blue. Untreated cells were used as control. (B) A list of protein candidates identified through Mass spectrometry analysis showed the commonly enriched proteins through DNMT1 immunoprecipitation from Pi and TGF-beta1 treated cells. (C-D) Confirmation of the interaction between DNMT1 and HDAC, the protein complex was immunoprecipitated by (C) HDAC2 antibody and detected by DNMT1 antibody or was immunoprecipitated by (D) DNMT1 antibody and detected by HDAC2 antibody. (E) qRT-PCR analysis showed the upregulated mRNA expression of HDAC2 in both Pi and TGF-beta1 treated cells. Results were normalized to reference gene GAPDH (expression is presented as means +- s.d., n = 3 independent experiments, ***P
- Submitted by
- Invitrogen Antibodies (provider)
- Main image

- Experimental details
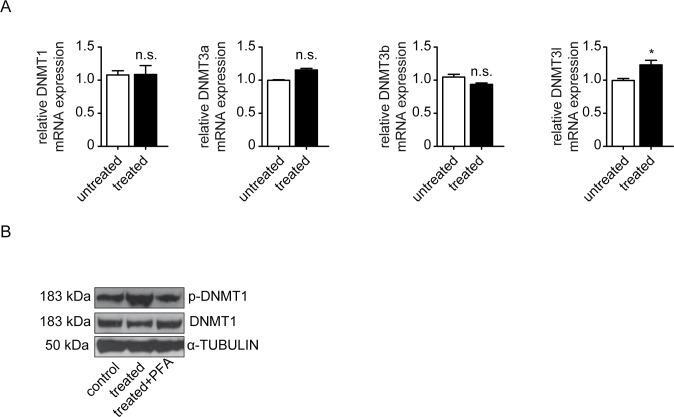
- Fig 4 High Pi influences HCAEC mediated by increased DNMT1 activity. Cells were treated with Pi 3mM for 72 hours. (A) qRT-PCR data showing the mRNA expression of DNA methyltransferases (DNMT1, DNMT3a, DNMT3b and DNMT3l) in control and Pi treated cells. (B) Western blot demonstrating the enhanced protein level in phosphorylated DNMT1-ser154 stimulated by Pi treatment, which was inhibited by phosphate transporter inhibitor Phosphonoformic Acid (PFA), whereas total DNMT1 was not affected.
- Submitted by
- Invitrogen Antibodies (provider)
- Main image
- Experimental details
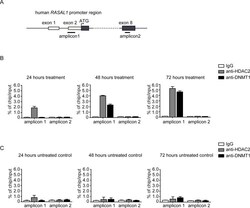
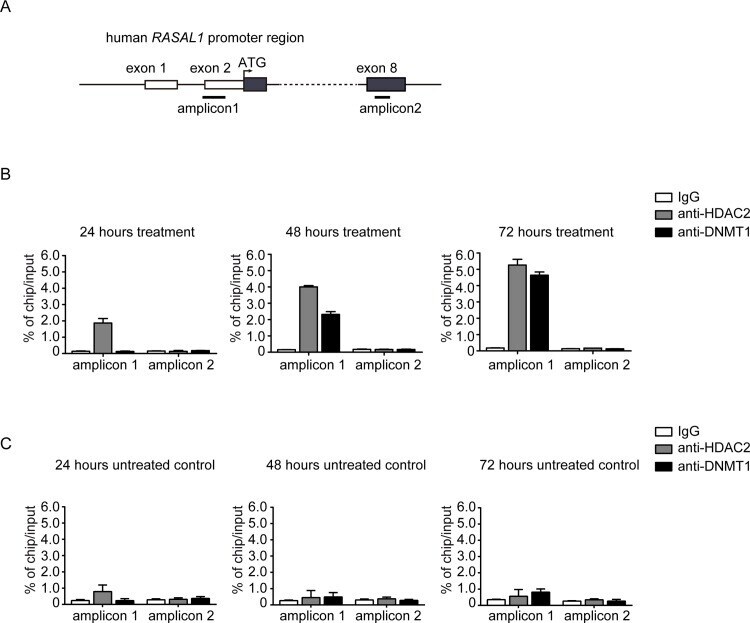
- Fig 6 Pi inhibits RASAL 1 expression through direct binding to its promoter. (A) Simplified schematic showing the human RASAL1 promoter along with exons (black boxes), translational start site (black arrow), locations of RASAL1 chip primer for amplicon1 and amplicon2, and amplicon2 primers serve as negative control chip primer. (B-C) The binding properties of HDAC2 and DNMT1 to the RASAL1 promoter region were analyzed by chromatin immunoprecipitation (ChIP) assay and detected by qRT-PCR in Pi treated (B) or in control cells (C). IgG purified from the same species serve as negative control for ChIP (expression are presented as means +- s.d., n = 3 independent experiments, **P
- Submitted by
- Invitrogen Antibodies (provider)
- Main image
- Experimental details
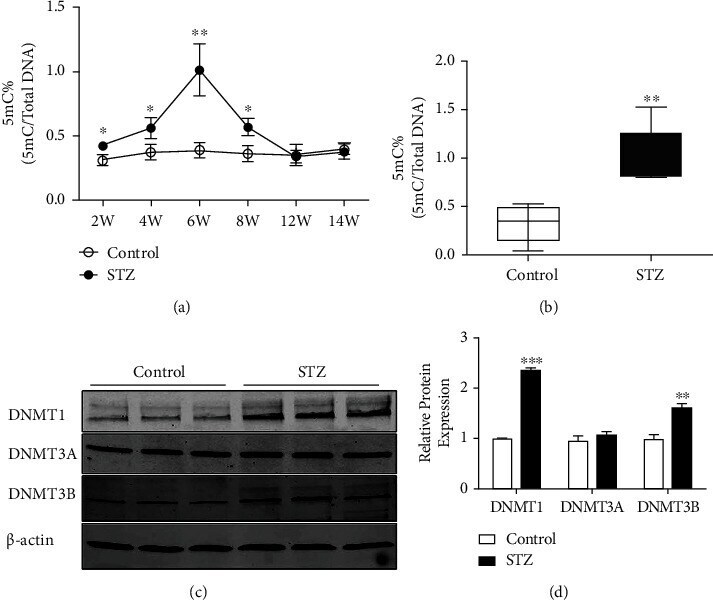
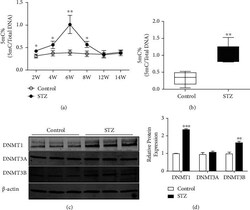
- Figure 3 DNMT1-mediated DNA methylation was significantly increased in the early phase of diabetic retinopathy. (a) STZ injection upregulated the global DNA methylation level of the retina until 6 weeks after injection. (b) Quantification of the average 5-mC content in DNA methylation of the retina isolated from sodium citrate buffer injection (control) and STZ injection (STZ) groups. (c-d) Western blot showed the protein expression levels of DNMT1, DNMT3A, and DNMT3B. * P < 0.05, ** P < 0.01.