Explore
 Validate
 Learn
Learn Flow cytometry
Antibody data
- Antibody Data
- Antigen structure
- References [20]
- Comments [0]
- Validations
- Flow cytometry [1]
- Other assay [12]
Submit
Validation data
Reference
Comment
Report error
- Product number
- 12-9858-80 - Provider product page

- Provider
- Invitrogen Antibodies
- Product name
- IRF4 Monoclonal Antibody (3E4), PE, eBioscience™
- Antibody type
- Monoclonal
- Antigen
- Other
- Description
- Description: The monoclonal antibody 3E4 reacts with human and mouse interferon regulatory factor 4 (IRF4). IRF4 is a 52 kDa transcription factor with roles in B cell, T cell and macrophage function. In B cells, IRF4 is highly expressed in mature plasma cells and plays a crucial role in their differentiation. IRF4 has been shown to interact with PU.1 and control the transcription of many B cell-specific genes including Prdm1, which encodes Blimp1. In T cells, IRF4 has been implicated in regulatory T (Treg), Th2, Th9 and Th17 cell development and function. This transcription factor is upregulated upon T cell activation and is expressed in mature T cells. Studies have shown that IRF4 directly induces Blimp1 expression in Tregs, leading to IL-10 expression. IRF4 has also been demonstrated to be involved in macrophage polarization and regulation. Lastly, in addition to its roles in normal immune function, IRF4 expression has been reported to be upregulated in many blood-related cancers. Applications Reported:This 3E4 antibody has been reported for use in intracellular staining followed by flow cytometric analysis. Applications Tested: This 3E4 antibody has been tested by intracellular staining and flow cytometric analysis of stimulated normal human peripheral blood cells using the Foxp3/Transcription Factor Buffer Set (Product # 00-5523-00) and protocol. Please see Best Protocols Section (Staining intracellular Antigens for Flow Cytometry) for staining protocol (refer to Protocol B: One-step protocol for intracellular (nuclear) proteins. This can be used at less than or equal to 0.125 µg per test. A test is defined as the amount (µg) of antibody that will stain a cell sample in a final volume of 100 µL. Cell number should be determined empirically but can range from 10^5 to 10^8 cells/test. It is recommended that the antibody be carefully titrated for optimal performance in the assay of interest. Excitation: 488-561 nm; Emission: 578 nm; Laser: Blue Laser, Green Laser, Yellow-Green Laser. Filtration: 0.2 µm post-manufacturing filtered.
- Reactivity
- Human, Mouse
- Host
- Rat
- Conjugate
- Yellow dye
- Isotype
- IgG
- Antibody clone number
- 3E4
- Vial size
- 25 µg
- Concentration
- 0.2 mg/mL
- Storage
- 4° C, store in dark, DO NOT FREEZE!
Submitted references Toll-like receptor mediated inflammation directs B cells towards protective antiviral extrafollicular responses.
Profiling Germinal Center-like B Cell Responses to Conjugate Vaccines Using Synthetic Immune Organoids.
The mitochondrial iron transporter ABCB7 is required for B cell development, proliferation, and class switch recombination in mice.
B cells promote CD8 T cell primary and memory responses to subunit vaccines.
The Amount of BCL6 in B Cells Shortly after Antigen Engagement Determines Their Representation in Subsequent Germinal Centers.
Mitochondrial Oxidative Phosphorylation Regulates the Fate Decision between Pathogenic Th17 and Regulatory T Cells.
Differential IRF8 Transcription Factor Requirement Defines Two Pathways of Dendritic Cell Development in Humans.
Ufbp1 promotes plasma cell development and ER expansion by modulating distinct branches of UPR.
Noc4L-Mediated Ribosome Biogenesis Controls Activation of Regulatory and Conventional T Cells.
CD4(+) T Cell Fate Decisions Are Stochastic, Precede Cell Division, Depend on GITR Co-Stimulation, and Are Associated With Uropodium Development.
Blimp-1 Functions as a Molecular Switch to Prevent Inflammatory Activity in Foxp3(+)RORγt(+) Regulatory T Cells.
ROCK2, but not ROCK1 interacts with phosphorylated STAT3 and co-occupies TH17/TFH gene promoters in TH17-activated human T cells.
Cbl Ubiquitin Ligases Control B Cell Exit from the Germinal-Center Reaction.
Quality of TCR signaling determined by differential affinities of enhancers for the composite BATF-IRF4 transcription factor complex.
Batf3 selectively determines acquisition of CD8(+) dendritic cell phenotype and function.
Affinity and dose of TCR engagement yield proportional enhancer and gene activity in CD4+ T cells.
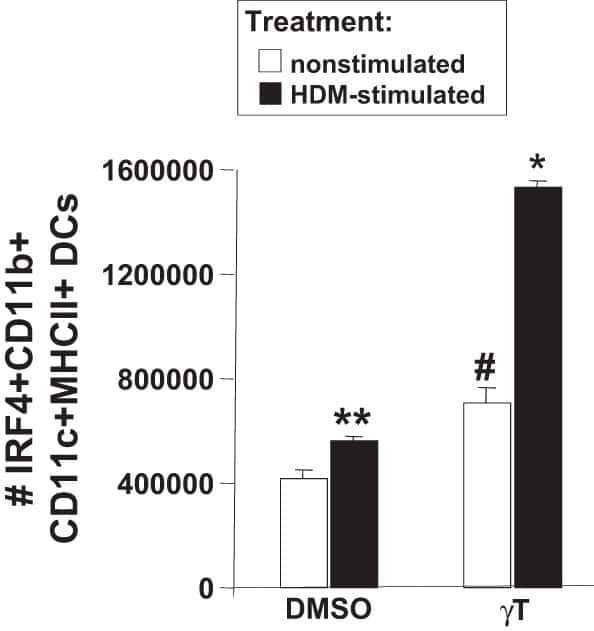
γ-Tocopherol supplementation of allergic female mice augments development of CD11c+CD11b+ dendritic cells in utero and allergic inflammation in neonates.
Cell-intrinsic expression of TLR9 in autoreactive B cells constrains BCR/TLR7-dependent responses.
Batf3 maintains autoactivation of Irf8 for commitment of a CD8α(+) conventional DC clonogenic progenitor.
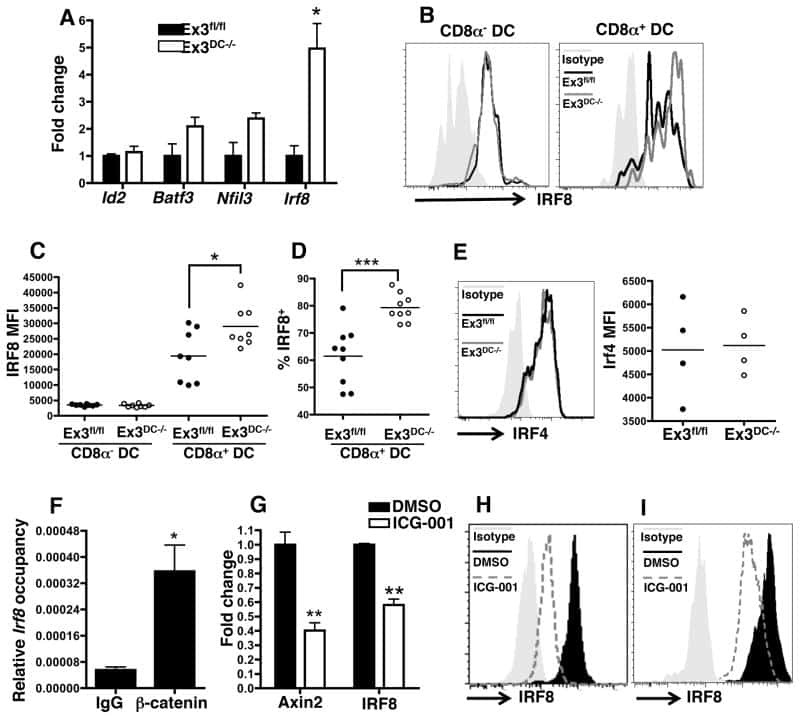
Beta-catenin signaling drives differentiation and proinflammatory function of IRF8-dependent dendritic cells.
Lam JH, Baumgarth N
Nature communications 2023 Jul 5;14(1):3979
Nature communications 2023 Jul 5;14(1):3979
Profiling Germinal Center-like B Cell Responses to Conjugate Vaccines Using Synthetic Immune Organoids.
Moeller TD, Shah SB, Lai K, Lopez-Barbosa N, Desai P, Wang W, Zhong Z, Redmond D, Singh A, DeLisa MP
ACS central science 2023 Apr 26;9(4):787-804
ACS central science 2023 Apr 26;9(4):787-804
The mitochondrial iron transporter ABCB7 is required for B cell development, proliferation, and class switch recombination in mice.
Lehrke MJ, Shapiro MJ, Rajcula MJ, Kennedy MM, McCue SA, Medina KL, Shapiro VS
eLife 2021 Nov 11;10
eLife 2021 Nov 11;10
B cells promote CD8 T cell primary and memory responses to subunit vaccines.
Klarquist J, Cross EW, Thompson SB, Willett B, Aldridge DL, Caffrey-Carr AK, Xu Z, Hunter CA, Getahun A, Kedl RM
Cell reports 2021 Aug 24;36(8):109591
Cell reports 2021 Aug 24;36(8):109591
The Amount of BCL6 in B Cells Shortly after Antigen Engagement Determines Their Representation in Subsequent Germinal Centers.
Robinson MJ, Ding Z, Pitt C, Brodie EJ, Quast I, Tarlinton DM, Zotos D
Cell reports 2020 Feb 4;30(5):1530-1541.e4
Cell reports 2020 Feb 4;30(5):1530-1541.e4
Mitochondrial Oxidative Phosphorylation Regulates the Fate Decision between Pathogenic Th17 and Regulatory T Cells.
Shin B, Benavides GA, Geng J, Koralov SB, Hu H, Darley-Usmar VM, Harrington LE
Cell reports 2020 Feb 11;30(6):1898-1909.e4
Cell reports 2020 Feb 11;30(6):1898-1909.e4
Differential IRF8 Transcription Factor Requirement Defines Two Pathways of Dendritic Cell Development in Humans.
Cytlak U, Resteu A, Pagan S, Green K, Milne P, Maisuria S, McDonald D, Hulme G, Filby A, Carpenter B, Queen R, Hambleton S, Hague R, Lango Allen H, Thaventhiran JED, Doody G, Collin M, Bigley V
Immunity 2020 Aug 18;53(2):353-370.e8
Immunity 2020 Aug 18;53(2):353-370.e8
Ufbp1 promotes plasma cell development and ER expansion by modulating distinct branches of UPR.
Zhu H, Bhatt B, Sivaprakasam S, Cai Y, Liu S, Kodeboyina SK, Patel N, Savage NM, Sharma A, Kaufman RJ, Li H, Singh N
Nature communications 2019 Mar 6;10(1):1084
Nature communications 2019 Mar 6;10(1):1084
Noc4L-Mediated Ribosome Biogenesis Controls Activation of Regulatory and Conventional T Cells.
Zhu X, Zhang W, Guo J, Zhang X, Li L, Wang T, Yan J, Zhang F, Hou B, Gao N, Gao GF, Zhou X
Cell reports 2019 Apr 23;27(4):1205-1220.e4
Cell reports 2019 Apr 23;27(4):1205-1220.e4
CD4(+) T Cell Fate Decisions Are Stochastic, Precede Cell Division, Depend on GITR Co-Stimulation, and Are Associated With Uropodium Development.
Cobbold SP, Adams E, Howie D, Waldmann H
Frontiers in immunology 2018;9:1381
Frontiers in immunology 2018;9:1381
Blimp-1 Functions as a Molecular Switch to Prevent Inflammatory Activity in Foxp3(+)RORγt(+) Regulatory T Cells.
Ogawa C, Bankoti R, Nguyen T, Hassanzadeh-Kiabi N, Nadeau S, Porritt RA, Couse M, Fan X, Dhall D, Eberl G, Ohnmacht C, Martins GA
Cell reports 2018 Oct 2;25(1):19-28.e5
Cell reports 2018 Oct 2;25(1):19-28.e5
ROCK2, but not ROCK1 interacts with phosphorylated STAT3 and co-occupies TH17/TFH gene promoters in TH17-activated human T cells.
Chen W, Nyuydzefe MS, Weiss JM, Zhang J, Waksal SD, Zanin-Zhorov A
Scientific reports 2018 Nov 9;8(1):16636
Scientific reports 2018 Nov 9;8(1):16636
Cbl Ubiquitin Ligases Control B Cell Exit from the Germinal-Center Reaction.
Li X, Gadzinsky A, Gong L, Tong H, Calderon V, Li Y, Kitamura D, Klein U, Langdon WY, Hou F, Zou YR, Gu H
Immunity 2018 Mar 20;48(3):530-541.e6
Immunity 2018 Mar 20;48(3):530-541.e6
Quality of TCR signaling determined by differential affinities of enhancers for the composite BATF-IRF4 transcription factor complex.
Iwata A, Durai V, Tussiwand R, Briseño CG, Wu X, Grajales-Reyes GE, Egawa T, Murphy TL, Murphy KM
Nature immunology 2017 May;18(5):563-572
Nature immunology 2017 May;18(5):563-572
Batf3 selectively determines acquisition of CD8(+) dendritic cell phenotype and function.
Chandra J, Kuo PT, Hahn AM, Belz GT, Frazer IH
Immunology and cell biology 2017 Feb;95(2):215-223
Immunology and cell biology 2017 Feb;95(2):215-223
Affinity and dose of TCR engagement yield proportional enhancer and gene activity in CD4+ T cells.
Allison KA, Sajti E, Collier JG, Gosselin D, Troutman TD, Stone EL, Hedrick SM, Glass CK
eLife 2016 Jul 4;5
eLife 2016 Jul 4;5
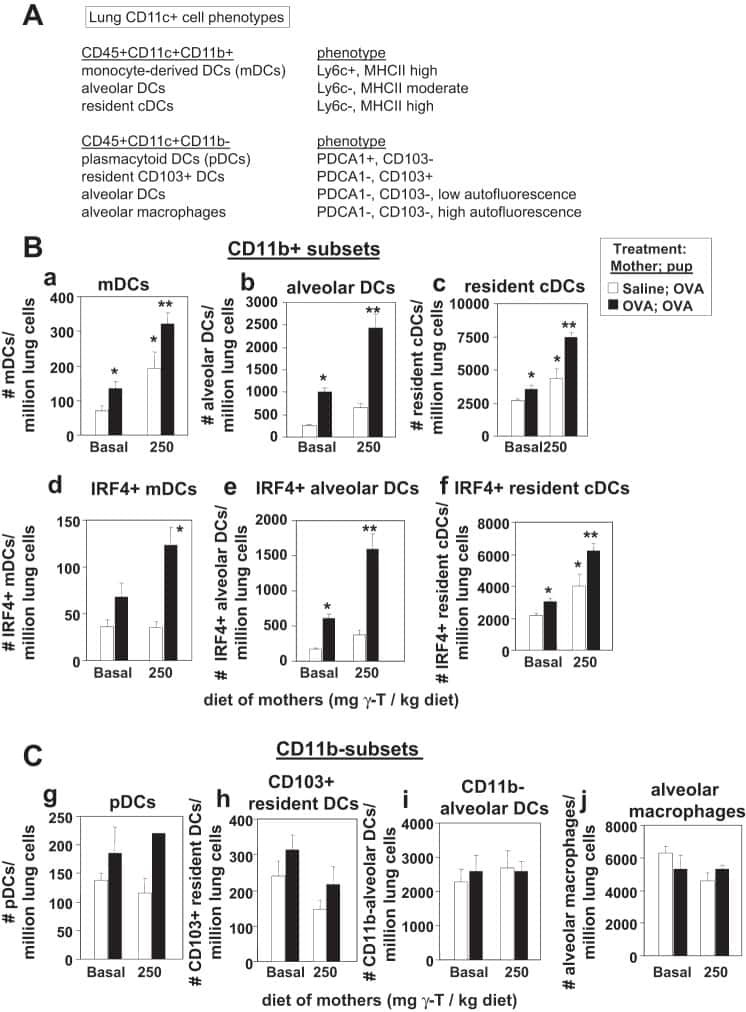
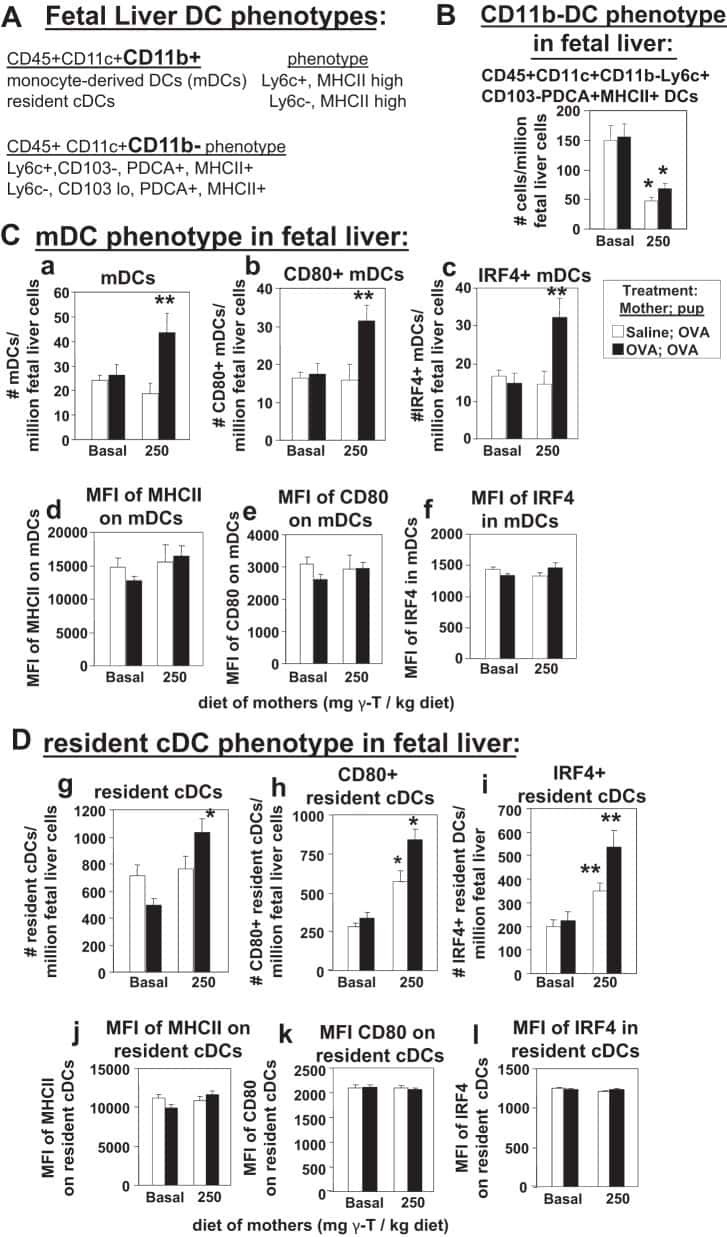
γ-Tocopherol supplementation of allergic female mice augments development of CD11c+CD11b+ dendritic cells in utero and allergic inflammation in neonates.
Abdala-Valencia H, Soveg F, Cook-Mills JM
American journal of physiology. Lung cellular and molecular physiology 2016 Apr 15;310(8):L759-71
American journal of physiology. Lung cellular and molecular physiology 2016 Apr 15;310(8):L759-71
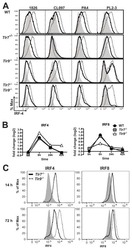
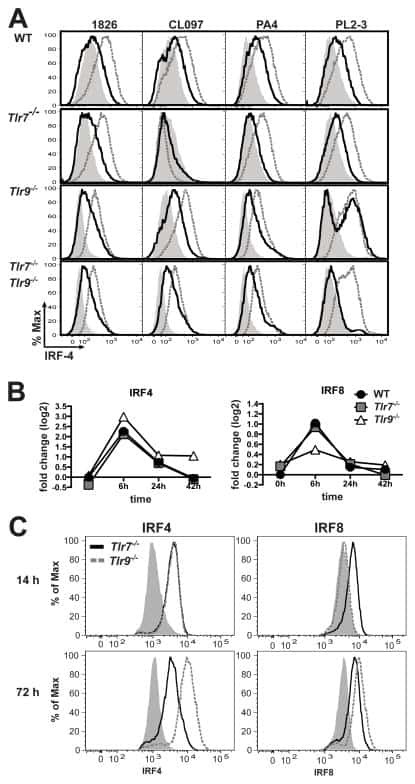
Cell-intrinsic expression of TLR9 in autoreactive B cells constrains BCR/TLR7-dependent responses.
Nündel K, Green NM, Shaffer AL, Moody KL, Busto P, Eilat D, Miyake K, Oropallo MA, Cancro MP, Marshak-Rothstein A
Journal of immunology (Baltimore, Md. : 1950) 2015 Mar 15;194(6):2504-12
Journal of immunology (Baltimore, Md. : 1950) 2015 Mar 15;194(6):2504-12
Batf3 maintains autoactivation of Irf8 for commitment of a CD8α(+) conventional DC clonogenic progenitor.
Grajales-Reyes GE, Iwata A, Albring J, Wu X, Tussiwand R, Kc W, Kretzer NM, Briseño CG, Durai V, Bagadia P, Haldar M, Schönheit J, Rosenbauer F, Murphy TL, Murphy KM
Nature immunology 2015 Jul;16(7):708-17
Nature immunology 2015 Jul;16(7):708-17
Beta-catenin signaling drives differentiation and proinflammatory function of IRF8-dependent dendritic cells.
Cohen SB, Smith NL, McDougal C, Pepper M, Shah S, Yap GS, Acha-Orbea H, Jiang A, Clausen BE, Rudd BD, Denkers EY
Journal of immunology (Baltimore, Md. : 1950) 2015 Jan 1;194(1):210-22
Journal of immunology (Baltimore, Md. : 1950) 2015 Jan 1;194(1):210-22
No comments: Submit comment
Supportive validation
- Submitted by
- Invitrogen Antibodies (provider)
- Main image
- Experimental details
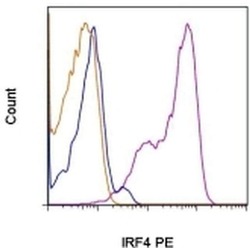
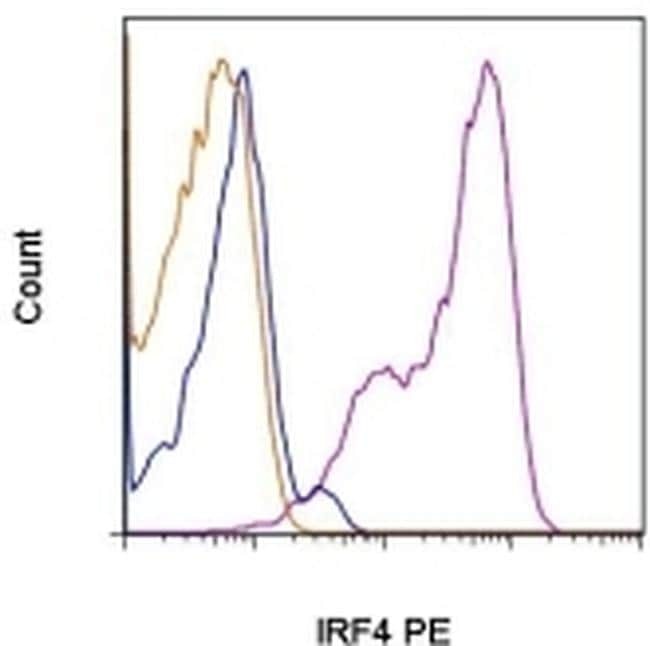
- Normal human peripheral blood cells were either unstimulated (blue historgam) or stimulated for 3 days with Anti-Human CD3 (Product # 16-0037-81) and Anti-Human CD28 (Product # 16-0289-81) (purple histogram). Cells were then fixed and permeabilized with the Foxp3 Fixation/Permeabilization Set (Product # 00-5523-00) and stained with Anti-Human CD4 FITC (Product # 11-0049-42) and 0.06 µg Anti-Human/Mouse IRF4 PE. CD4 positive cells were used for analysis and staining of stimulated cells with Rat IgG1 K Isotype Control PE (Product # 12-4301-82) (orange histogram) is included.
- Conjugate
- Yellow dye
Supportive validation
- Submitted by
- Invitrogen Antibodies (provider)
- Main image

- Experimental details
- NULL
- Conjugate
- Yellow dye
- Submitted by
- Invitrogen Antibodies (provider)
- Main image
- Experimental details
- NULL
- Conjugate
- Yellow dye
- Submitted by
- Invitrogen Antibodies (provider)
- Main image

- Experimental details
- NULL
- Conjugate
- Yellow dye
- Submitted by
- Invitrogen Antibodies (provider)
- Main image

- Experimental details
- NULL
- Conjugate
- Yellow dye
- Submitted by
- Invitrogen Antibodies (provider)
- Main image

- Experimental details
- NULL
- Conjugate
- Yellow dye
- Submitted by
- Invitrogen Antibodies (provider)
- Main image
- Experimental details
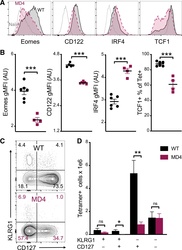
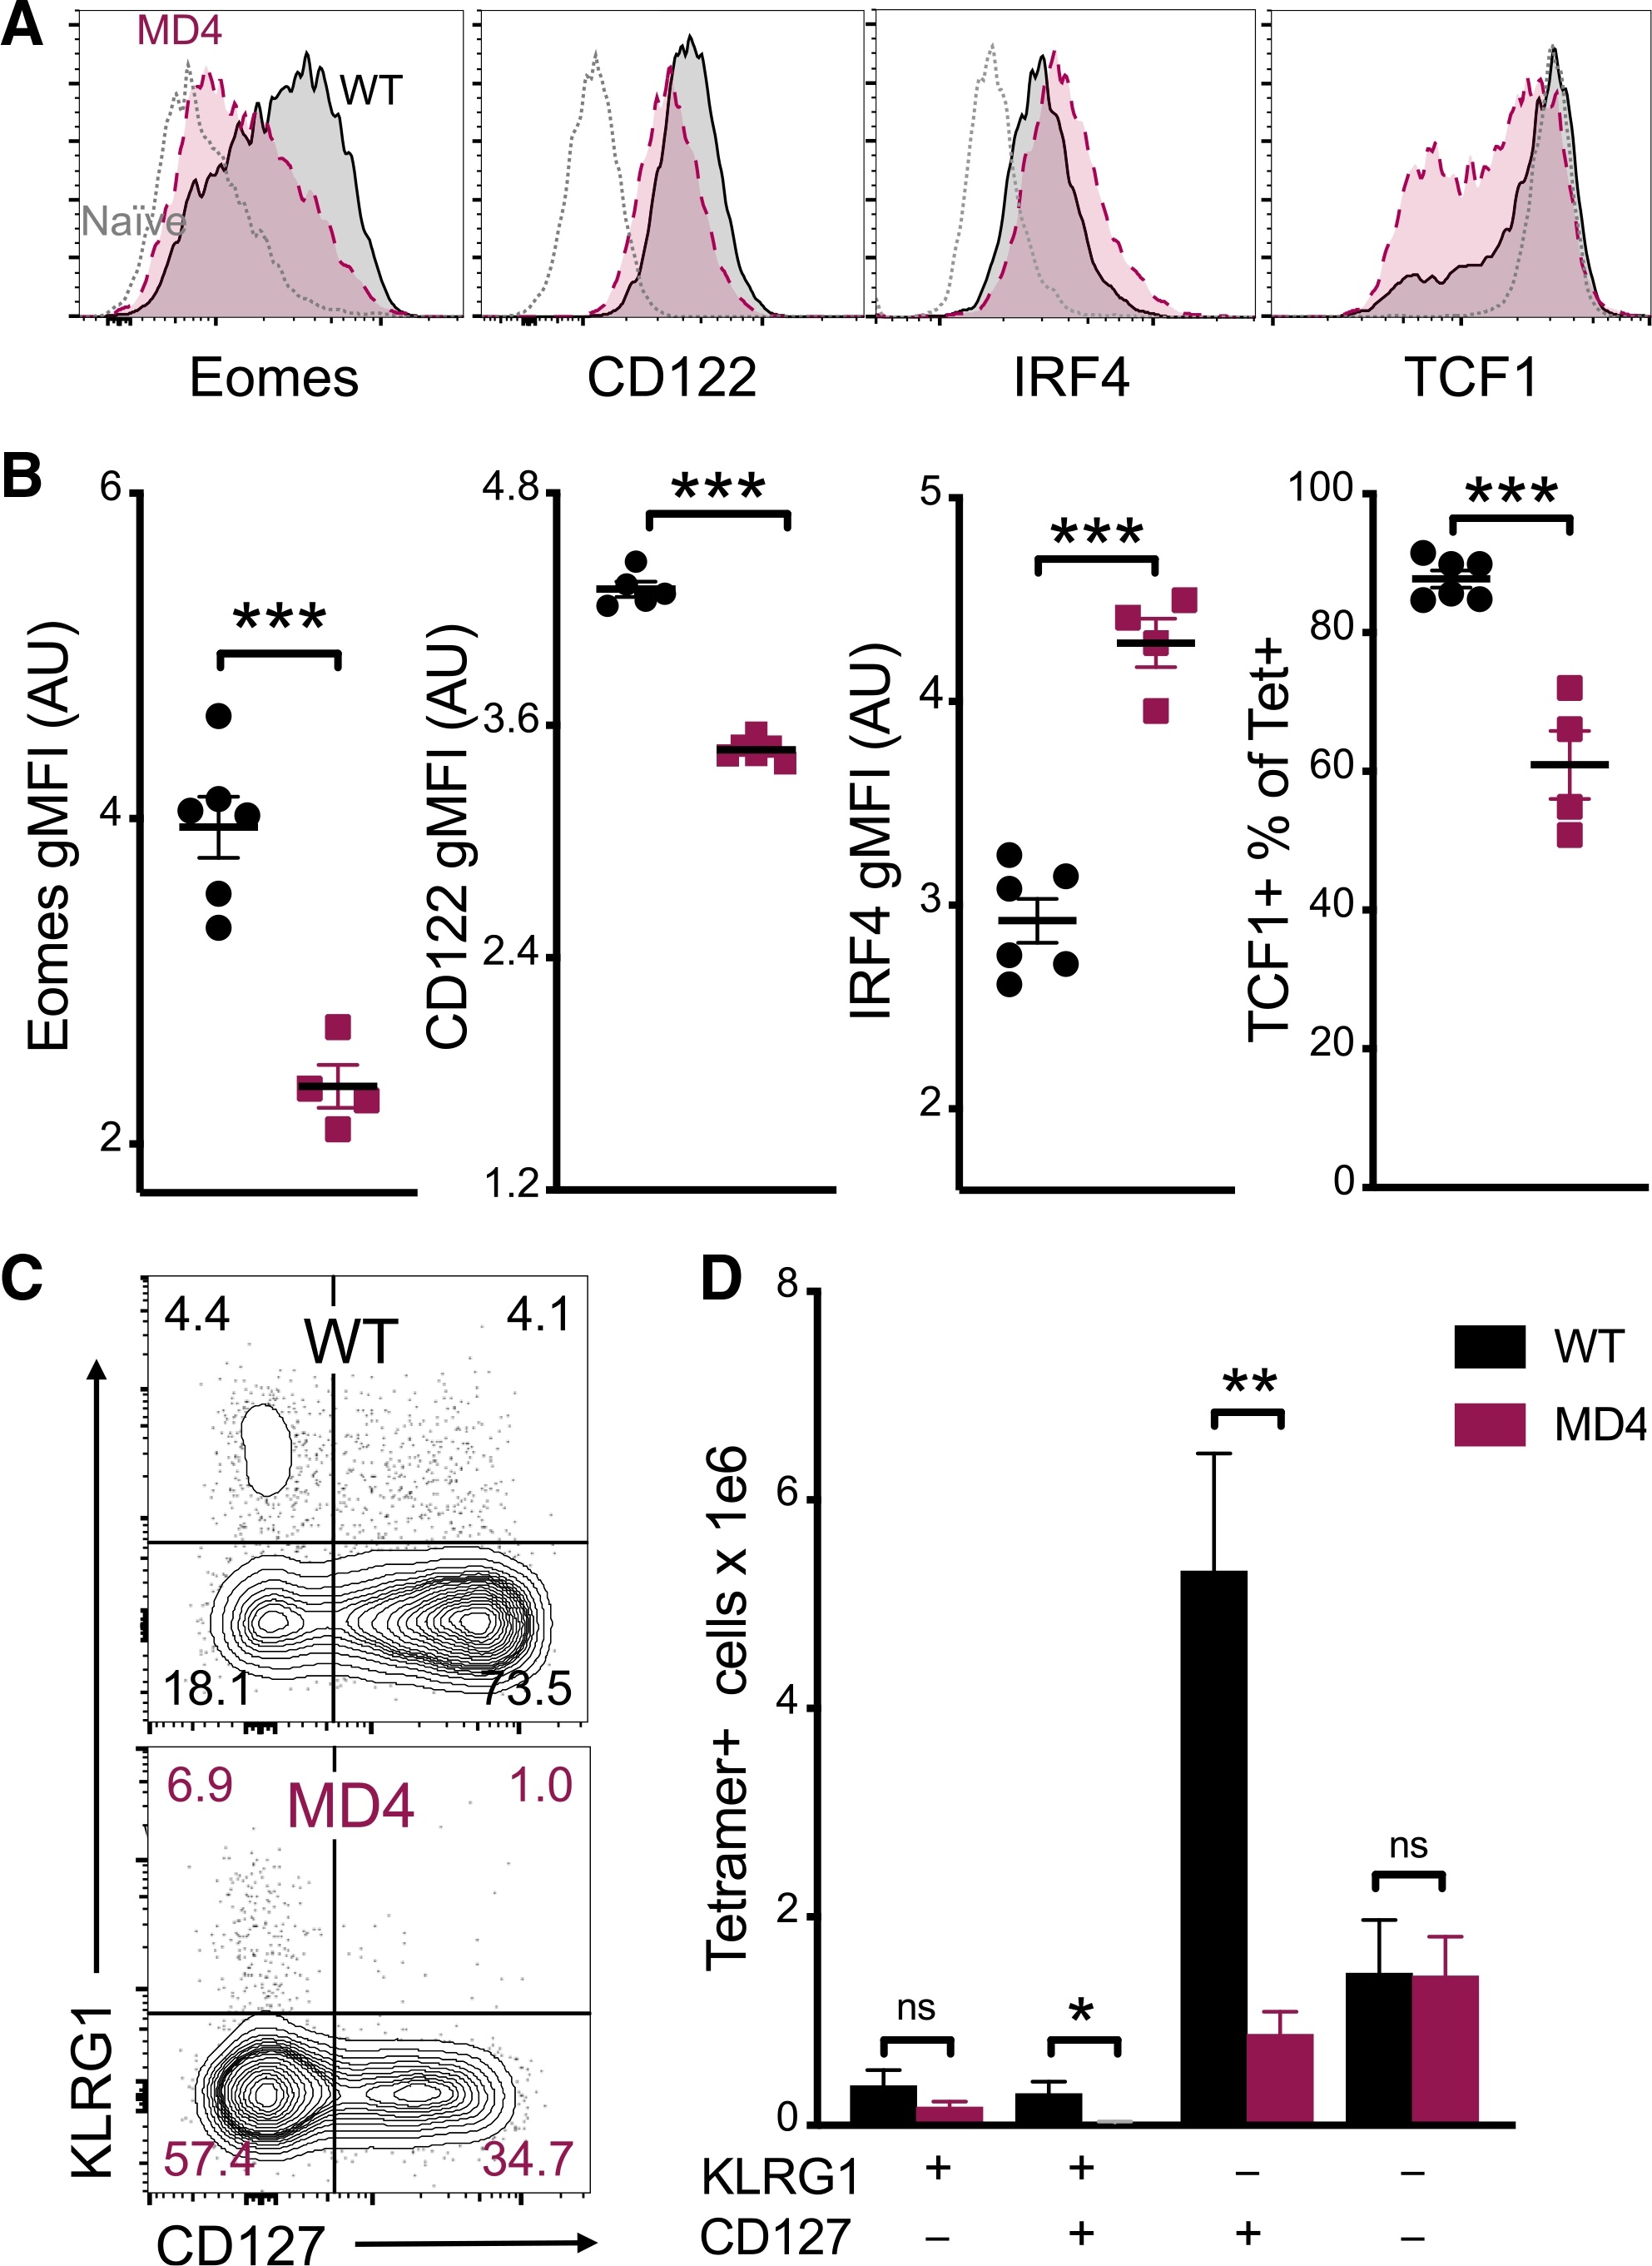
- Figure 4. B cells promote CD8 T cell memory programming following subunit vaccination (A) Representative histograms for Eomes, CD122, IRF4, and TCF1 staining of tetramer+ cells from WT (black) or MD4 (maroon) mice 7 days after combined-adjuvant vaccination or for CD44- naive control CD8 T cells (gray). (B) The gMFI of tetramer+ cells for Eomes, CD122, and IRF4, where the x axis intersects the y axis at the average gMFI value for CD44- naive controls, and the percentage of tetramer+ cells that stained positive for TCF1. (C and D) Representative KLRG1 versus CD127 staining (C) and numbers of tetramer+ splenocytes in the respective quadrants (D), 7 days after immunization. Data shown are means +- SEM; n : mice per group, representative of 3 experiments. Significance was defined by two-tailed, unpaired Student's t tests, where *p < 0.05, **p < 0.01, and ***p < 0.001.
- Conjugate
- Yellow dye
- Submitted by
- Invitrogen Antibodies (provider)
- Main image
- Experimental details
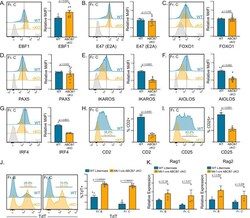
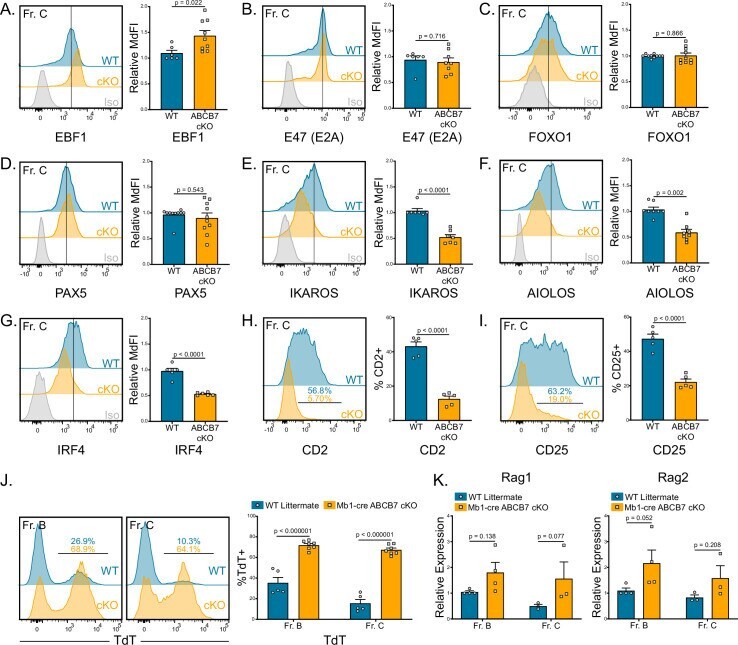
- Figure 2. Gene expression changes confirm absence of pre-B cells in Mb1-cre ABCB7 conditional knockout (cKO) mice. Analysis of critical transcription factors in wild-type (WT) and Mb1-cre ABCB7 cKO Fr. C cells (B220 + CD19 + CD43 + BP-1 + ). ( A-G ) Intracellular flow cytometry analysis of EBF1 ( A ), E47 (E2A) ( B ), FOXO1 ( C ), PAX5 ( D ), IKAROS ( E ), AIOLOS ( F ), and IRF4 ( G ) expression. Quantification of MdFI is shown on the right of each plot. Isotype controls are shown in gray. Offset histograms are representative of at least three independent experiments (total of 6-10 mice/group). ( H, I ) Flow cytometry analysis of CD2 ( H ) and CD25 ( I ) expression. Indicated values are the proportion of Fr. C cells positive for either marker, and quantifications are shown on the right of each plot. Offset histograms are representative of three independent experiments (total of five mice/group). ( J ) Intracellular flow cytometry analysis of TdT expression in Fr. B and Fr. C cells. Indicated values are the proportion of cells positive for TdT expression, and quantifications are shown on the right. Offset histograms are representative of three independent experiments (total of 5-7 mice/group). ( K ) Quantitative real-time PCR analysis of Rag1 and Rag2 expression in sorted Fr. B and Fr. C cells. 18S rRNA was used as an endogenous control, and relative expression values were normalized to expression in WT Fr. B cells. Results were obtained from three independent experiments (tot
- Conjugate
- Yellow dye
- Submitted by
- Invitrogen Antibodies (provider)
- Main image
- Experimental details
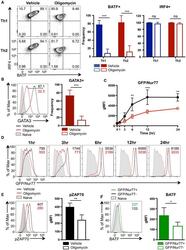
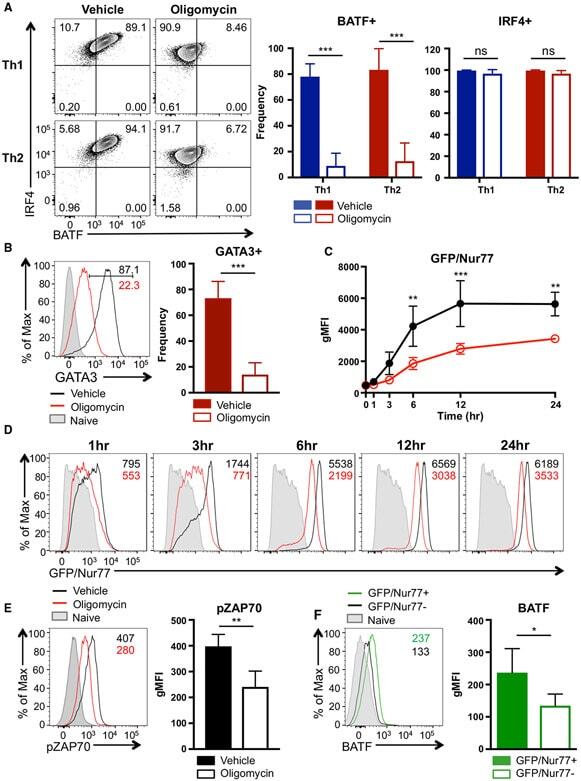
- Figure 4. ATP-Linked OXPHOS Controls BATF Induction by Regulating TCR Signaling (A and B) Naive CD4 T cells were differentiated under Th1 or Th2 polarizing conditions in the presence of vehicle or oligomycin for 24 h, and expression of (A) BATF, IRF4, and (B) GATA3 was determined by flow cytometry (4 to 5 independent experiments). (C and D) Naive CD4 T cells from Nur77/GFP spleens were activated under Th17 conditions in the presence of vehicle or oligomycin for indicated period of time. (C) Graph shows the expression of Nur77/GFP. (D) Representative plots are gated on live CD4 T cells (representative of 3 independent experiments). (E) Naive CD4 T cells were activated under Th17 conditions with vehicle or oligomycin. Representative histogram overlay shows the phosphorylation of ZAP70 at 24 h (representative of 5 independent experiments). (F) Naive CD4 T cells from Nur77/GFP reporter spleens were stimulated with Th17 cytokines for 6 h. BATF expression in GFP + and GFP - cells were determined by flow cytometry (3 independent experiments). Graphs show the average +- SD; (A and C) two-way ANOVA; (B, E and F) unpaired t test *p < 0.05, **p < 0.01, ***p < 0.001.
- Conjugate
- Yellow dye
- Submitted by
- Invitrogen Antibodies (provider)
- Main image

- Experimental details
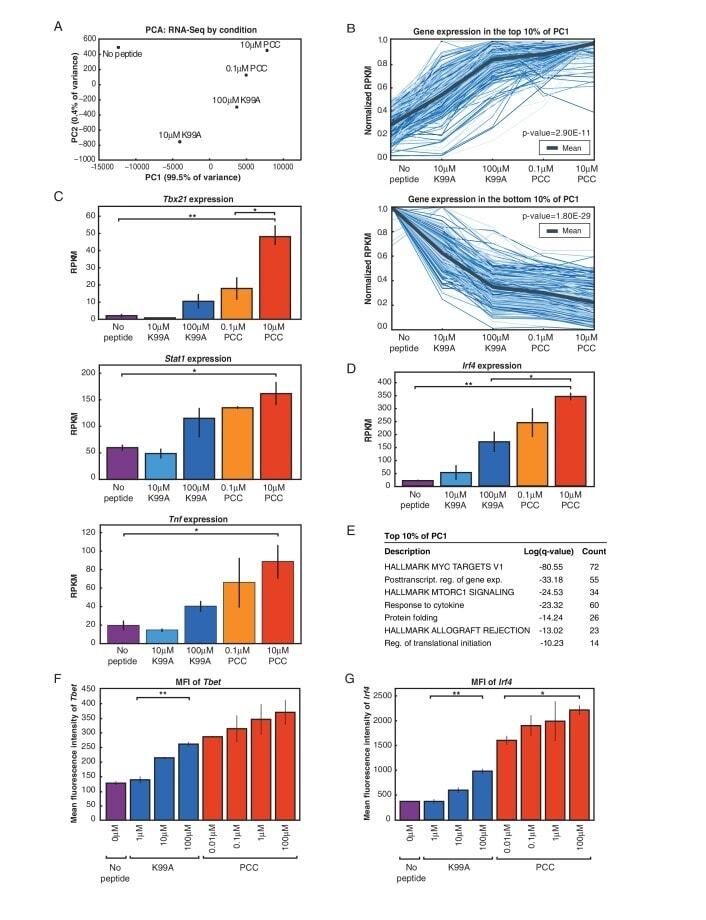
- Figure 2. RNA-Sequencing reveals graded expression of activation signature genes. ( A ) Principal component analysis (PCA) of the approximately 3,200 genes that changed between any two samples reveals that the primary axis of variation (PC1, shown along the x-axis) orders the five conditions by increasing TCR signal strength: No Peptide; low-dose, low-affinity (10 muM K99A); high-dose, low-affinity (100 muM K99A); low-dose, high-affinity (0.1 muM PCC); and high-dose, high-affinity (10 muM PCC). ( B ) After ordering the ~3200 genes used for PCA by their contribution to PC1, we extracted the top 10%--that is, the ~320 genes contributing most positively to a sample's PC1 value--and the bottom 10%--that is, the ~320 genes contributing most negatively to a sample's PC1 value. Each group displays a clear trend, with the top 10% increasing in expression as signal strength increases, and the bottom 10% decreasing in expression. Each blue line represents a gene, with reads per kilobase per million (RPKM) normalized from 0 to 1 across the five conditions. Significance was determined using permutation testing, where the mean difference between genes in the No Peptide sample as compared to 10 muM PCC was normally distributed over randomly generated groups of genes. This normal distribution was compared to the top 10% and bottom 10% genes to generate a p-value. ( C ) Genes in the top 10% of PC1, termed activation signature genes, include many genes previously identified as impor
- Conjugate
- Yellow dye
- Submitted by
- Invitrogen Antibodies (provider)
- Main image
- Experimental details
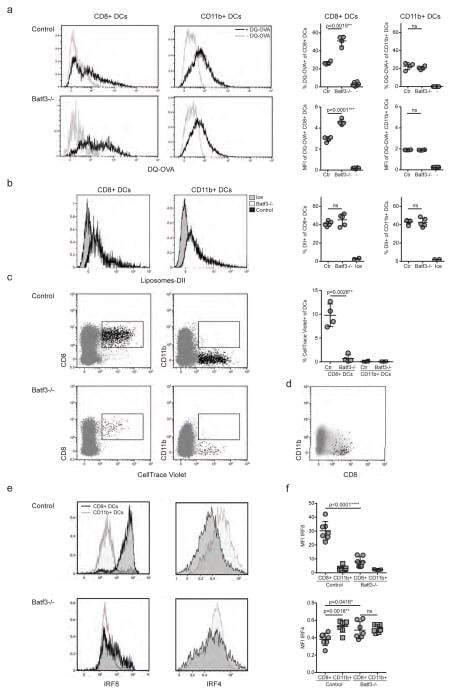
- Figure 4 IRF4-expressing CD8+ DCs in Batf3-/- mice are able to process antigen but lose capacity to take up dying cells (a) Splenocytes of Batf3-/- and control mice were incubated with DQ-OVA for 3 hours and subsequently analysed by flow cytometry for DQ-OVA processing. CD8+ and CD11b+ dendritic cell subsets were gated as shown in Figure 2 . Shown are representative histograms of green fluorescence (DQ-OVA) of treated versus untreated CD8+ and CD11b+ DCs in Batf3-/- and control splenocytes. The percentage and MFI of DQ-OVA+ CD8+ or CD11b+ DCs as well as of untreated samples (-) was compared. Each point represents a sample of one animal with indication of mean +/- SD of whole group (n=4). Shown is one of two independent experiments. (b) Splenocytes of Batf3-/- and control mice were incubated with DiI-labelled liposomes for 90 min and subsequently analysed by flow cytometry for liposome uptake. Shown are representative histograms of red fluorescence (DiI+) of CD8+ and CD11b+ DCs in Batf3-/- and control splenocytes incubated at 37degC or on ice. The percentage of DiI+ cells of CD8+ or CD11b+ DCs was compared. Each point represents a sample of one animal with indication of mean+/- SD of the whole group (n=5). (c-d) CellTrace Violet labelled, UV irradiated dying cells were injected into Batf3-/- and control mice. 3 hours later, splenic CD11b+ and CD8+ DCs were analysed for endocytosis of dying cells. (c) Shown are flow cytometry plots that were pre-gated on DCs as shown in Supplem
- Conjugate
- Yellow dye
- Submitted by
- Invitrogen Antibodies (provider)
- Main image
- Experimental details
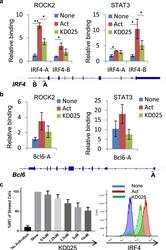
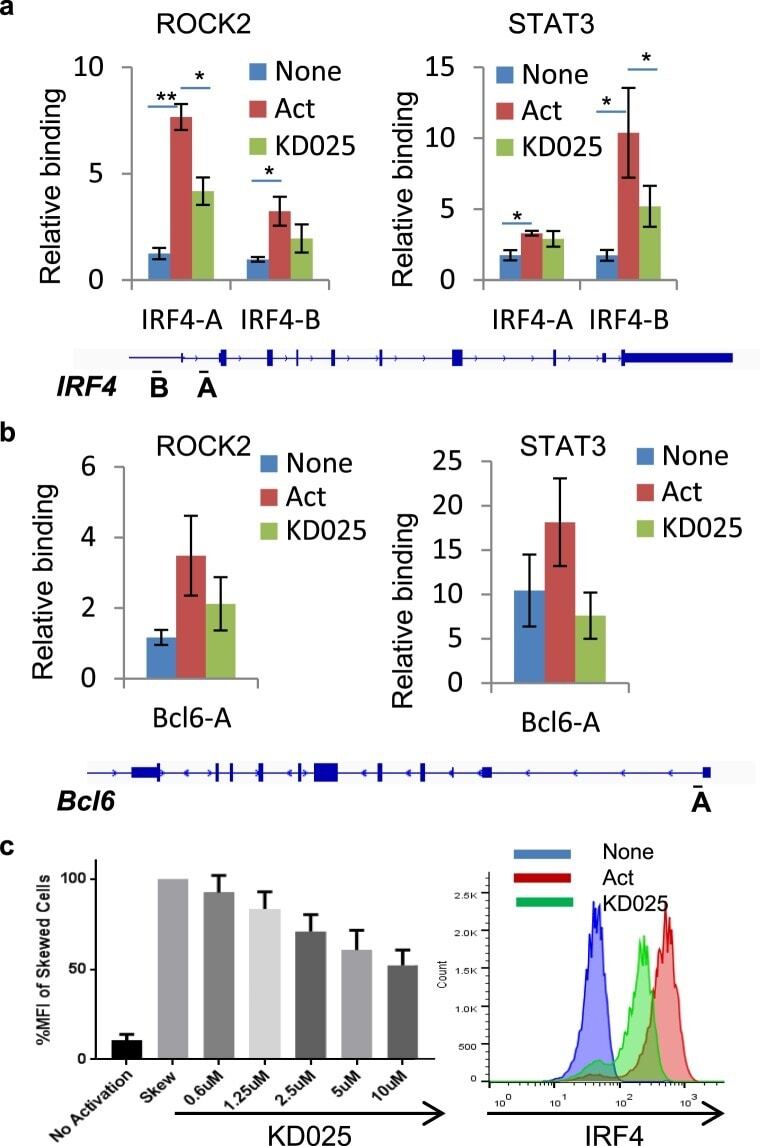
- Figure 3 Targeted ROCK2 inhibition decreased the binding of ROCK2 to the Irf4 and Bcl6 promoters at Th17-skewing conditions. Human peripheral blood CD4 + T cells were stimulated under Th17-skewing conditions for 48 hours in the absence or presence of KD025, chromatin was purified and proceeded to ChIP-qPCR analyses with anti-ROCK2 or anti-STAT3 antibodies ( a , b ), or Cells were stained with antibodies to IRF4 and analyzed by Flow Cytometry ( c , d ). ( c ) IRF4 expression measured by flow cytometry. Left, Mean Fluorescence Index (MFI) for IRF4 is plotted as percentage of MFI for skewed cells (as 100%). Right, Histogram of the flow cytometry analysis. The average of four different experiments is shown. *p < 0.05; **p < 0.01.
- Conjugate
- Yellow dye
- Submitted by
- Invitrogen Antibodies (provider)
- Main image
- Experimental details
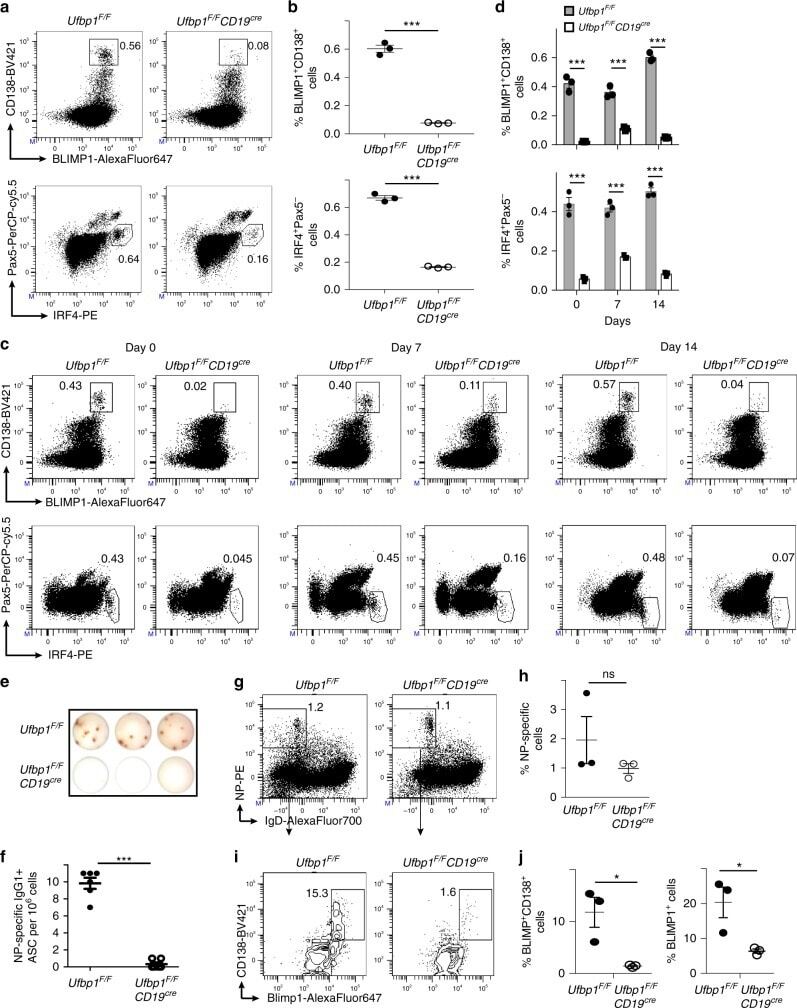
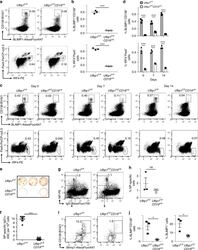
- Fig. 2 Decreased number of plasma cells in Ufbp1 F/F CD19 cre mice. a Bone marrow cells from indicated mice were stained with BLIMP1, CD138, IRF4, and Pax5, and analyzed by flow cytometry. Shown is the BLIMP1 versus CD138 (upper panel), and IRF4 versus Pax5 staining (lower panel) b Enumeration of frequencies of BLIMP1 + CD138 + and IRF4 + Pax5 - cells in a ( n = 3 mice/genotype). c Ufbp1 F/F and Ufbp1 F/F CD19 cre mice immunized with 4-hydroxy-3-nitrophenylacetyl conjugated to keyhole limpet hemocyanin (NP-KLH) as in Fig. 1c were analyzed for plasma cells (BLIMP1 + CD138 + and IRF4 + Pax5 - ) in bone marrow by flow cytometry at the indicated time points after immunization. d Enumeration of the frequencies of plasma cells (BLIMP1 + CD138 + and IRF4 + Pax5 - ) in c ( n = 3 mice/genotype). e Indicated mice were immunized as in Fig. 1c . Twenty-one days later, bone marrow cells were analyzed for the presence of NP-specific IgG1 + ASCs by ELISpot. Shown is a photograph of representative ELISpot wells. f Number (mean +- SEM) of NP-specific IgG1 + ELISpots in e ( n = 6 mice/genotype). g Ufbp1 F/F and Ufbp1 F/F CD19 cre mice were immunized with NP-KLH in Sigma Adjuvant System and on day 10, 7-AAD - CD4 - CD8 - Gr-1 - CD11b - splenic cells were analyzed for IgD and NP staining by flow cytometry. h Enumeration of the frequency of IgD - NP + cells in g ( n = 3 mice/genotype). i BLIMP1 and CD138 expression by IgD - NP + cells in g was an
- Conjugate
- Yellow dye