Explore
 Validate
 Learn
Learn Flow cytometry
Antibody data
- Antibody Data
- Antigen structure
- References [14]
- Comments [0]
- Validations
- Flow cytometry [2]
- Other assay [7]
Submit
Validation data
Reference
Comment
Report error
- Product number
- 17-9852-80 - Provider product page

- Provider
- Invitrogen Antibodies
- Product name
- IRF8 Monoclonal Antibody (V3GYWCH), APC, eBioscience™
- Antibody type
- Monoclonal
- Antigen
- Other
- Description
- Description: The V3GYWCH monoclonal antibody reacts with human and mouse interferon regulatory factor 8 (IRF8; ICSBP). IRF8 is a 50 kDa transcription factor that plays a critical role in the development of dendritic cells (DC). Specifically, IRF8 is essential in the development and differentiation of plasmacytoid DC (pDC) and CD8a+ DC. IRF8-/- mice are deficient in both pDC and CD8a+ DC populations. CD8a- DC are present in normal numbers in IRF8-/- mice but fail to mature upon Toll-like receptor signaling and are functionally impaired in response to in vivo microbial stimulation. IRF8 deficiency does not affect the frequency or viability of DC precursors and as a result retroviral IRF8 transduction restores pDC development from DC progenitors in IRF8-/- mice. Applications Reported: This V3GYWCH antibody has been reported for use in intracellular staining followed by flow cytometric analysis. Applications Tested: This V3GYWCH antibody has been tested by intracellular staining and flow cytometric analysis of normal human peripheral blood cells using the Foxp3/Transcription Factor Staining Buffer Set (Product # 00-5523-00) and protocol. Please refer to BestProtocols®: Protocol B: One-step protocol: intracellular (nuclear) proteins located under the Resources Tab online. This can be used at less than or equal to 0.25 µg per test. A test is defined as the amount (µg) of antibody that will stain a cell sample in a final volume of 100 µL. Cell number should be determined empirically but can range from 10^5 to 10^8 cells/test. It is recommended that the antibody be carefully titrated for optimal performance in the assay of interest. Excitation: 633-647 nm; Emission: 660 nm; Laser: Red Laser. Filtration: 0.2 µm post-manufacturing filtered.
- Reactivity
- Human, Mouse
- Host
- Mouse
- Isotype
- IgG
- Antibody clone number
- V3GYWCH
- Vial size
- 25 μg
- Concentration
- 0.2 mg/mL
- Storage
- 4°C, store in dark, DO NOT FREEZE!
Submitted references DNA methylation signatures of Alzheimer's disease neuropathology in the cortex are primarily driven by variation in non-neuronal cell-types.
Androgen Receptor Signaling Positively Regulates Monocytic Development.
Chromatin Landscape Underpinning Human Dendritic Cell Heterogeneity.
Single-Cell RNA-Seq Mapping of Human Thymopoiesis Reveals Lineage Specification Trajectories and a Commitment Spectrum in T Cell Development.
Inflammatory Type 2 cDCs Acquire Features of cDC1s and Macrophages to Orchestrate Immunity to Respiratory Virus Infection.
CD103(+) cDC1 and endogenous CD8(+) T cells are necessary for improved CD40L-overexpressing CAR T cell antitumor function.
Lower Interferon Regulatory Factor-8 Expression in Peripheral Myeloid Cells Tracks With Adverse Central Nervous System Outcomes in Treated HIV Infection.
NK Cells Stimulate Recruitment of cDC1 into the Tumor Microenvironment Promoting Cancer Immune Control.
Batf3 selectively determines acquisition of CD8(+) dendritic cell phenotype and function.
Cell-intrinsic expression of TLR9 in autoreactive B cells constrains BCR/TLR7-dependent responses.
Beta-catenin signaling drives differentiation and proinflammatory function of IRF8-dependent dendritic cells.
IRF8 mutations and human dendritic-cell immunodeficiency.
Essential role for ICSBP in the in vivo development of murine CD8alpha + dendritic cells.
Cutting edge: IFN consensus sequence binding protein/IFN regulatory factor 8 drives the development of type I IFN-producing plasmacytoid dendritic cells.
Shireby G, Dempster EL, Policicchio S, Smith RG, Pishva E, Chioza B, Davies JP, Burrage J, Lunnon K, Seiler Vellame D, Love S, Thomas A, Brookes K, Morgan K, Francis P, Hannon E, Mill J
Nature communications 2022 Sep 24;13(1):5620
Nature communications 2022 Sep 24;13(1):5620
Androgen Receptor Signaling Positively Regulates Monocytic Development.
Consiglio CR, Gollnick SO
Frontiers in immunology 2020;11:519383
Frontiers in immunology 2020;11:519383
Chromatin Landscape Underpinning Human Dendritic Cell Heterogeneity.
Leylek R, Alcántara-Hernández M, Granja JM, Chavez M, Perez K, Diaz OR, Li R, Satpathy AT, Chang HY, Idoyaga J
Cell reports 2020 Sep 22;32(12):108180
Cell reports 2020 Sep 22;32(12):108180
Single-Cell RNA-Seq Mapping of Human Thymopoiesis Reveals Lineage Specification Trajectories and a Commitment Spectrum in T Cell Development.
Le J, Park JE, Ha VL, Luong A, Branciamore S, Rodin AS, Gogoshin G, Li F, Loh YE, Camacho V, Patel SB, Welner RS, Parekh C
Immunity 2020 Jun 16;52(6):1105-1118.e9
Immunity 2020 Jun 16;52(6):1105-1118.e9
Inflammatory Type 2 cDCs Acquire Features of cDC1s and Macrophages to Orchestrate Immunity to Respiratory Virus Infection.
Bosteels C, Neyt K, Vanheerswynghels M, van Helden MJ, Sichien D, Debeuf N, De Prijck S, Bosteels V, Vandamme N, Martens L, Saeys Y, Louagie E, Lesage M, Williams DL, Tang SC, Mayer JU, Ronchese F, Scott CL, Hammad H, Guilliams M, Lambrecht BN
Immunity 2020 Jun 16;52(6):1039-1056.e9
Immunity 2020 Jun 16;52(6):1039-1056.e9
CD103(+) cDC1 and endogenous CD8(+) T cells are necessary for improved CD40L-overexpressing CAR T cell antitumor function.
Kuhn NF, Lopez AV, Li X, Cai W, Daniyan AF, Brentjens RJ
Nature communications 2020 Dec 2;11(1):6171
Nature communications 2020 Dec 2;11(1):6171
Lower Interferon Regulatory Factor-8 Expression in Peripheral Myeloid Cells Tracks With Adverse Central Nervous System Outcomes in Treated HIV Infection.
D'Antoni ML, Kallianpur KJ, Premeaux TA, Corley MJ, Fujita T, Laws EI, Ogata-Arakaki D, Chow DC, Khadka VS, Shikuma CM, Ndhlovu LC
Frontiers in immunology 2019;10:2789
Frontiers in immunology 2019;10:2789
NK Cells Stimulate Recruitment of cDC1 into the Tumor Microenvironment Promoting Cancer Immune Control.
Böttcher JP, Bonavita E, Chakravarty P, Blees H, Cabeza-Cabrerizo M, Sammicheli S, Rogers NC, Sahai E, Zelenay S, Reis e Sousa C
Cell 2018 Feb 22;172(5):1022-1037.e14
Cell 2018 Feb 22;172(5):1022-1037.e14
Batf3 selectively determines acquisition of CD8(+) dendritic cell phenotype and function.
Chandra J, Kuo PT, Hahn AM, Belz GT, Frazer IH
Immunology and cell biology 2017 Feb;95(2):215-223
Immunology and cell biology 2017 Feb;95(2):215-223
Cell-intrinsic expression of TLR9 in autoreactive B cells constrains BCR/TLR7-dependent responses.
Nündel K, Green NM, Shaffer AL, Moody KL, Busto P, Eilat D, Miyake K, Oropallo MA, Cancro MP, Marshak-Rothstein A
Journal of immunology (Baltimore, Md. : 1950) 2015 Mar 15;194(6):2504-12
Journal of immunology (Baltimore, Md. : 1950) 2015 Mar 15;194(6):2504-12
Beta-catenin signaling drives differentiation and proinflammatory function of IRF8-dependent dendritic cells.
Cohen SB, Smith NL, McDougal C, Pepper M, Shah S, Yap GS, Acha-Orbea H, Jiang A, Clausen BE, Rudd BD, Denkers EY
Journal of immunology (Baltimore, Md. : 1950) 2015 Jan 1;194(1):210-22
Journal of immunology (Baltimore, Md. : 1950) 2015 Jan 1;194(1):210-22
IRF8 mutations and human dendritic-cell immunodeficiency.
Hambleton S, Salem S, Bustamante J, Bigley V, Boisson-Dupuis S, Azevedo J, Fortin A, Haniffa M, Ceron-Gutierrez L, Bacon CM, Menon G, Trouillet C, McDonald D, Carey P, Ginhoux F, Alsina L, Zumwalt TJ, Kong XF, Kumararatne D, Butler K, Hubeau M, Feinberg J, Al-Muhsen S, Cant A, Abel L, Chaussabel D, Doffinger R, Talesnik E, Grumach A, Duarte A, Abarca K, Moraes-Vasconcelos D, Burk D, Berghuis A, Geissmann F, Collin M, Casanova JL, Gros P
The New England journal of medicine 2011 Jul 14;365(2):127-38
The New England journal of medicine 2011 Jul 14;365(2):127-38
Essential role for ICSBP in the in vivo development of murine CD8alpha + dendritic cells.
Aliberti J, Schulz O, Pennington DJ, Tsujimura H, Reis e Sousa C, Ozato K, Sher A
Blood 2003 Jan 1;101(1):305-10
Blood 2003 Jan 1;101(1):305-10
Cutting edge: IFN consensus sequence binding protein/IFN regulatory factor 8 drives the development of type I IFN-producing plasmacytoid dendritic cells.
Tsujimura H, Tamura T, Ozato K
Journal of immunology (Baltimore, Md. : 1950) 2003 Feb 1;170(3):1131-5
Journal of immunology (Baltimore, Md. : 1950) 2003 Feb 1;170(3):1131-5
No comments: Submit comment
Supportive validation
- Submitted by
- Invitrogen Antibodies (provider)
- Main image

- Experimental details
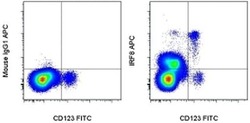
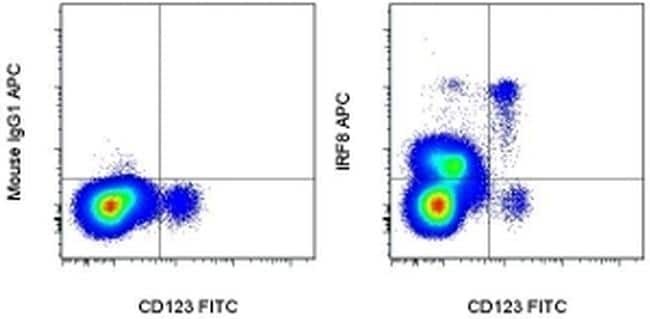
- Surface staining of normal human peripheral blood cells with Anti-Human CD123 FITC (Product # 11-1239-42) followed by intracellular staining with 0.125 µg of Mouse IgG1 K Isotype Control APC (Product # 17-4714-81) (left) or 0.125 µg of Anti-Human/Mouse IRF8 APC (right) using the Foxp3/Transcription Factor Staining Buffer Set (Product # 00-5523-00) and protocol. Cells in the monocyte gate were used for analysis.

- Submitted by
- Invitrogen Antibodies (provider)
- Main image
- Experimental details
- Surface staining of normal human peripheral blood cells with Anti-Human CD123 FITC (Product # 11-1239-42) followed by intracellular staining with 0.125 µg of Mouse IgG1 K Isotype Control APC (Product # 17-4714-81) (left) or 0.125 µg of Anti-Human/Mouse IRF8 APC (right) using the Foxp3/Transcription Factor Staining Buffer Set (Product # 00-5523-00) and protocol. Cells in the monocyte gate were used for analysis.
Supportive validation
- Submitted by
- Invitrogen Antibodies (provider)
- Main image

- Experimental details
- NULL
- Submitted by
- Invitrogen Antibodies (provider)
- Main image
- Experimental details
- NULL
- Submitted by
- Invitrogen Antibodies (provider)
- Main image
- Experimental details
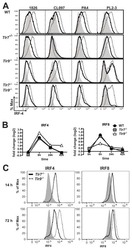
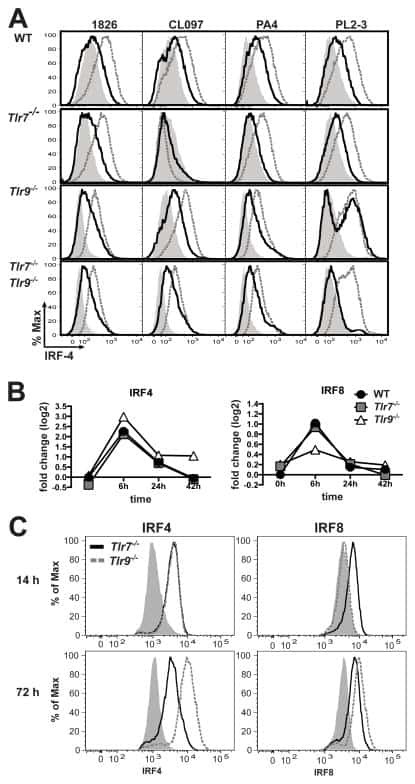
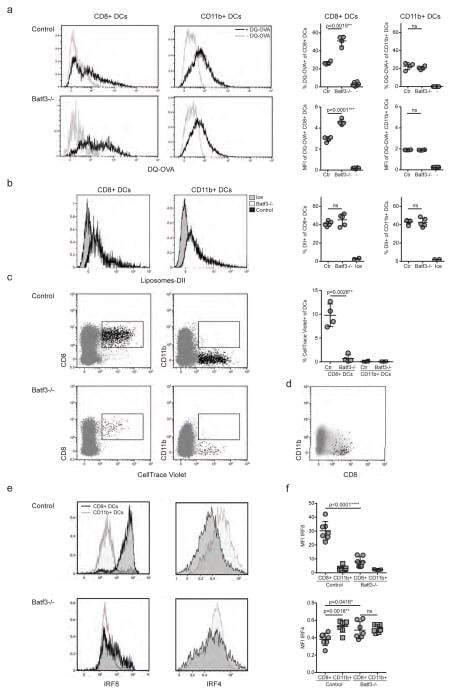
- Figure 4 IRF4-expressing CD8+ DCs in Batf3-/- mice are able to process antigen but lose capacity to take up dying cells (a) Splenocytes of Batf3-/- and control mice were incubated with DQ-OVA for 3 hours and subsequently analysed by flow cytometry for DQ-OVA processing. CD8+ and CD11b+ dendritic cell subsets were gated as shown in Figure 2 . Shown are representative histograms of green fluorescence (DQ-OVA) of treated versus untreated CD8+ and CD11b+ DCs in Batf3-/- and control splenocytes. The percentage and MFI of DQ-OVA+ CD8+ or CD11b+ DCs as well as of untreated samples (-) was compared. Each point represents a sample of one animal with indication of mean +/- SD of whole group (n=4). Shown is one of two independent experiments. (b) Splenocytes of Batf3-/- and control mice were incubated with DiI-labelled liposomes for 90 min and subsequently analysed by flow cytometry for liposome uptake. Shown are representative histograms of red fluorescence (DiI+) of CD8+ and CD11b+ DCs in Batf3-/- and control splenocytes incubated at 37degC or on ice. The percentage of DiI+ cells of CD8+ or CD11b+ DCs was compared. Each point represents a sample of one animal with indication of mean+/- SD of the whole group (n=5). (c-d) CellTrace Violet labelled, UV irradiated dying cells were injected into Batf3-/- and control mice. 3 hours later, splenic CD11b+ and CD8+ DCs were analysed for endocytosis of dying cells. (c) Shown are flow cytometry plots that were pre-gated on DCs as shown in Supplem
- Submitted by
- Invitrogen Antibodies (provider)
- Main image
- Experimental details
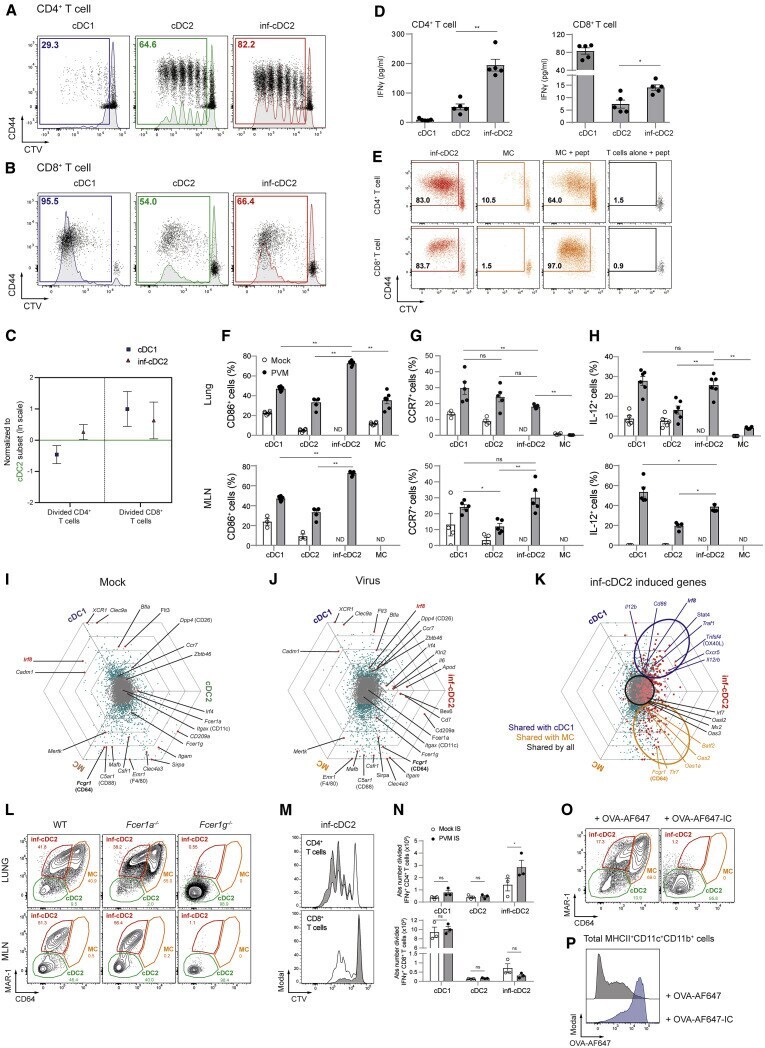
- Figure 2 Activated inf-cDC2s Share Characteristics with cDC1 and MC Subsets (A and B) Proliferation profile of CTV-labeled CD4 + (A) and CD8 + (B) PVM-specific TCR transgenic T cells cocultured for 4 days with different migratory cDC subsets sorted from 4-6 pooled MLNs 8 dpi with PVM (see also Figures S1 K-S1P). (C) Number of divided CD4 + and CD8 + PVM TCR transgenic T cells cocultured for 4 days with different migratory cDC subsets sorted from MLNs 8 dpi with PVM relative to the cDC2 subset, which is set to 0. Error bars represent 95% confidence intervals. Data were pooled from 3 independent experiments (n = 5-7). (D) IFN-gamma measured in supernatants of cocultured CD4 + and CD8 + PVM TCR transgenic T cells for 4 days with different MLN-derived cDC subsets sorted 8 dpi with PVM. Data are representative of 3 independent experiments. Error bars indicate +- SEM. Mann-Whitney U test; * p < 0.05, ** p < 0.01. (E) Proliferation profile of CTV-labeled CD4 + and CD8 + PVM TCR transgenic T cells cocultured for 4 days with T cells alone, inf-cDC2s, or MCs sorted from 3 pooled lungs 8 dpi with PVM. For peptide controls, 1 mug/mL of CD4 + (M37-M47) or CD8 + (N339-N347) immunodominant epitope was added ex vivo . (F-H) Percentage of CD86-expressing (F) and CCR7-expressing (G) and IL-12-producing (H) lung or migratory DC subsets in MLNs upon mock infection (white circles) or 10 dpi with PVM (black dots). For IL-12 staining, samples were restimulated ex vivo for 6 h. Data are representati
- Submitted by
- Invitrogen Antibodies (provider)
- Main image
- Experimental details
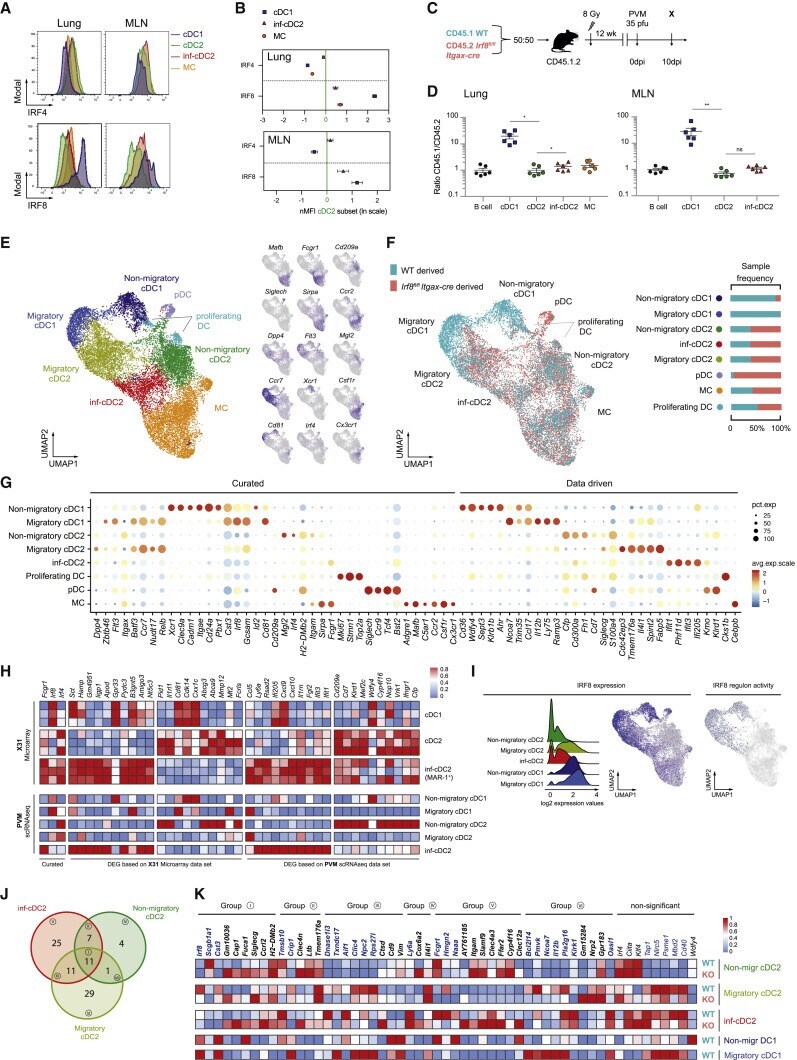
- Figure 3 IRF8 Controls the Gene Network in inf-cDC2s (A) Expression of IRF4 (top panel) and IRF8 (bottom panel) by different DC subsets in the lungs and MLNs 10 dpi with PVM. (B) Normalized Median Fluoresent Intensity (MFI) for IRF4 and IRF8 relative to the cDC2 subset, which is set to 0 for DC subsets in the lungs (top panel) or the different migratory cDC subsets in MLNs (bottom panel) 10 dpi with PVM. Error bars represent 95% confidence intervals. Data are representative of 3 independent experiments with 4-6 mice per group. (C) Schematic representation of CD45.1 WT:CD45.2 Irf8 fl/fl Itgax - cre BM chimeras. (D) Normalized CD45.1/CD45.2 ratio relative to B cells of DC subsets in the lungs (left panel) and migratory cDCs in MLNs (right) 10 dpi with PVM. Data are representative of 2 independent experiments with 4-6 mice per group, analyzed with a one-way ANOVA with Sidak correction for multiple comparisons. Error bars indicate +- SEM. * p < 0.05, ** p < 0.01; ns, not statistically significant. (E) UMAP plot of scRNA-seq data of pooled, sorted, live CD3-CD19-SiglecF-CD11c + MHCII + cells from lungs of CD45.1 WT:CD45.2 Irf8 fl/fl Itgax - cre chimeric mice 10 dpi with PVM, showing assigned clusters, and UMAPs showing expression of key annotation markers by color (gray, low expression; blue, high expression) (see also Figures S5 A-S5C). (F) UMAP plot overlay (left panel) similar to (E) but with the colors representing origin of the WT (teal) or Irf8 fl/fl Itgax -cre (red) compart
- Submitted by
- Invitrogen Antibodies (provider)
- Main image
- Experimental details
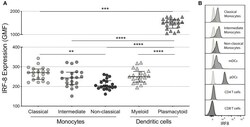
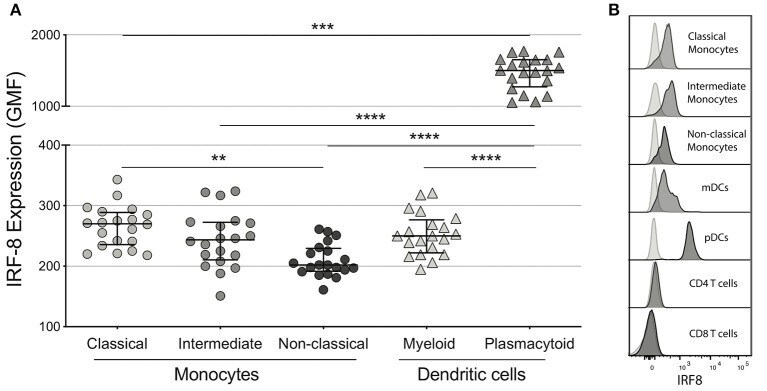
- Figure 1 IRF-8 expression on monocytes and dendritic cells. (A) Intracellular IRF-8 levels, expressed as geometric mean fluorescence intensity (GMF), on monocyte subsets (classical, intermediate, and non-classical) and dendritic cell (DC) subsets (myeloid and plasmacytoid). The hash mark indicates the median and error bars are the interquartile range. ** p < 0.01; *** p < 0.001, **** p < 0.0001. (B) Representative histograms of IRF-8 expression in each subset.
- Submitted by
- Invitrogen Antibodies (provider)
- Main image
- Experimental details
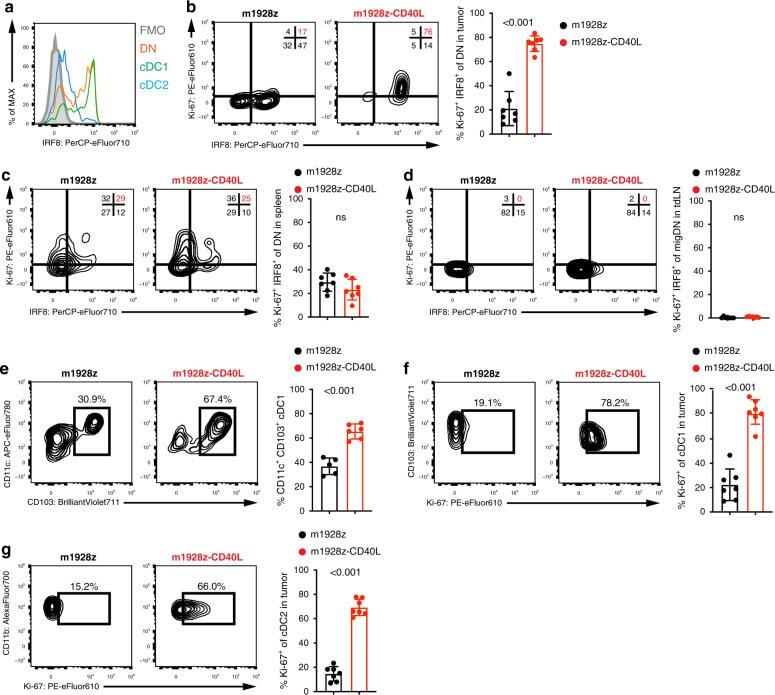
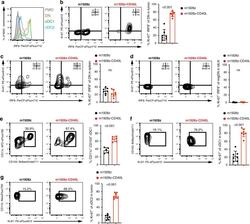
- Fig. 3 m1928z-CD40L CAR T cells stimulate tumor-resident CD11b-CD103- DN cDCs to proliferate, upregulate IRF8, and differentiate to cDC1s. a IRF8 expression in CD11b - CD103 - double-negative (DN) (orange), CD11b - CD103 + cDC1 (green), and CD11b + CD103 + cDC2 (blue) in the tumor of untreated A20.GL tumor-bearing mice. FMO, flow minus one. b - d Ki-67 and IRF8 expression shown as flow cytometry contour plots in CD11b - CD103 - DN cDCs in the tumor ( b ), spleen ( c ), and tumor-draining lymph nodes (tdLN) ( d ) of A20.GL tumor-bearing mice on day 7 after CAR T cell treatment. Percentage of Ki-67 + IRF8 + DN cDCs is summarized from two independent experiments ( n = 7/group). e CD45.2 + A20.GL tumor-bearing mice were treated with 3 x 10 6 CAR T cells i.v. and CD45.2 + CD11b - CD103 - DN cDCs were isolated from the tumor on day 3 by FACS. Sorted CD45.2 + DN cells were cultured in vitro on a CD45.1 + bone-marrow stromal layer for 3 days and the percentage of CD11c + CD103 + cDC1s of all CD45.2 + cells was analyzed. Shown are representative contour plots and the quantification of the percentage of CD11c + CD103 + cDC1s. Each dot represents one in vitro culture. Data were collected from two independently performed experiments (m1928z, n = 5; m1928z-CD40L, n = 6). f , g Ki-67 expression shown as contour plots in CD11b - CD103 + cDC1s ( f ) and CD11b + CD103 - cDC2s ( g ) in the tumor of A20.GL tumor-bearing mice on day 7 after CAR T cell treatment. Percentage of Ki-67 + cells is su