Explore
 Validate
 Learn
Learn Western blot
 Immunoprecipitation
Antibody data
- Antibody Data
- Antigen structure
- References [0]
- Comments [0]
- Validations
- Western blot [1]
- Immunohistochemistry [1]
- Chromatin Immunoprecipitation [1]
Submit
Validation data
Reference
Comment
Report error
- Product number
- A300-489A - Provider product page

- Provider
- Invitrogen Antibodies
- Product name
- ASH2 Polyclonal Antibody
- Antibody type
- Polyclonal
- Antigen
- Other
- Reactivity
- Human
- Host
- Rabbit
- Isotype
- IgG
- Vial size
- 100 µL
- Concentration
- 1 mg/mL
- Storage
- 4° C
No comments: Submit comment
Supportive validation
- Submitted by
- Invitrogen Antibodies (provider)
- Main image
- Experimental details
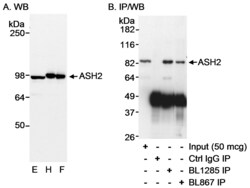
- Detection of human ASH2 by western blot and immunoprecipitation. Samples: A. Whole cell lysate from 293T cells that were mock transfected (E, 50 µg) or transfected with ASH2 expression constructs containing HA-tagged ASH2 (H, 25 µg) or Flag-tagged ASH2 (F, 25 µg). B. Whole cell lysate from one 10cm plate of normal 293T cells (~1 mg protein; 1/2 of IP loaded/lane). Antibodies: Affinity purified rabbit anti-ASH2 antibody A300-489A used at 1 µg/ml for WB (A and B) and at 5 µg/plate for IP. ASH2 was also immunoprecipitated with rabbit anti-ASH2 antibody A300-107A using 5 µg/plate. Detection: Chemiluminescence with an exposure time of 1 second (A and B).

Supportive validation
- Submitted by
- Invitrogen Antibodies (provider)
- Main image
- Experimental details
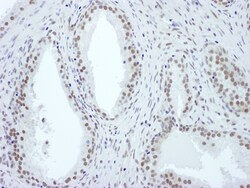
- Detection of human ASH2 by immunohistochemistry. Sample: FFPE section of human prostate carcinoma. Antibody: Affinity purified rabbit anti- ASH2 (Cat. No. A300-489A Lot2) used at a dilution of 1:1,000 (1µg/ml). Detection: DAB.

Supportive validation
- Submitted by
- Invitrogen Antibodies (provider)
- Main image
- Experimental details
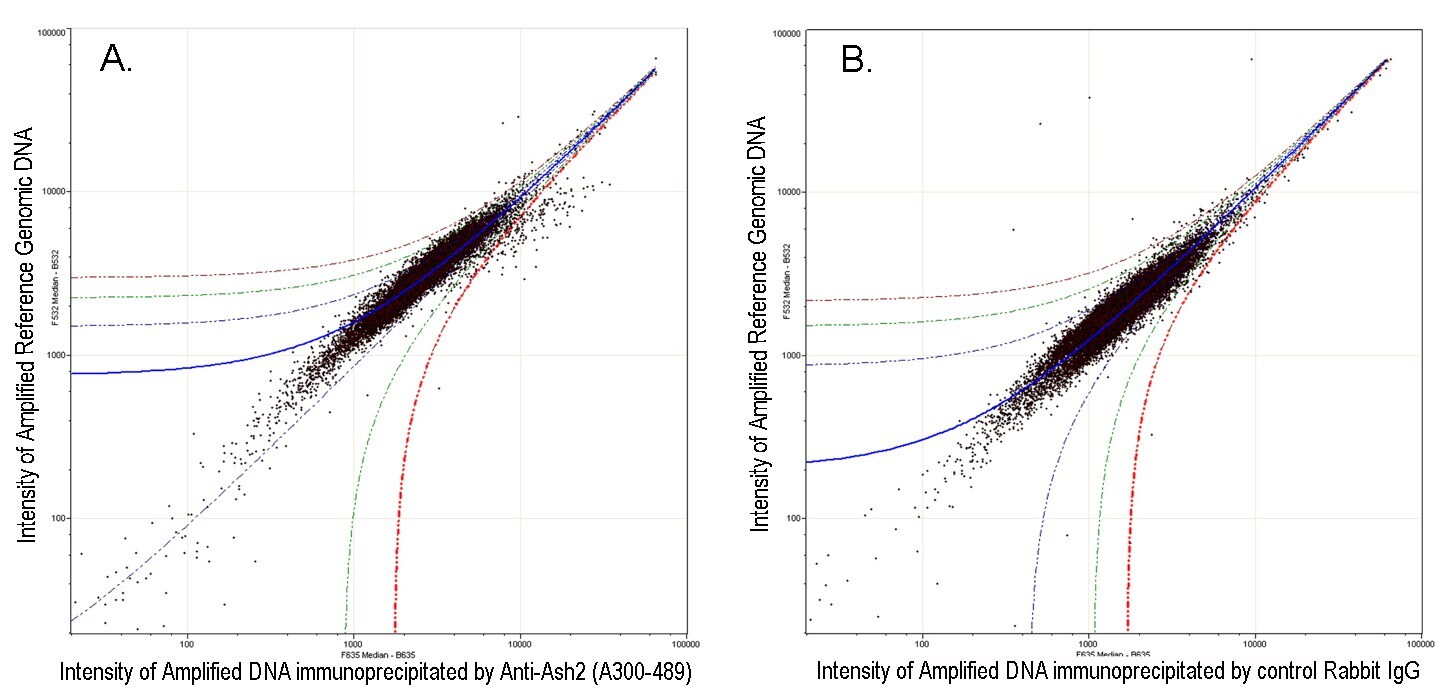
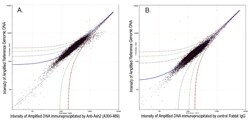
- ChIP-chip scatter plot of anti-Ash2 enriched DNA binding sites versus input reference DNA. A. 10 µg of A300-489A was used to immunoprecipitate chromatin from K562 cells according to Ren et al (Genes Dev. 2002 16: 245-256). immunoprecipitated DNA and reference DNA were amplified via ligation-mediated PCR and the products labeled with fluorescent dNTPs. The labeled ChIP and reference DNA were pooled, hybridized to a DNA microarray, and analyzed. Data points below the +3 SD curve (red line) represent significantly enriched binding sites. B. As a control, a similar experiment was performed using normal rabbit IgG. Compared to the anti-Ash2 ChIP, normal rabbit IgG showed little enrichment.