Explore
 Validate
 Learn
Learn Flow cytometry
Antibody data
- Antibody Data
- Antigen structure
- References [27]
- Comments [0]
- Validations
- Flow cytometry [1]
- Other assay [24]
Submit
Validation data
Reference
Comment
Report error
- Product number
- 16-0168-025 - Provider product page

- Provider
- Invitrogen Antibodies
- Product name
- CD16 Monoclonal Antibody (eBioCB16 (CB16)), Functional Grade, eBioscience™
- Antibody type
- Monoclonal
- Antigen
- Other
- Description
- Description: The eBioCB16 monoclonal antibody recognizes CD16 (FcgammaRIII), the low-affinity receptor for IgG with an apparent molecular weight of 50-80 kDa. CD16 is represented by two similar genes, CD16A (FcgammaRIIIA), which exists as a hetero-oligomeric polypeptide-anchored form in macrophages and NK cells and CD16B (FcgammaRIIIB), which exist as a monomeric GPI-anchored form in neutrophils. Furthermore, there are two known polymorphisms of CD16B, NA-1 and NA-2. Individuals homozygous for NA-2 show a lower phagocytic capacity compared with NA-1. CD16 binds IgG in the form of immune complexes and shows preferential binding of IgG1 and IgG3 isotypes and minimal binding of IgG2 and IgG4. Upon IgG binding, both CD16 isoforms initiate signal transduction cascades that lead to a variety of responses including antibody-dependent cell-mediated cytotoxicity (ADCC), phagocytosis, degranulation and proliferation.
- Antibody clone number
- eBioCB16 (CB16)
- Concentration
- 1 mg/mL
Submitted references Prognostic Lnc-S100B-2 Affects Cell Apoptosis and Microenvironment of Colorectal Cancer through MLLT10 Signaling.
-------A type I IFN, prothrombotic hyperinflammatory neutrophil signature is distinct for COVID-19 ARDS--.
Broad and potent neutralizing human antibodies to tick-borne flaviviruses protect mice from disease.
Isolation of polymorphonuclear neutrophils and monocytes from a single sample of human peripheral blood.
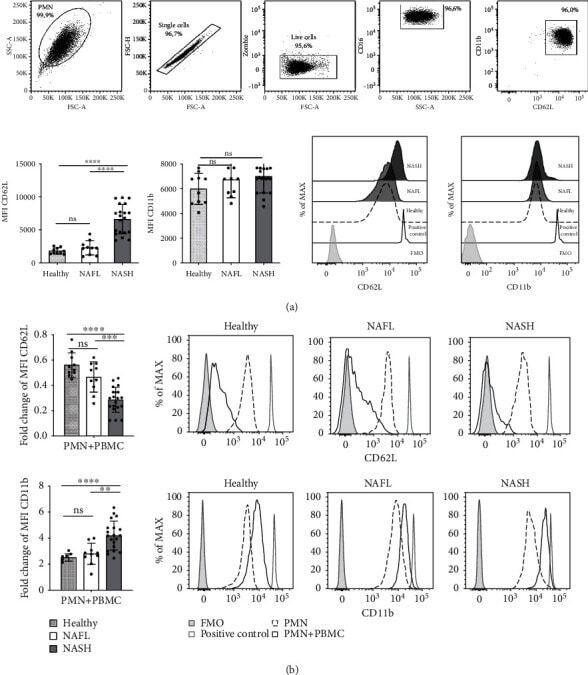
Circulating Neutrophils of Nonalcoholic Steatohepatitis Patients Show an Activated Phenotype and Suppress T Lymphocytes Activity.
CD14(+)CD16(-) monocytes are the main precursors of osteoclasts in rheumatoid arthritis via expressing Tyro3TK.
Loss of testosterone impairs anti-tumor neutrophil function.
SARS-CoV-2-triggered neutrophil extracellular traps mediate COVID-19 pathology.
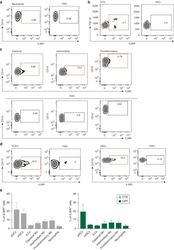
IL-36 Promotes Systemic IFN-I Responses in Severe Forms of Psoriasis.
Altered PGE2-EP2 is associated with an excessive immune response in HBV-related acute-on-chronic liver failure.
A child with perinatal HIV infection and long-term sustained virological control following antiretroviral treatment cessation.
Metformin-treated cancer cells modulate macrophage polarization through AMPK-NF-κB signaling.
Ex vivo culture of human atherosclerotic plaques: A model to study immune cells in atherogenesis.
Functional dichotomy of Vδ2 γδ T cells in chronic hepatitis C virus infections: role in cytotoxicity but not for IFN-γ production.
Pulmonary sarcoidosis is associated with high-level inducible co-stimulator (ICOS) expression on lung regulatory T cells--possible implications for the ICOS/ICOS-ligand axis in disease course and resolution.
The prognostic effects of tumor infiltrating regulatory T cells and myeloid derived suppressor cells assessed by multicolor flow cytometry in gastric cancer patients.
A DNA vaccine encoding mutated HPV58 mE6E7-Fc-GPI fusion antigen and GM-CSF and B7.1.
Thymic HIV-2 infection uncovers posttranscriptional control of viral replication in human thymocytes.
Retinoic acid regulates hematopoietic development from human pluripotent stem cells.
Aptamer-targeted antigen delivery.
Decreased plasma levels of soluble CD18 link leukocyte infiltration with disease activity in spondyloarthritis.
Chronic lymphocytic leukemia cells are activated and proliferate in response to specific T helper cells.
Changes in natural killer cell subsets in pediatric liver transplant recipients.
Natural killer cells from children with type 1 diabetes have defects in NKG2D-dependent function and signaling.
Comparison of gene expression profiles between human and mouse monocyte subsets.
TGF-β affects development and differentiation of human natural killer cell subsets.
Cytokine induced expression of programmed death ligands in human neutrophils.
Yi J, Peng F, Zhao J, Gong X
Journal of oncology 2022;2022:3565118
Journal of oncology 2022;2022:3565118
-------A type I IFN, prothrombotic hyperinflammatory neutrophil signature is distinct for COVID-19 ARDS--.
Reyes L, A Sanchez-Garcia M, Morrison T, Howden AJM, Watts ER, Arienti S, Sadiku P, Coelho P, Mirchandani AS, Zhang A, Hope D, Clark SK, Singleton J, Johnston S, Grecian R, Poon A, McNamara S, Harper I, Fourman MH, Brenes AJ, Pathak S, Lloyd A, Blanco GR, von Kriegsheim A, Ghesquiere B, Vermaelen W, Cologna CT, Dhaliwal K, Hirani N, Dockrell DH, Whyte MKB, Griffith D, Cantrell DA, Walmsley SR
Wellcome open research 2021;6:38
Wellcome open research 2021;6:38
Broad and potent neutralizing human antibodies to tick-borne flaviviruses protect mice from disease.
Agudelo M, Palus M, Keeffe JR, Bianchini F, Svoboda P, Salát J, Peace A, Gazumyan A, Cipolla M, Kapoor T, Guidetti F, Yao KH, Elsterová J, Teislerová D, Chrdle A, Hönig V, Oliveira T, West AP, Lee YE, Rice CM, MacDonald MR, Bjorkman PJ, Růžek D, Robbiani DF, Nussenzweig MC
The Journal of experimental medicine 2021 May 3;218(5)
The Journal of experimental medicine 2021 May 3;218(5)
Isolation of polymorphonuclear neutrophils and monocytes from a single sample of human peripheral blood.
Cui C, Schoenfelt KQ, Becker KM, Becker L
STAR protocols 2021 Dec 17;2(4):100845
STAR protocols 2021 Dec 17;2(4):100845
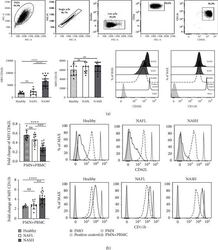
Circulating Neutrophils of Nonalcoholic Steatohepatitis Patients Show an Activated Phenotype and Suppress T Lymphocytes Activity.
Antonucci L, Porcu C, Timperi E, Santini SJ, Iannucci G, Balsano C
Journal of immunology research 2020;2020:4570219
Journal of immunology research 2020;2020:4570219
CD14(+)CD16(-) monocytes are the main precursors of osteoclasts in rheumatoid arthritis via expressing Tyro3TK.
Xue J, Xu L, Zhu H, Bai M, Li X, Zhao Z, Zhong H, Cheng G, Li X, Hu F, Su Y
Arthritis research & therapy 2020 Sep 21;22(1):221
Arthritis research & therapy 2020 Sep 21;22(1):221
Loss of testosterone impairs anti-tumor neutrophil function.
Markman JL, Porritt RA, Wakita D, Lane ME, Martinon D, Noval Rivas M, Luu M, Posadas EM, Crother TR, Arditi M
Nature communications 2020 Mar 31;11(1):1613
Nature communications 2020 Mar 31;11(1):1613
SARS-CoV-2-triggered neutrophil extracellular traps mediate COVID-19 pathology.
Veras FP, Pontelli MC, Silva CM, Toller-Kawahisa JE, de Lima M, Nascimento DC, Schneider AH, Caetité D, Tavares LA, Paiva IM, Rosales R, Colón D, Martins R, Castro IA, Almeida GM, Lopes MIF, Benatti MN, Bonjorno LP, Giannini MC, Luppino-Assad R, Almeida SL, Vilar F, Santana R, Bollela VR, Auxiliadora-Martins M, Borges M, Miranda CH, Pazin-Filho A, da Silva LLP, Cunha LD, Zamboni DS, Dal-Pizzol F, Leiria LO, Siyuan L, Batah S, Fabro A, Mauad T, Dolhnikoff M, Duarte-Neto A, Saldiva P, Cunha TM, Alves-Filho JC, Arruda E, Louzada-Junior P, Oliveira RD, Cunha FQ
The Journal of experimental medicine 2020 Dec 7;217(12)
The Journal of experimental medicine 2020 Dec 7;217(12)
IL-36 Promotes Systemic IFN-I Responses in Severe Forms of Psoriasis.
Catapano M, Vergnano M, Romano M, Mahil SK, Choon SE, Burden AD, Young HS, Carr IM, Lachmann HJ, Lombardi G, Smith CH, Ciccarelli FD, Barker JN, Capon F
The Journal of investigative dermatology 2020 Apr;140(4):816-826.e3
The Journal of investigative dermatology 2020 Apr;140(4):816-826.e3
Altered PGE2-EP2 is associated with an excessive immune response in HBV-related acute-on-chronic liver failure.
Wang Y, Chen C, Qi J, Wu F, Guan J, Chen Z, Zhu H
Journal of translational medicine 2019 Mar 19;17(1):93
Journal of translational medicine 2019 Mar 19;17(1):93
A child with perinatal HIV infection and long-term sustained virological control following antiretroviral treatment cessation.
Violari A, Cotton MF, Kuhn L, Schramm DB, Paximadis M, Loubser S, Shalekoff S, Da Costa Dias B, Otwombe K, Liberty A, McIntyre J, Babiker A, Gibb D, Tiemessen CT
Nature communications 2019 Jan 24;10(1):412
Nature communications 2019 Jan 24;10(1):412
Metformin-treated cancer cells modulate macrophage polarization through AMPK-NF-κB signaling.
Chiang CF, Chao TT, Su YF, Hsu CC, Chien CY, Chiu KC, Shiah SG, Lee CH, Liu SY, Shieh YS
Oncotarget 2017 Mar 28;8(13):20706-20718
Oncotarget 2017 Mar 28;8(13):20706-20718
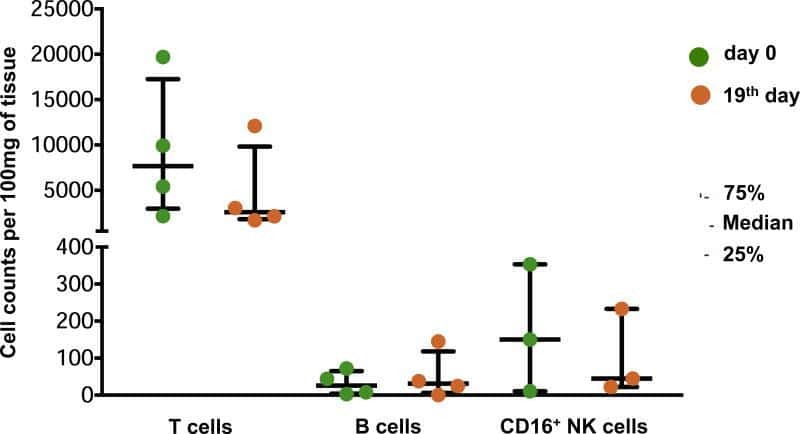
Ex vivo culture of human atherosclerotic plaques: A model to study immune cells in atherogenesis.
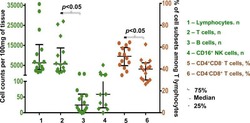
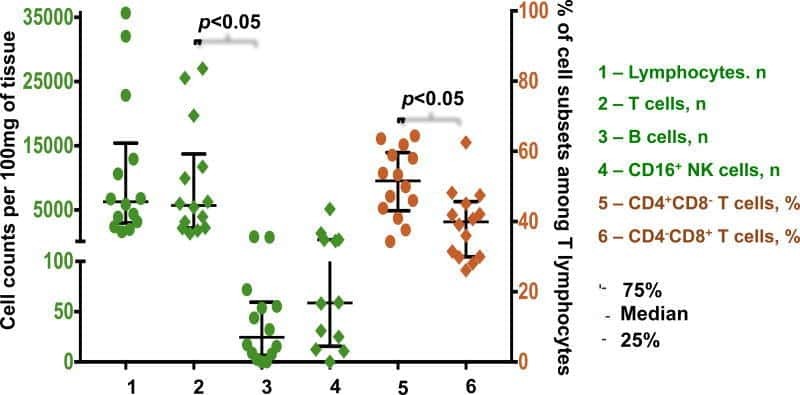
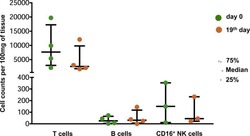
Lebedeva A, Vorobyeva D, Vagida M, Ivanova O, Felker E, Fitzgerald W, Danilova N, Gontarenko V, Shpektor A, Vasilieva E, Margolis L
Atherosclerosis 2017 Dec;267:90-98
Atherosclerosis 2017 Dec;267:90-98
Functional dichotomy of Vδ2 γδ T cells in chronic hepatitis C virus infections: role in cytotoxicity but not for IFN-γ production.
Yin W, Tong S, Zhang Q, Shao J, Liu Q, Peng H, Hu H, Peng M, Hu P, Ren H, Tian Z, Zhang D
Scientific reports 2016 May 19;6:26296
Scientific reports 2016 May 19;6:26296
Pulmonary sarcoidosis is associated with high-level inducible co-stimulator (ICOS) expression on lung regulatory T cells--possible implications for the ICOS/ICOS-ligand axis in disease course and resolution.
Sakthivel P, Grunewald J, Eklund A, Bruder D, Wahlström J
Clinical and experimental immunology 2016 Feb;183(2):294-306
Clinical and experimental immunology 2016 Feb;183(2):294-306
The prognostic effects of tumor infiltrating regulatory T cells and myeloid derived suppressor cells assessed by multicolor flow cytometry in gastric cancer patients.
Choi HS, Ha SY, Kim HM, Ahn SM, Kang MS, Kim KM, Choi MG, Lee JH, Sohn TS, Bae JM, Kim S, Kang ES
Oncotarget 2016 Feb 16;7(7):7940-51
Oncotarget 2016 Feb 16;7(7):7940-51
A DNA vaccine encoding mutated HPV58 mE6E7-Fc-GPI fusion antigen and GM-CSF and B7.1.
Wang H, Yu J, Li L
OncoTargets and therapy 2015;8:3067-77
OncoTargets and therapy 2015;8:3067-77
Thymic HIV-2 infection uncovers posttranscriptional control of viral replication in human thymocytes.
Nunes-Cabaço H, Matoso P, Foxall RB, Tendeiro R, Pires AR, Carvalho T, Pinheiro AI, Soares RS, Sousa AE
Journal of virology 2015 Feb;89(4):2201-8
Journal of virology 2015 Feb;89(4):2201-8
Retinoic acid regulates hematopoietic development from human pluripotent stem cells.
Rönn RE, Guibentif C, Moraghebi R, Chaves P, Saxena S, Garcia B, Woods NB
Stem cell reports 2015 Feb 10;4(2):269-81
Stem cell reports 2015 Feb 10;4(2):269-81
Aptamer-targeted antigen delivery.
Wengerter BC, Katakowski JA, Rosenberg JM, Park CG, Almo SC, Palliser D, Levy M
Molecular therapy : the journal of the American Society of Gene Therapy 2014 Jul;22(7):1375-1387
Molecular therapy : the journal of the American Society of Gene Therapy 2014 Jul;22(7):1375-1387
Decreased plasma levels of soluble CD18 link leukocyte infiltration with disease activity in spondyloarthritis.
Kragstrup TW, Jalilian B, Hvid M, Kjærgaard A, Østgård R, Schiøttz-Christensen B, Jurik AG, Robinson WH, Vorup-Jensen T, Deleuran B
Arthritis research & therapy 2014 Feb 4;16(1):R42
Arthritis research & therapy 2014 Feb 4;16(1):R42
Chronic lymphocytic leukemia cells are activated and proliferate in response to specific T helper cells.
Os A, Bürgler S, Ribes AP, Funderud A, Wang D, Thompson KM, Tjønnfjord GE, Bogen B, Munthe LA
Cell reports 2013 Aug 15;4(3):566-77
Cell reports 2013 Aug 15;4(3):566-77
Changes in natural killer cell subsets in pediatric liver transplant recipients.
Pham B, Piard-Ruster K, Silva R, Gallo A, Esquivel CO, Martinez OM, Krams SM
Pediatric transplantation 2012 Mar;16(2):176-82
Pediatric transplantation 2012 Mar;16(2):176-82
Natural killer cells from children with type 1 diabetes have defects in NKG2D-dependent function and signaling.
Qin H, Lee IF, Panagiotopoulos C, Wang X, Chu AD, Utz PJ, Priatel JJ, Tan R
Diabetes 2011 Mar;60(3):857-66
Diabetes 2011 Mar;60(3):857-66
Comparison of gene expression profiles between human and mouse monocyte subsets.
Ingersoll MA, Spanbroek R, Lottaz C, Gautier EL, Frankenberger M, Hoffmann R, Lang R, Haniffa M, Collin M, Tacke F, Habenicht AJ, Ziegler-Heitbrock L, Randolph GJ
Blood 2010 Jan 21;115(3):e10-9
Blood 2010 Jan 21;115(3):e10-9
TGF-β affects development and differentiation of human natural killer cell subsets.
Allan DS, Rybalov B, Awong G, Zúñiga-Pflücker JC, Kopcow HD, Carlyle JR, Strominger JL
European journal of immunology 2010 Aug;40(8):2289-95
European journal of immunology 2010 Aug;40(8):2289-95
Cytokine induced expression of programmed death ligands in human neutrophils.
Bankey PE, Banerjee S, Zucchiatti A, De M, Sleem RW, Lin CF, Miller-Graziano CL, De AK
Immunology letters 2010 Apr 8;129(2):100-7
Immunology letters 2010 Apr 8;129(2):100-7
No comments: Submit comment
Supportive validation
- Submitted by
- Invitrogen Antibodies (provider)
- Main image

- Experimental details
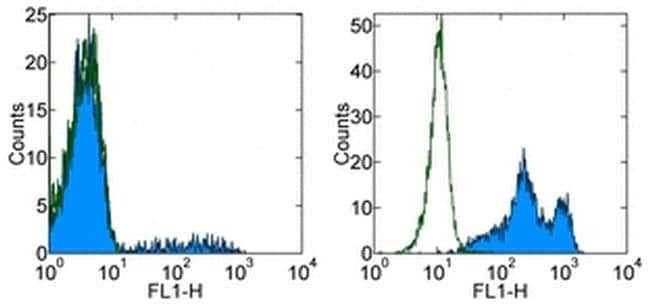
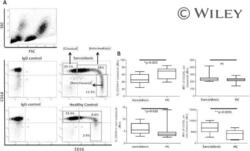
- Staining of normal human peripheral blood cells with 0.25 µg of Mouse IgG1 kappa Isotype Control Purified (Product # 14-4714-82) (open histogram) or 0.25 µg of Anti-Human CD16 Purified (filled histogram) followed by Anti-Mouse IgG FITC (Product # 11-4011-85).Cells in the lymphocyte (left) and granulocyte (right) gates were used for analysis.
Supportive validation
- Submitted by
- Invitrogen Antibodies (provider)
- Main image
- Experimental details
- NULL
- Submitted by
- Invitrogen Antibodies (provider)
- Main image
- Experimental details
- NULL

- Submitted by
- Invitrogen Antibodies (provider)
- Main image
- Experimental details
- NULL
- Submitted by
- Invitrogen Antibodies (provider)
- Main image
- Experimental details
- NULL
- Submitted by
- Invitrogen Antibodies (provider)
- Main image
- Experimental details
- Figure 3 PMNs activated phenotype of NASH patients. (a) Top panels, representative flow cytometry gating strategy (NASH patients) for identification ex vivo PMNs. FACS plots displaying, SSC-A versus FSC-A, singlet cells (FSC-H versus FSC-A), live cells (Zombie versus FSC-A), CD16 versus SSC-A, CD11b versus CD62L in ex vivo PMNs analysis. Bottom-left: histogram of mean fluorescence intensity (MFI) of CD62L and CD11b of ex vivo PMNs flow cytometric analysis obtained from healthy donors ( n = 10), NAFL ( n = 10), and NASH patients ( n = 20). Bottom-right: representative histogram of flow cytometry analysis with an overlay showing CD62L and CD11b MFI in gated CD16 High CD62L High CD11b High of healthy donors (dashed line), NAFL (light gray), and NASH patients (dark gray). FMO control was represented by a gray histogram. Flow cytometry compensation beads positive control was represented by gray line. (b) PMNs obtained from healthy donors, NAFL, and NASH patients after 24 h of coculture with (PMNs+PBMCs) or without PBMCs (PMNs). Left panels: fold changes of CD62L (top) and CD11b (bottom) of MFI gated in CD16 High CD62L Dim CD11b High in healthy donors ( n = 10), NAFL ( n = 10), and NASH patients ( n = 20). Fold change was calculated comparing PMNs with PBMCs respect to PMNs without PBMCs. Right panels: representative histogram with an overlay showing CD62L (top) and CD11b (bottom) MFI in gated CD16 High CD62L High CD11b High after 24 h of coculture with PBMC in healthy donors, NAFL
- Submitted by
- Invitrogen Antibodies (provider)
- Main image
- Experimental details
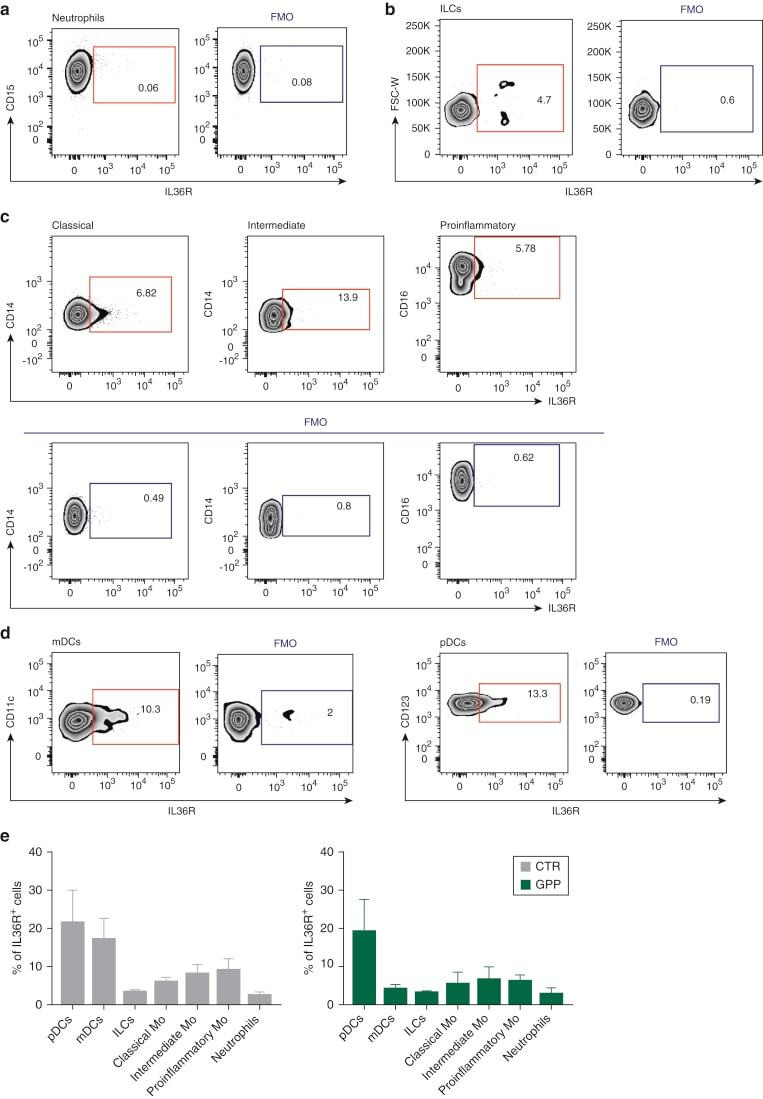
- Figure 4 The IL-36 receptor is preferentially expressed by plasmacytoid dendritic cell s. ( a-e ) Representative flow cytometry plots showing IL36R surface expression compared with fluorescence minus one control. ( a ) neutrophils (gated as CD14 + , CD15 + , CD16 + cells); ( b ) innate lymphoid cells (lineage - [CD3 - , CD4 - , CD19 - , CD20 - , CD56 - ], CD127 + ); ( c ) monocytes (CD3 - , CD20 - , CD19 - , CD56 - ) separated into classical (CD16 - , CD14 high ), intermediate (CD16 + , CD14 + ), and pro-inflammatory (CD16 high , CD14 - ) populations; ( d ) pDCs (lineage - , HLA-DR + , CD123 + , CD11c - ) and mDCs (lineage - , HLA-DR + , CD123 - , CD11c + ). ( e ) Histogram showing the percentage IL36R + cells in each leukocyte population. Data were obtained in at least three GPP cases and three sex-matched controls. Results are presented as mean +- SEM. No significant differences were observed between GPP cases and healthy donors. FMO, fluorescence minus 1; IL36R, IL-36 receptor; GPP, generalized pustular psoriasis; mDC, myeloid dendritic cell; Mo, monocytes; pDC, plasmacytoid dendritic cell; SEM, standard error of the mean.
- Submitted by
- Invitrogen Antibodies (provider)
- Main image
- Experimental details
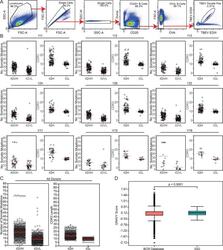
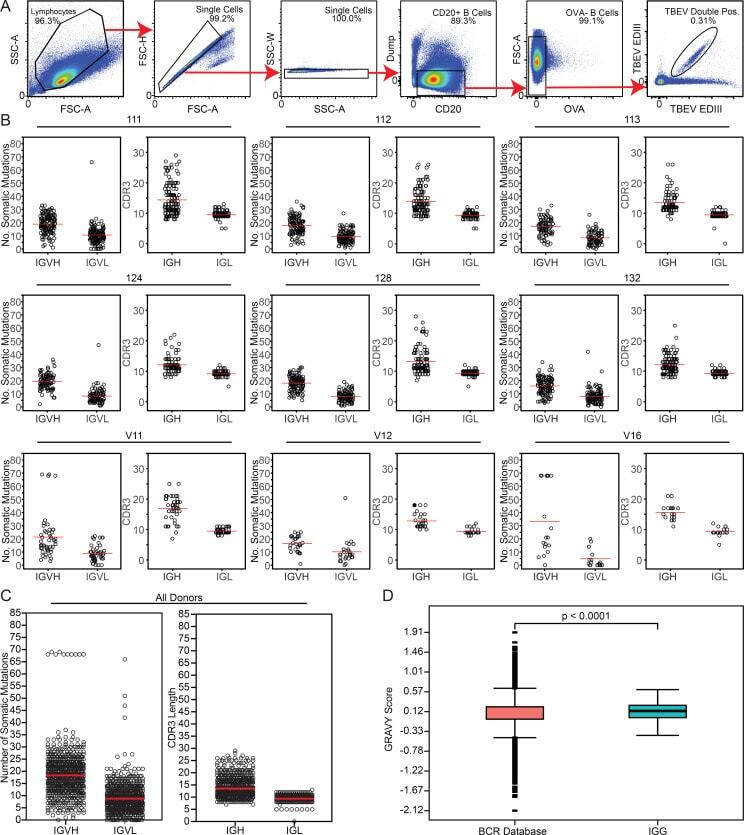
- Figure S2. Sorting strategy and antibody sequence analysis. (A) Sorting strategy. Forward and side scatter (FSC and SSC, respectively) were used to gate on single lymphocytes. Dump channel included CD3, CD8, CD14, CD16, and a viability dye. CD20 + B cells that failed to bind OVA (OVA - ) but did bind to the TBEV EDIII bait coupled with both PE and AF647 fluorophores were purified. (B) For each donor, the number of V gene somatic nucleotide mutations is shown on the left and the amino acid length of the CDR3 is shown on the right. (C) As in B, but for all donors combined. For B and C, horizontal red lines indicate the mean. (D) Distribution of hydrophobicity GRAVY scores at the IGH CDR3 of antibodies from all donors combined and compared with human repertoire (). P < 0.0001 was determined using the Wilcoxon nonparametric test. Related to Fig. 2 , Table S2 , and Table S3 .
- Submitted by
- Invitrogen Antibodies (provider)
- Main image
- Experimental details
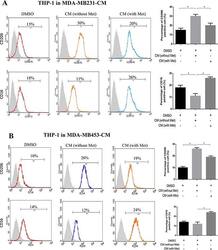
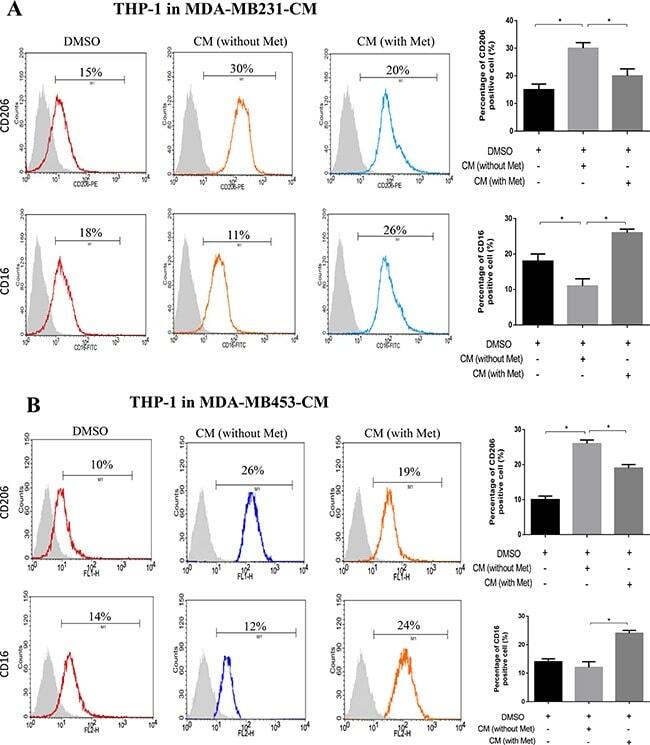
- Figure 1 Metformin treated cancer cells polarized macrophage toward M1 phenotype THP-1 cells were stimulated with PMA (200 nM) for 24 h, then incubated with breast cancer (MDA-MB231/MDA-MB453) conditioned medium (CM) with or without metformin (60 muM) for 6 h, followed by flow cytometry analysis to quantify the amount of CD206, an M2 macrophage marker, and CD16, an M1 marker ( A, B ). Data are expressed as mean +- SD, * p < 0.05. DMSO: control; Met: metformin. Representative flow data shown are from experiments independently performed at least three times.
- Submitted by
- Invitrogen Antibodies (provider)
- Main image
- Experimental details
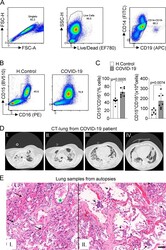
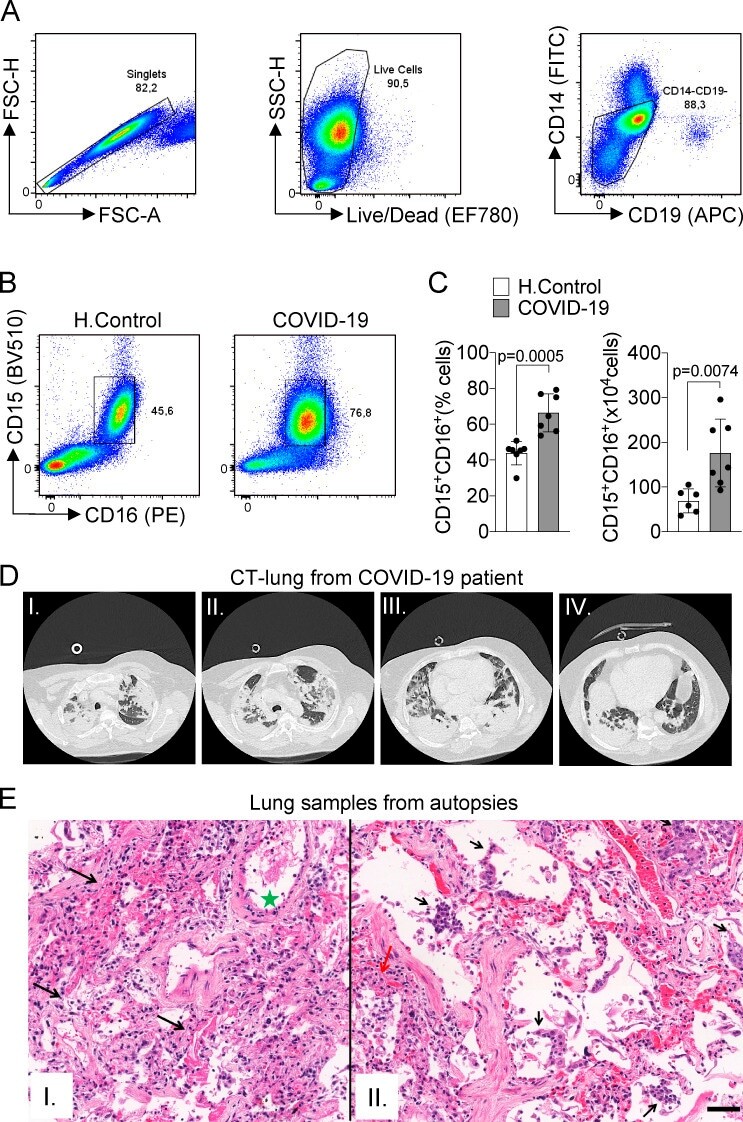
- Figure S1. Immunopathological characteristics of COVID-19 patients. (A) Doublet cells were excluded by forward scatter height (FSC-H) and forward scatter area (FSC-A) gating for all flow cytometry analysis. Viable cells were identified using fixable viability stain and side scatter area (SSC-A) gating. Neutrophils were identified as cells stained for CD15 + CD16 + among CD14 - CD19 - cells. (B) Flow cytometry analyses of living cells from the whole blood of healthy controls (H.Control) or COVID-19 patients. (C) Frequency and absolute numbers of CD15 + CD16 + neutrophils gated on CD14 - CD19 - live cells from whole blood from healthy controls ( n = 7) or COVID-19 patients ( n = 7). (D) CT of the chest of one patient who died from COVID-19. Images from apical to basal segments (I to IV) show multiple consolidations with air bronchograms in a peripheral and peribronchovascular distribution, more evident in the lower lobes, associated with ground-glass opacities. (E) Representative pulmonary histological findings in 10 cases, autopsied by ultrasound-guided, minimally invasive autopsy. I: The area with interstitial and alveolar neutrophilic pneumonia with diffuse alveolar damage and hyaline membranes in the alveolar space (black arrows). Septal vessel with margination of leukocytes and an intraluminal early fibrin thrombus (green star). II: Area with neutrophilic pneumonia (red arrow), septal thickening, epithelial desquamation, and squamous metaplasia (black arrows). I and II: H&
- Submitted by
- Invitrogen Antibodies (provider)
- Main image
- Experimental details
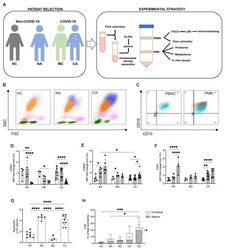
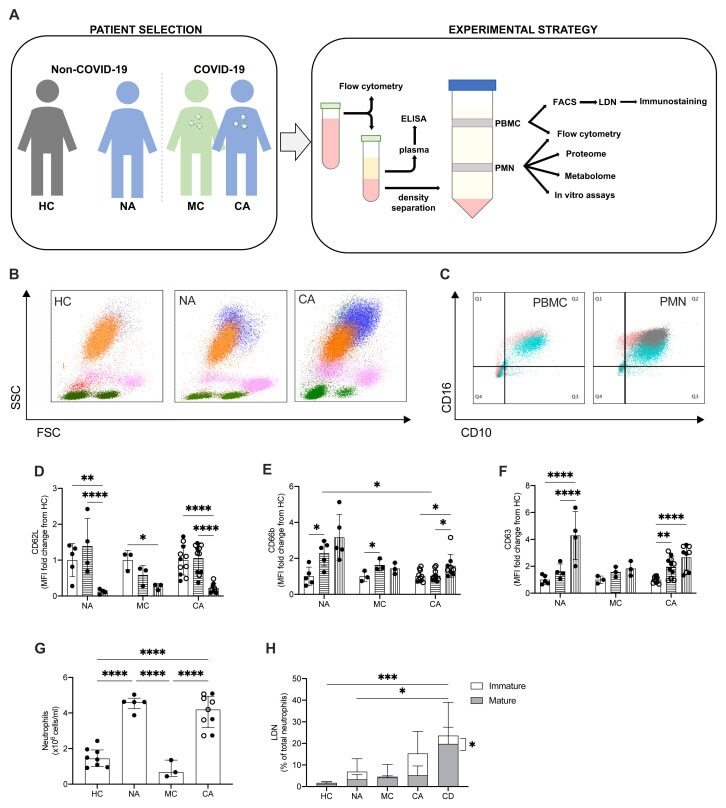
- Figure 2. Circulating neutrophil populations are expanded in COVID-19 and non-COVID-19 ARDS. ( A ) Patient classification (healthy control, HC, non-COVID-19 ARDS, NA, moderate COVID-19, MC, and COVID-19 ARDS, CA), neutrophil isolation, and workflow depicted. ( B ) Representative side scatter (SSC) vs. forward scatter (FSC) plots of stained whole blood from HC, NA and CA displaying lymphocyte (green), monocyte (pink), mature (CD16+, orange) and immature (CD16-, blue) neutrophil populations. ( C ) Representative CD16 vs. CD10 dot plots of stained polymorphonuclear (PMN) and peripheral blood mononuclear cell (PBMC) layers isolated by Percoll gradients from HC (grey), NA (blue) or CA (pink) patients, with quadrant2 (Q2) delimiting the CD16+CD10+ (mature neutrophils) area. ( D - F ) Surface expression of neutrophil activation markers expressed as a fold change of geometric mean fluorescence intensity (MFI) from normal density neutrophils (NDN) respective to the disease state as determined by flow cytometry analysis of mature NDN (CD66b+CD16+, open bars), mature low density neutrophils (LDN) (CD66b+CD16+, horizontal striped bars) and immature LDN (CD66b+CD16-, vertical striped bars) from NA (n = 5), MC (n = 3), or COVID-19 (n = 11; open circles, dexamethasone treated patients) patients. Data are mean +- SD. *p < 0.05, determined by repeated two-way ANOVA and Sidak's post hoc-testing. ( G ) Total neutrophil counts of HC (n = 8), NA (n = 5), MC (n=3) and CA (n = 11) performed by haem
- Submitted by
- Invitrogen Antibodies (provider)
- Main image
- Experimental details
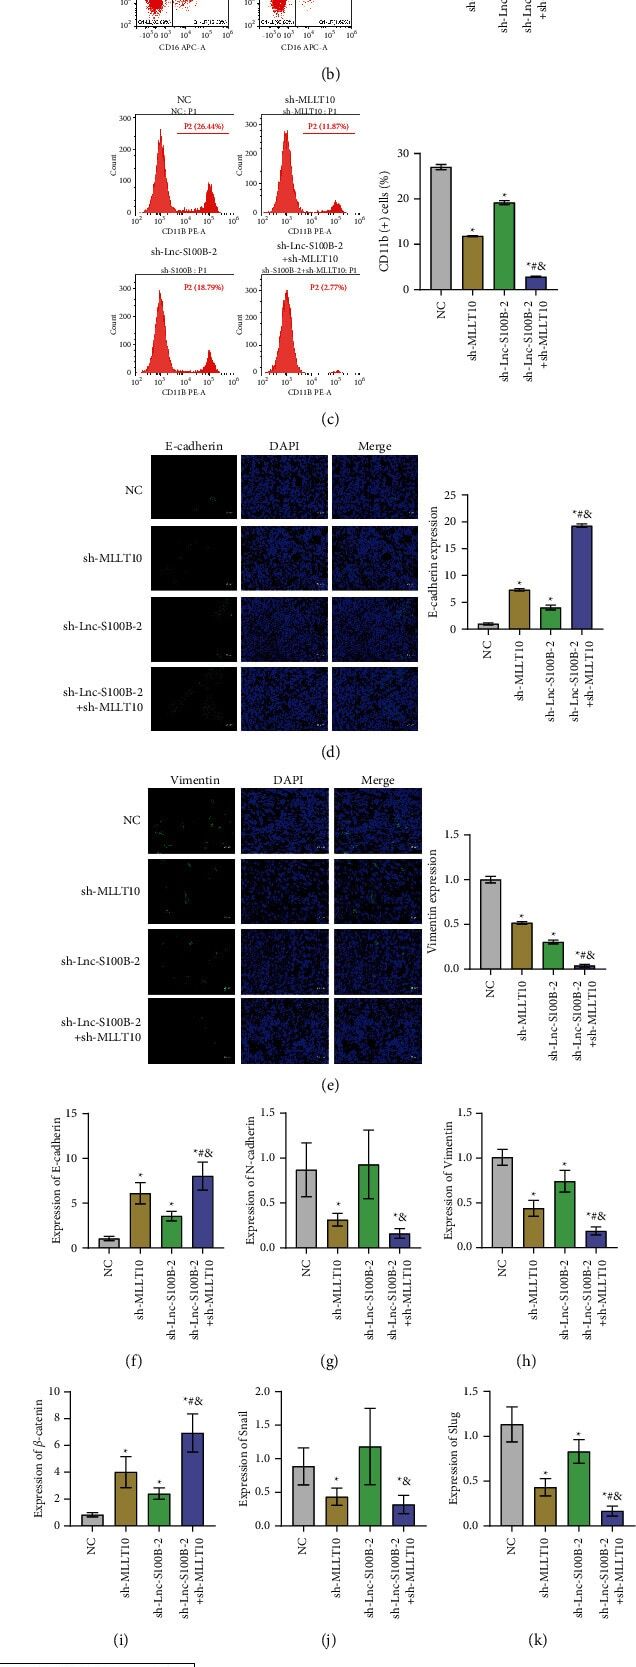
- Figure 6 Effects of Lnc-S100B-2 and MLLT10 on the tumor microenvironment. (a) The expressions of CD3 were detected by IF assay. (b) The percent of CD3 (-) CD16 (+) cells was detected by flow cytometry. (c) The percent of CD11b (+) cells was analyzed by flow cytometry. (d, e) The expression E-cadherin and vimentin was analyzed by IF assay. (f-l) The expressions of E-cadherin, N-cadherin, vimentin, beta -catenin, snail, and slug were detected by qRT-PCR and Western blot. * P < 0.05 versus NC group, # P < 0.05 versus sh-MLLT10 group, & P < 0.05 versus sh-Lnc-S100B-2 group, and one-way ANOVA.
- Submitted by
- Invitrogen Antibodies (provider)
- Main image
- Experimental details
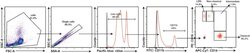
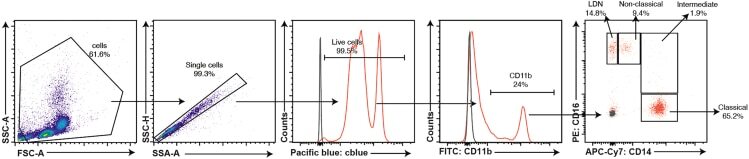
- Figure 4 Flow cytometry analysis of PBMCs Flow cytometry gating strategy to analyze PBMCs. CD14 and CD16 were used to distinguish low-density neutrophils (LDNs), non-classical monocytes, intermediate monocytes, and classical monocytes. Gray = negative control; Red = labeled sample.
- Submitted by
- Invitrogen Antibodies (provider)
- Main image
- Experimental details
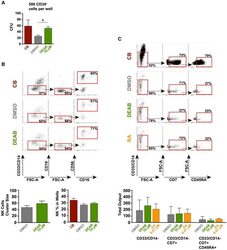
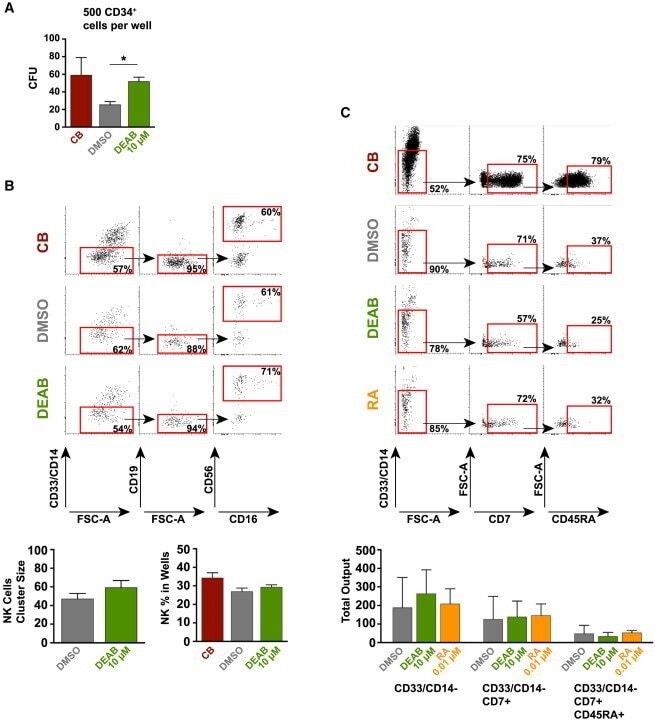
- Figure 3 Retinoic Acid Inhibition Increases the Differentiation Capacity of Hematopoietic Progenitors toward Myeloid and Lymphoid Lineage (A) CFU potential of 500 sorted progenitors (CD45/CD43 + CD34 + ) from DEAB-treated cultures (green) and DMSO control (gray) from four independent experiments (n = 4). CFU potential of progenitors similarly sorted from cord blood (CD45/CD43 + CD34 + ) is shown in red. (B) Lymphoid/myeloid differentiation assay performed on iPSC-derived hematopoietic cells. FACS plots and bar graphs showing non-myeloid (CD33/CD14 - ), CD19 - , CD56 + , and CD56 + CD16 + NK fraction from wells seeded with 50 HSC-like cells (CD45/43 + CD34 hi CD38 lo CD90 + CD45RA - ) (17 individual wells) cultured on OP9 stroma for 4 weeks. Left bar graph shows the cluster size of the NK fraction. Right bar graph shows the frequency of this population in the viable non-stroma fraction. See also Figure S2 . (C) FACS plots showing non-myeloid, CD7 + , CD45RA + multipotent early lymphoid progenitors from 3,500 sorted CD34 + cells cultured on OP9DL1 stroma for 3 weeks from one out of two independent experiments (n = 2). FACS plots are gated on the viable non-stroma fraction. Bar graph show the total output of differentiated cells from progenitors generated with DMSO, DEAB, or RA. FACS gates are based on FMO controls. Data represent mean +- SEM. Asterisks indicate significant differences ( * p < 0.05).
- Submitted by
- Invitrogen Antibodies (provider)
- Main image

- Experimental details
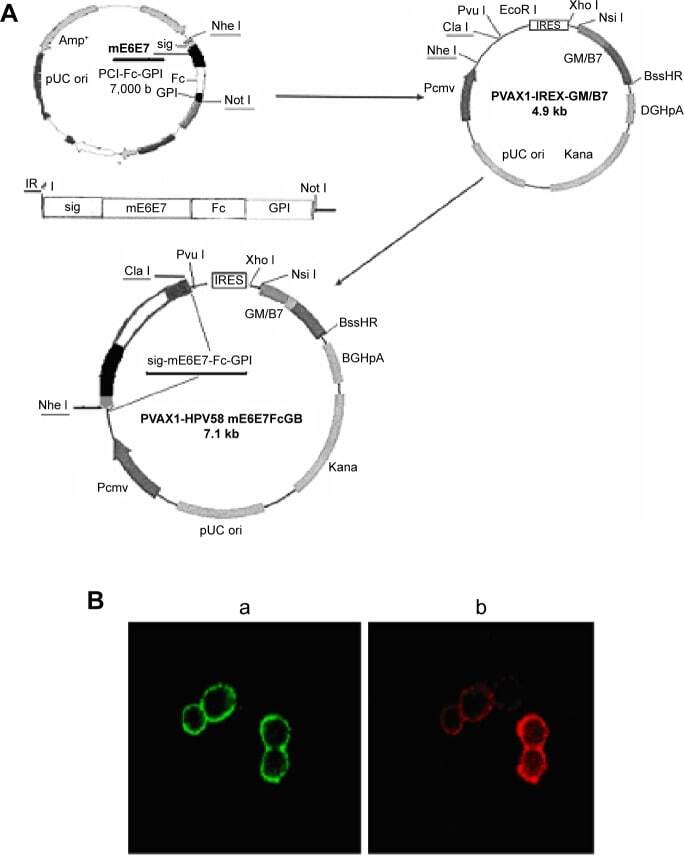
- Figure 3 Construction of the PVAX1-HPV58 mE6E7FcGB plasmid and expression of the target proteins assessed by immunofluorescence staining. Notes: ( A ) Diagram of the construction of the recombinant DNA vaccine PVAX1-HPV58 mE6E7FcGB. HPV58 mE6E7 was cloned into the plasmid PCI-sig-Fc-GPI, and the fused cassette sig-HPV58 mE6E7-Fc-GPI was subsequently excised from PCI-sig-HPV58 mE6E7-Fc-GPI plasmid and inserted into the upstream of IRES in PVAX1-IRES-GM/B7.1 vector to create PVAX1-HPV58 mE6E7FcGB. ( B ) The transfected 293T cells were concurrently incubated with a rabbit anti-human IgG-FITC antibody (green) and a mouse anti-human B7-1-PE antibody (red). Immunofluorescence revealed the expression of sig-HPV58 mE6E7-Fc-GPI (a, green, x50) and GM-CSF/B7.1 (b, red, x50) at the cells membrane. Abbreviations: IgG-FITC, immunoglobulin G-conjugated fluorescein isothiocyanate; IRES, internal ribosome entry site; HPV, human papillomavirus.
- Submitted by
- Invitrogen Antibodies (provider)
- Main image

- Experimental details
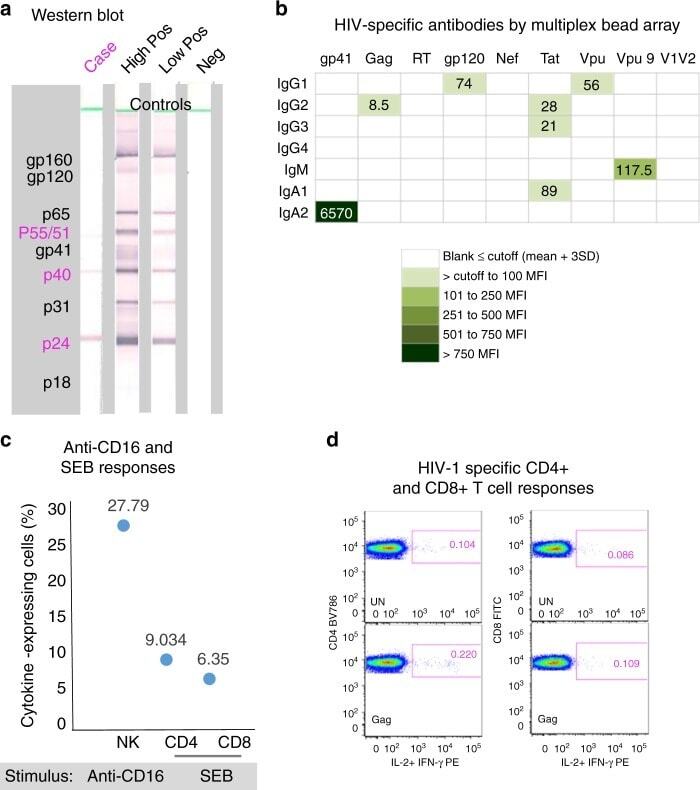
- Fig. 3 HIV-specific responses and immune response capability of the case at 9.5 years of age. a Detection of HIV-specific antibodies at 9.5 years of age by western blot. The case antibody profile is compared with controls that are a high positive, low positive and HIV-negative. HIV proteins corresponding to bands in the blots are shown in the left grey-shaded block; the case profile was positive for the core proteins indicated in pink. b Quantitation of HIV-specific antibodies by multiplex bead array for all isotypes and subclasses (indicated on the left side--IgG1, IgG2, IgG3, IgG4, IgM, IgA1, IgA2) against gp41, Gag, RT, gp120, Nef, Tat, Vpu, peptide Vpu9 and V1V2 scaffold antigens (indicated at the top). Results are expressed as mean fluorescence intensities (MFI)), the colour key shows ranges of MFI according to colour intensity (the darker the more HIV-specific antibody detected). A result is considered positive if above the cut-off (mean +- 3 SD) determined from eight adult uninfected controls. Vpu9 amino acid sequence: STMVDMGHLRLLDVNDL. c Proportions of natural killer (NK) cells that respond to anti-CD16 antibody, and CD4+ and CD8+ T cells that respond to staphylococcal enterotoxin B (SEB) in a whole blood intracellular cytokine (ICC) assay that measures induction of interferon-gamma (IFN-gamma) and interleukin-2 (IL-2). HIV-uninfected adult reference values for comparison ( n = 21; median % and range)--natural killer (NK) anti-CD16%: 37.92 (12-67.6), CD4 SEB%:
- Submitted by
- Invitrogen Antibodies (provider)
- Main image
- Experimental details
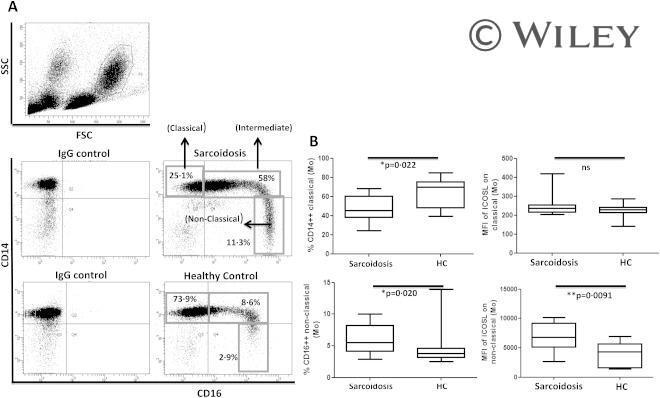
- Increased proportion of non-classical blood monocytes with higher inducible co-stimulator ligand (ICOS-L) expression in sarcoidosis patients. (a) Representative fluorescence activated cell sorter (FACS) dot-plot gated on blood monocyte populations in peripheral blood mononuclear cells (PBMCs) showing the frequencies of classical, intermediate and non-classical (proinflammatory) monocytes in sarcoidosis patients ( n = 11) and healthy controls ( n = 13). (b) Box-plots represent the % CD14 high CD16 low monocytes (classical) in sarcoidosis patients and healthy controls (upper left) and the intensities of ICOS-L [as mean fluorescence intensity (MFI)] on classical monocytes in patients and controls (upper right). Box-plots represent the % CD14 low CD16 high monocytes (non-classical) in sarcoidosis patients and healthy controls (lower left) and the intensities of ICOS-L (as MFI) on non-classical monocytes in patients and controls (lower right). P -values were calculated using the Mann-Whitney U -test.
- Submitted by
- Invitrogen Antibodies (provider)
- Main image
- Experimental details
- Fig. 5 Characterization of EP2-positive immune cells. a - d Peripheral whole blood (at least 5 subjects per group) was stained with anti-CD14, anti-CD16, anti-EP2, anti-TLR2, anti-HLA-DR, anti-CD11b or anti-TLR4. The percentages of different phenotypes of EP2 + or EP2 - monocytes and neutrophils were determined by flow cytometry. e PBMCs isolated from at least 3 subjects per group were stimulated with LPS (100 ng/ml) for 72 h. Cytokine production was measured by flow cytometry. f Peripheral whole blood from 7 subjects per group was incubated with E. coli for 30 min. ROS production in neutrophils and monocytes was assessed by flow cytometry. The data are expressed as the mean +- SEM of individual subjects or plots of individual data. The error bar represented SEM and the horizontal line represented the median. Statistical analyses were analyzed using the Wilcoxon signed-rank test. *p < 0.05, **p < 0.01, ***p < 0.001; ns, not statistically significant

- Submitted by
- Invitrogen Antibodies (provider)
- Main image
- Experimental details
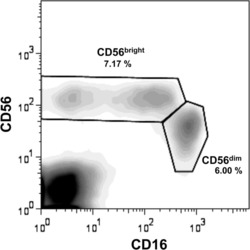
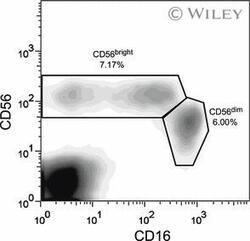
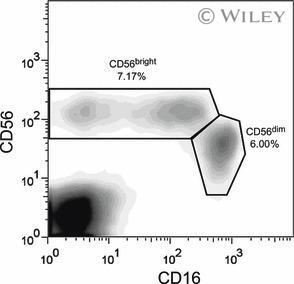
- 1 Two major NK cell subsets are detected in the peripheral blood. PBMCs were isolated from whole blood, stained with CD16-FITC and CD56-Cy5 antibodies, and analyzed by flow cytometry. Gates were set to include only live cells. A representative plot displaying the CD56 bright and CD56 dim populations of one patient pretransplant, is shown. The CD56 bright population includes NK cells that are either CD16 + or CD16 - , whereas all the cells in the CD56 dim population are CD16 + .
- Submitted by
- Invitrogen Antibodies (provider)
- Main image
- Experimental details
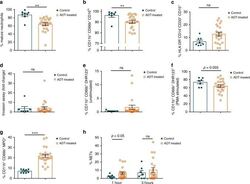
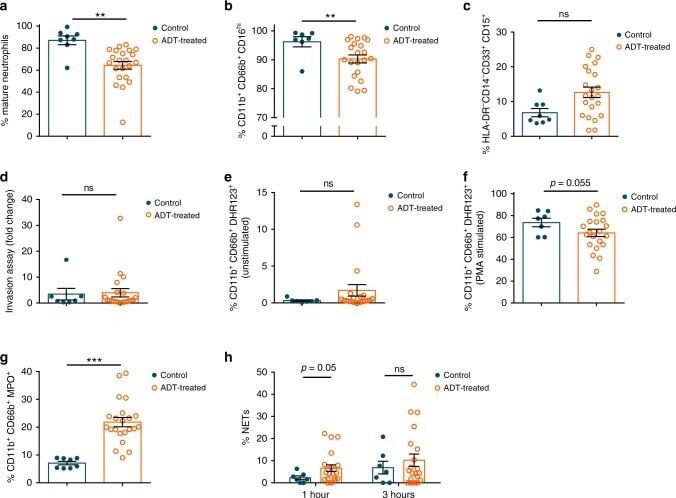
- Fig. 5 Analysis of neutrophils from control or androgen deprivation therapy (ADT) treated patients. a Percent of circulating neutrophils from control or ADT treated prostate cancer patients that have a mature, segmented appearance morphologically. b Percent Cd11b + CD66b + CD16 lo neutrophils. c Percent myeloid derived suppressor cell (MDSC)-like neutrophils defined as HLA-DR - CD14 - CD33 + CD15 + . d Percent fold change in migration (percent crystal violet positive area of transwell stimulated with a chemoattractant divided by percent area without chemoattractant). e Percent of unstimulated neutrophils producing DHR123. f Percent of neutrophils producing DHR123 following PMA stimulation. g Percent myeloperoxidase + (MPO + ) neutrophils. h Percent of plated netosising neutrophils at 1 and 3 h following purification. Data in a - h are mean +- s.e.m., * p < 0.05, ** p < 0.01, *** p < 0.001 by multivariable linear regression using ADT as its main predictor and adjusting for presence of prostatectomy, age, race, and current status; control prostate cancer patients ( n = 8 in a , c , g and n = 7 in b , d , e , f , h ) and prostate cancer pati e nts receiving ADT ( n = 22 in a , c , g and n = 21 in b , d , e , f , h ).
- Submitted by
- Invitrogen Antibodies (provider)
- Main image

- Experimental details
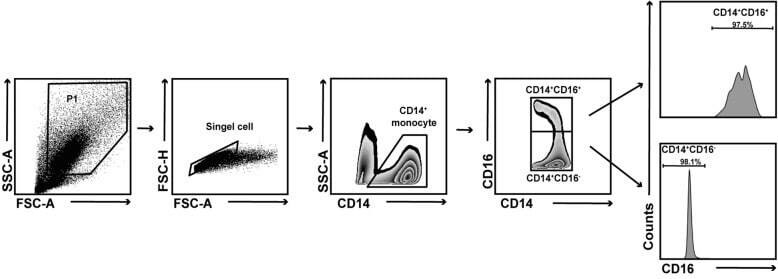
- Fig. 1 Gating strategy for flow cytometry sorting of human CD14 + CD16 + and CD14 + CD16 - monocytes. Peripheral blood mononuclear cells from RA and HC were stained with FITC-conjugated anti-CD14 antibody and APC-conjugated anti-CD16 antibody. CD14 + CD16 + and CD14 + CD16 - monocytes were analyzed and sorted by flow cytometric; the purity of sorted CD14 + CD16 + and CD14 + CD16 - monocytes used for experiments was ~ 90%
- Submitted by
- Invitrogen Antibodies (provider)
- Main image

- Experimental details
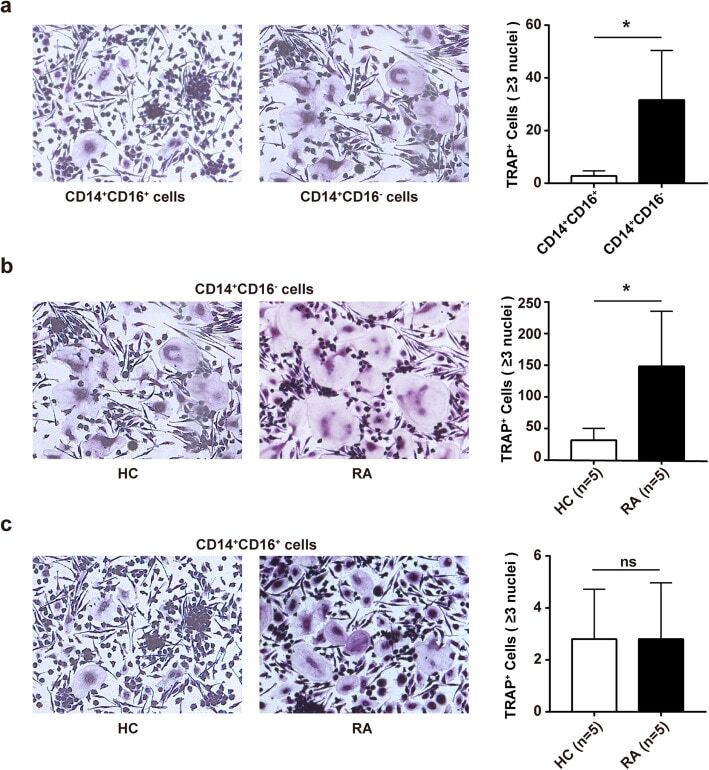
- Fig. 2 CD14 + CD16 - monocytes are the main osteoclast precursors in RA. Purified CD14 + CD16 + and CD14 + CD16 - monocytes from RA ( n = 5) and HC ( n = 5) were cultured with rhM-CSF (30 ng/ml) and rhRANKL (50 ng/ml) for osteoclast differentiation. The cells were detected for tartrate-resistant acid phosphatase (TRAP) staining on day 17, and the TRAP-positive multinuclear cells were osteoclasts. The representative charts and the statistical results were shown. a CD14 + CD16 + versus CD14 + CD16 - monocytes in HC (* P = 0.026). b RA versus HC for CD14 + CD16 - monocytes (* P = 0.019). c RA versus HC for CD14 + CD16 + monocytes. * P < 0.05; ns, not significant (Student''s t test, a - c )
- Submitted by
- Invitrogen Antibodies (provider)
- Main image
- Experimental details
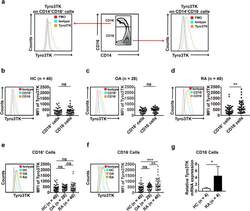
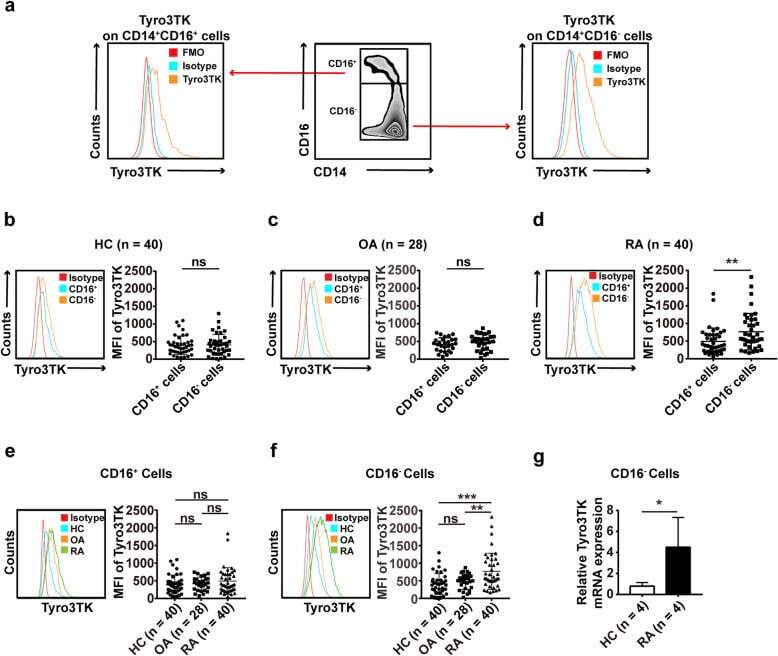
- Fig. 3 The expression of Tyro3TK on CD14 + CD16 - monocytes is increased in RA. a Gating strategy for identifying the expression of Tyro3TK on CD14 + CD16 + and CD14 + CD16 - monocytes. Accordingly, the expression of Tyro3TK on CD14 + CD16 + and CD14 + CD16 - monocytes in HC ( n = 40) ( b ), OA ( n = 28) ( c ), and RA patients ( n = 40, ** P = 0.008) ( d ) were analyzed and presented as the mean fluorescence intensity (MFI). e The expression of Tyro3TK on CD14 + CD16 + monocytes were compared between HC, OA, and RA patients. f The expression of Tyro3TK on CD14 + CD16 - monocytes were compared between HC, OA, and RA patients (** P = 0.004, *** P < 0.001). g Flow cytometry-sorted CD14 + CD16 - monocytes from RA ( n = 4) and HC ( n = 4) were set to detect the mRNA expression of Tyro3TK by qPCR (* P = 0.029). * P < 0.05, ** P < 0.01, *** P < 0.001; ns, not significant (Mann-Whitney U test, b , d , and g ; Student''s t test, c ; Kruskal-Wallis test followed by Dunn''s post-test for multiple comparisons, e - f )
- Submitted by
- Invitrogen Antibodies (provider)
- Main image

- Experimental details
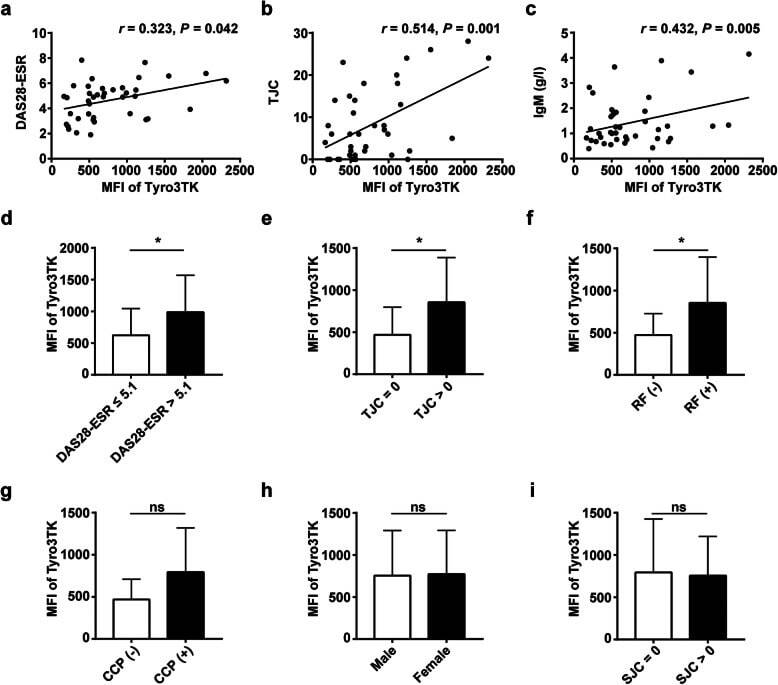
- Fig. 4 Correlation analysis of Tyro3TK on CD14 + CD16 - monocytes with RA patient clinical manifestations. The associations of Tyro3TK on CD14 + CD16 - monocytes with RA patient DAS28-ESR ( r = 0.323, * P = 0.042) ( a ), tender joint counts (TJC) ( r = 0.514, ** P = 0.001) ( b ), and IgM ( r = 0.432, ** P = 0.005) ( c ) were analyzed. The expression of Tyro3TK on CD14 + CD16 - monocytes were also compared between the different RA patient groups: d RA with high disease activity (DAS28-ESR > 5.1) and non-high disease activity (DAS28-ESR
- Submitted by
- Invitrogen Antibodies (provider)
- Main image

- Experimental details
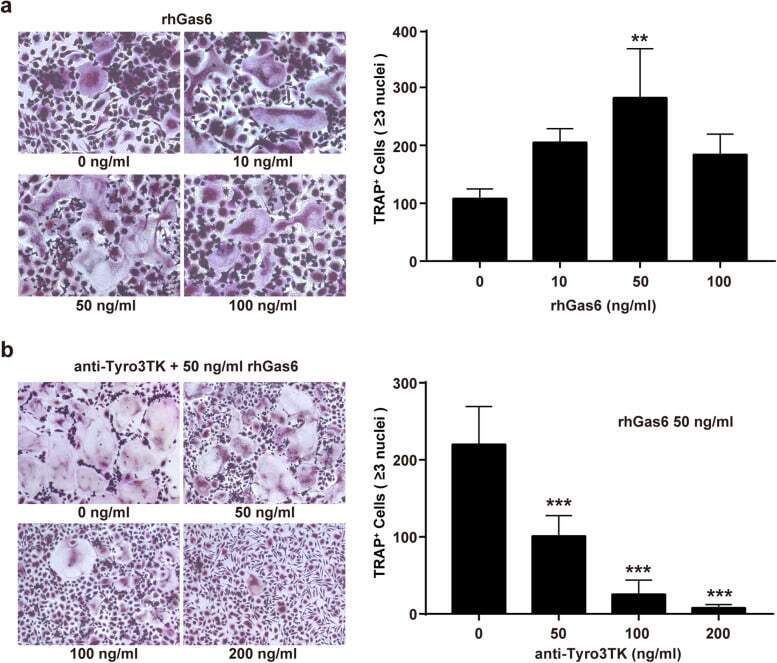
- Fig. 5 Tyro3TK promotes CD14 + CD16 - monocyte-mediated osteoclastogenesis in RA. Purified CD14 + CD16 - monocytes from RA patients ( n = 8) were cultured with rhM-CSF (30 ng/ml) and rhRANKL (50 ng/ml) under different conditions for osteoclast differentiation. Seventeen days later, the cells were harvested for TRAP staining. The representative charts and the statistical results were shown. a Different concentrations of rhGas6 (0 ng/ml, 10 ng/ml, 50 ng/ml, and 100 ng/ml) were supplemented for osteoclast differentiation ( n = 3 per group, ** P = 0.006). b Different concentrations of anti-Tyro3TK antibody (0 ng/ml, 50 ng/ml, 100 ng/ml, and 200 ng/ml), and 50 ng/ml rhGas6 was supplemented for osteoclast differentiation ( n = 5 per group, *** P < 0.001). ** P < 0.01, *** P < 0.001 (one-way ANOVA test followed by Dunn''s post-test for multiple comparisons, a , b )