Explore
 Validate
 Learn
LearnPA5-28647
antibody from Invitrogen Antibodies
Targeting: GPER1
CEPR, CMKRL2, DRY12, FEG-1, GPCR-Br, GPER, GPR30, LERGU, LERGU2, LyGPR
 Western blot
Antibody data
- Antibody Data
- Antigen structure
- References [4]
- Comments [0]
- Validations
- Western blot [3]
- Immunocytochemistry [2]
- Immunohistochemistry [2]
- Other assay [4]
Submit
Validation data
Reference
Comment
Report error
- Product number
- PA5-28647 - Provider product page

- Provider
- Invitrogen Antibodies
- Product name
- GPR30 Polyclonal Antibody
- Antibody type
- Polyclonal
- Antigen
- Synthetic peptide
- Description
- Recommended positive controls: unboiled GPER-transfected 293T. Store product as a concentrated solution. Centrifuge briefly prior to opening the vial.
- Reactivity
- Human, Mouse, Rat
- Host
- Rabbit
- Isotype
- IgG
- Vial size
- 100 μL
- Concentration
- 1.53 mg/mL
- Storage
- Store at 4°C short term. For long term storage, store at -20°C, avoiding freeze/thaw cycles.
Submitted references Magel2 knockdown in hypothalamic POMC neurons innervating the medial amygdala reduces susceptibility to diet-induced obesity.
Differential Effects of the G-Protein-Coupled Estrogen Receptor (GPER) on Rat Embryonic (E18) Hippocampal and Cortical Neurons.
Estradiol/GPER affects the integrity of mammary duct-like structures in vitro.
Low expression of G protein-coupled oestrogen receptor 1 (GPER) is associated with adverse survival of breast cancer patients.
Choi Y, Min HY, Hwang J, Jo YH
Life science alliance 2022 Nov;5(11)
Life science alliance 2022 Nov;5(11)
Differential Effects of the G-Protein-Coupled Estrogen Receptor (GPER) on Rat Embryonic (E18) Hippocampal and Cortical Neurons.
Pemberton K, Rosato M, Dedert C, DeLeon C, Arnatt C, Xu F
eNeuro 2022 Jul-Aug;9(4)
eNeuro 2022 Jul-Aug;9(4)
Estradiol/GPER affects the integrity of mammary duct-like structures in vitro.
Deng Y, Miki Y, Nakanishi A
Scientific reports 2020 Jan 28;10(1):1386
Scientific reports 2020 Jan 28;10(1):1386
Low expression of G protein-coupled oestrogen receptor 1 (GPER) is associated with adverse survival of breast cancer patients.
Martin SG, Lebot MN, Sukkarn B, Ball G, Green AR, Rakha EA, Ellis IO, Storr SJ
Oncotarget 2018 May 25;9(40):25946-25956
Oncotarget 2018 May 25;9(40):25946-25956
No comments: Submit comment
Supportive validation
- Submitted by
- Invitrogen Antibodies (provider)
- Main image
- Experimental details
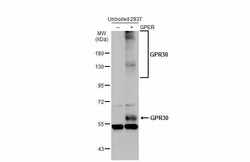
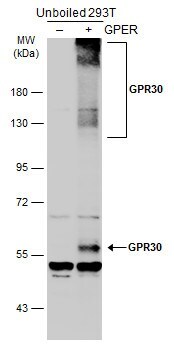
- Western Blot using GPR30 Polyclonal Antibody (Product # PA5-28647). Non-transfected (–) and transfected (+) unboiled 293T whole cell extracts (30 µg) were separated by 7.5% SDS-PAGE, and the membrane was blotted with GPR30 Polyclonal Antibody (Product # PA5-28647) diluted at 1:1,000. The HRP-conjugated anti-rabbit IgG antibody was used to detect the primary antibody.
- Submitted by
- Invitrogen Antibodies (provider)
- Main image
- Experimental details
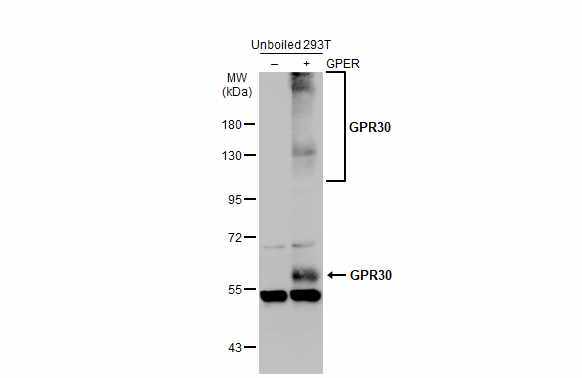
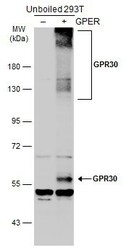
- Western Blot analysis of GPR30 was performed by separating 30 µg of non-transfected (–) and transfected (+) unboiled 293T whole cell extracts by 5% SDS-PAGE. Proteins were transferred to a membrane and probed with a GPR30 Polyclonal Antibody (Product # PA5-28647) at a dilution of 1:1000. The HRP-conjugated anti-rabbit IgG antibody was used to detect the primary antibody.
- Submitted by
- Invitrogen Antibodies (provider)
- Main image
- Experimental details
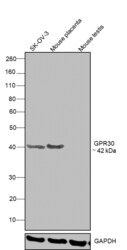
- Western blot was performed using GPR30 Polyclonal Antibody (Product # PA5-28647) and a 42 kDa band corresponding to GPR30 was observed across cell lines and tissues tested except in Mouse Testis. Whole cell extracts (30 µg lysate) of SK-OV-3 (Lane 1), Mouse placenta (Lane 2) and Mouse testis (Lane 3)were electrophoresed using NuPAGE® 4-12 % Bis-Tris gel (Product # NP0321BOX). Resolved proteins were then transferred onto a nitrocellulose membrane (Product # IB23001) by iBlot® 2 Dry Blotting System (Product # IB21001). The blot was probed with the primary antibody (1:1000 dilution) and detected by chemiluminescence with Goat anti-Rabbit IgG (Heavy Chain), Superclonal™ Recombinant Secondary Antibody, HRP (Product # A27036, 1:4000 dilution) using the iBright FL 1000 (Product # A32752). Chemiluminescent detection was performed using Novex® ECL Chemiluminescent Substrate Reagent Kit (Product # WP20005).

Supportive validation
- Submitted by
- Invitrogen Antibodies (provider)
- Main image

- Experimental details
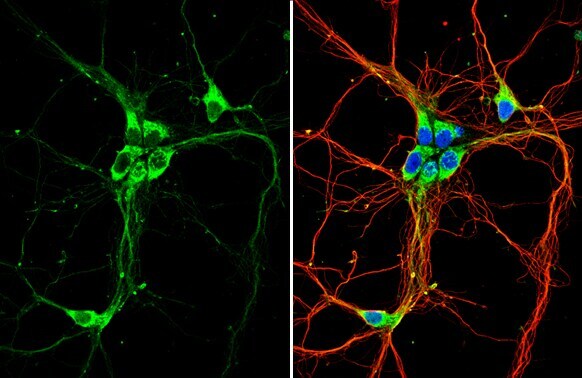
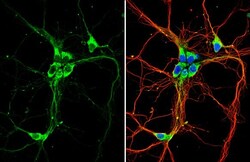
- Immunocytochemistry-Immunofluorescence analysis of GPR30 was performed in DIV9 rat E18 primary hippocampal neuron cells fixed in 4% paraformaldehyde at RT for 15 min. Green: GPR30 Polyclonal Antibody (Product # PA5-28647) diluted at 1:500. Red: beta Tubulin 3/ Tuj1, stained by beta Tubulin 3/ Tuj1 antibody. Blue: Fluoroshield with DAPI.
- Submitted by
- Invitrogen Antibodies (provider)
- Main image
- Experimental details
- Immunocytochemistry-Immunofluorescence analysis of GPR30 was performed in DIV9 rat E18 primary hippocampal neuron cells fixed in 4% paraformaldehyde at RT for 15 min. Green: GPR30 Polyclonal Antibody (Product # PA5-28647) diluted at 1:500. Red: beta Tubulin 3/ Tuj1, stained by beta Tubulin 3/ Tuj1 antibody. Blue: Fluoroshield with DAPI.

Supportive validation
- Submitted by
- Invitrogen Antibodies (provider)
- Main image
- Experimental details
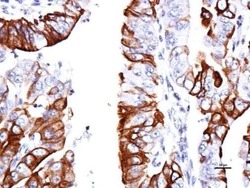
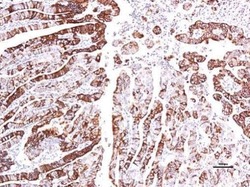
- Immunohistochemical analysis of paraffin-embedded human endometrial, using GPR30 (Product # PA5-28647) antibody at 1:150 dilution. Antigen Retrieval: EDTA based buffer, pH 8.0, 15 min.

- Submitted by
- Invitrogen Antibodies (provider)
- Main image
- Experimental details
- Immunohistochemical analysis of paraffin-embedded human endometrial, using GPR30 (Product # PA5-28647) antibody at 1:150 dilution. Antigen Retrieval: EDTA based buffer, pH 8.0, 15 min.

Supportive validation
- Submitted by
- Invitrogen Antibodies (provider)
- Main image
- Experimental details
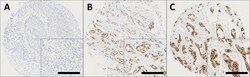
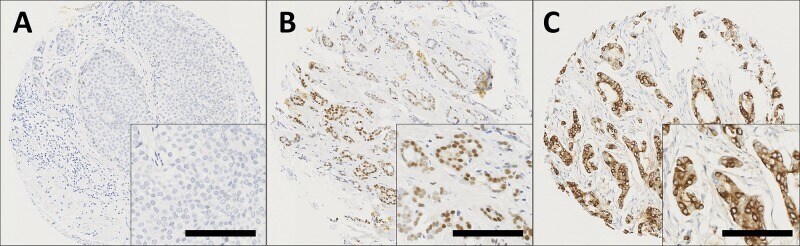
- Figure 1 Representative photomicrographs following immunohistochemical staining of (A) negative nuclear and cytoplasmic GPER staining; (B) positive nuclear staining; (C) positive cytoplasmic staining in breast cancer specimens. Photomicrographs are shown at 100x magnification with 200x magnification inset box where the scale bar represents 100mum.
- Submitted by
- Invitrogen Antibodies (provider)
- Main image
- Experimental details
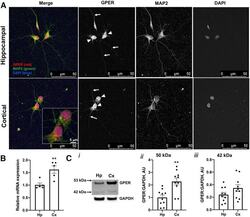
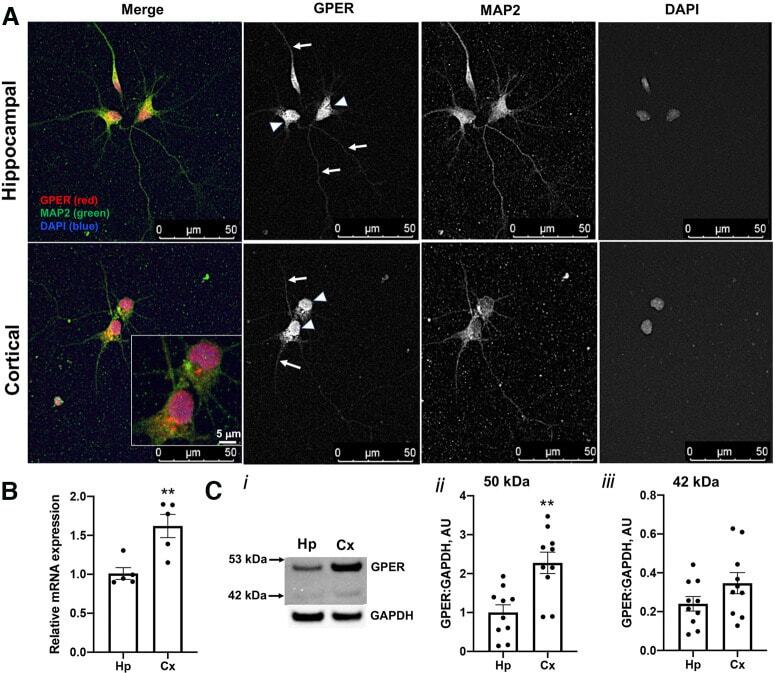
- Figure 7. Studies of GPER expression in hippocampal and cortical cultures and tissues. GPER expression and localization in cultured hippocampal and cortical neurons 72 HIC were measured using immunofluorescent and confocal microscopy techniques. A , Representative fluorescence images showing the localization of GPER (red) in cell bodies (arrowheads) and neurites (arrows). Cell nuclei are labeled with DAPI (blue) and neurites are labeled with MAP2 (green). B , RT-qPCR measurement of the relative GPER mRNA level in samples derived from hippocampal and cortical culture at 72 HIC shows a significantly (unpaired Student's t test, p < 0.01, n = 5 replicates) higher GPER mRNA level in cortical than hippocampal cultures. C , Western blot measurements of GPER protein expression in ex vivo hippocampal and cortical tissues from individual E18 rat brains ( n = 10) reveals two protein species with mass sizes of ~50 and 42 kDa ( i ). Statistical analysis shows that expression of GPER ~50 kDa is significantly higher in cortical than in hippocampal tissues ( ii ), while GPER ~42 kDa is slightly, but not significantly, higher in cortical than in hippocampal tissues ( iii ). Unpaired Student's t test; ** p < 0.01. The specificity of the GPER antibody used for this study was validated by immunocytochemistry and Western blotting. The validation results are shown in Extended Data Figure 7-1 .
- Submitted by
- Invitrogen Antibodies (provider)
- Main image
- Experimental details
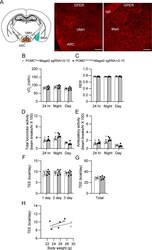
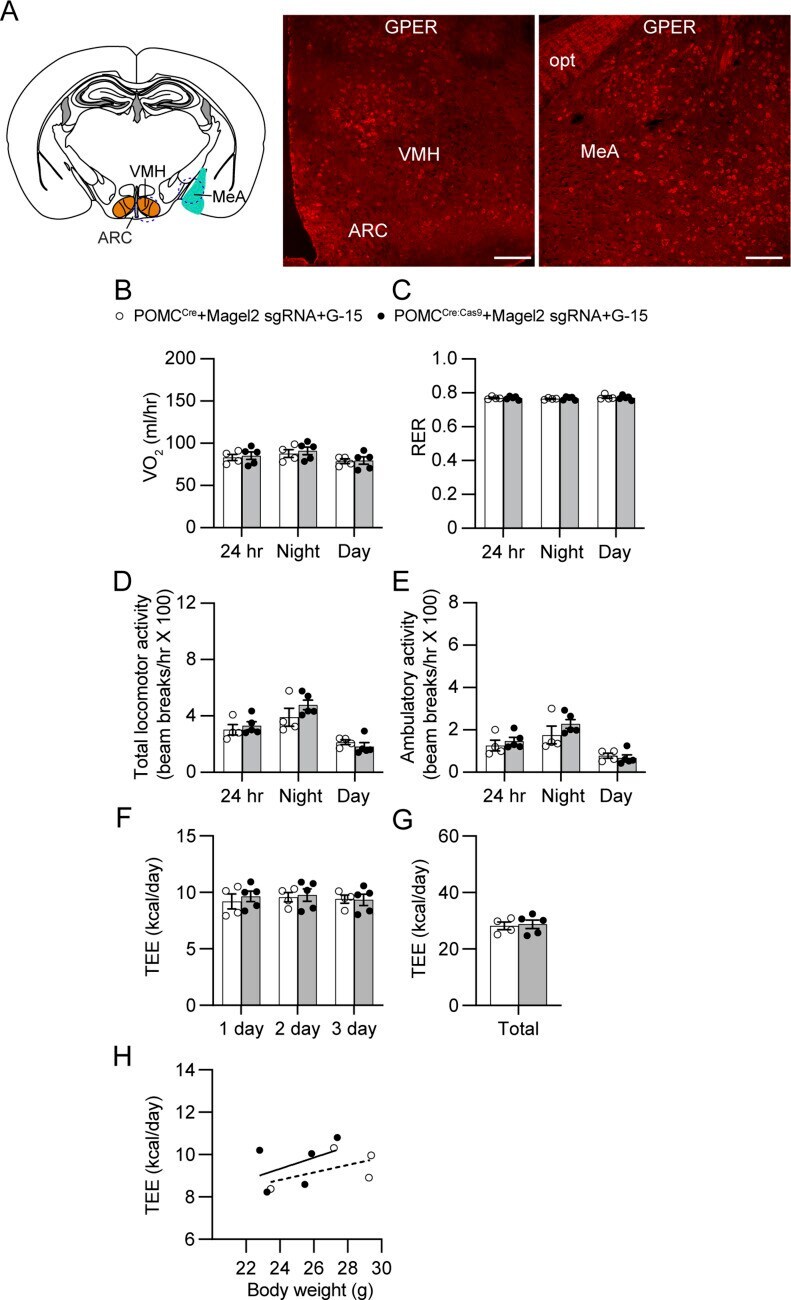
- Figure 7. Central GPER is critical in regulating locomotor activity in female mice without the Magel2 gene in ARC POMC neurons innervating the MeA. (A) Images of confocal fluorescence microscopy showing expression of GPER in the VMH (middle) and MeA (right) in female mice. Scale bar: 100 mum. (B, C) Summary plots showing VO 2 and respiratory exchange ratio between the experimental groups with G-15 infusion. At 10 wk of viral injection, the GPER antagonist G15 (5 mug/day []) was infused into the LV via osmotic pumps at a rate of 0.25 mul/hour. There were no significant differences in VO 2 and respiratory exchange ratio between the experimental groups. (D, E) Pooled data showing total and ambulatory activity between the experimental groups with G-15 infusion. An increase in locomotor activity was not observed in mice without the Magel2 gene in ARC POMC neurons innervating the MeA following treatment with G-15 infusion. (F, G, H) Summary plot showing TEE between the experimental groups. Regression plot showing TEE versus body weight (H).
- Submitted by
- Invitrogen Antibodies (provider)
- Main image
- Experimental details
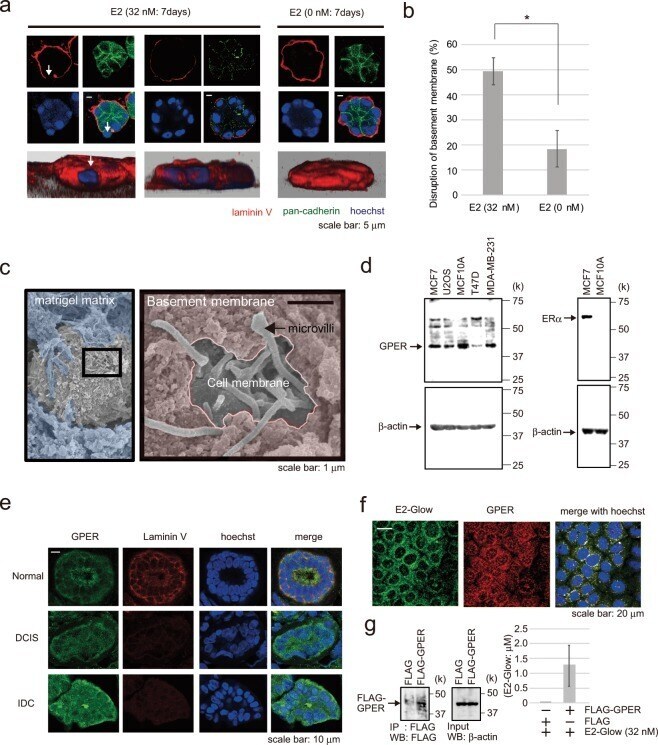
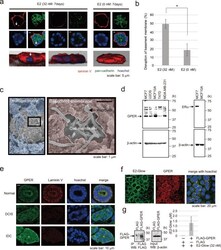
- Figure 1 Effect of E2 on a 3D model of the milk duct using MCF-10A cells. ( a ) Representative confocal images of MCF-10A cells in a 3D culture through the middle acini, which were treated with E2 (32 nM, left two panels) or control (0 nM, right panel) for 7 days. The basement membrane was examined via immunofluorescence staining using laminin V antibody (red); cell junctions were evaluated using pan-cadherin antibody (green). The reconstructed images of the acini structures by confocal microscopy are shown at the bottom with Hoechst (blue) and laminin V (red) staining. Arrows indicate the collapsed portion of the basement membrane. Scale bars = 5 mum. ( b ) The basement membrane was stained using anti-laminin V antibody, and the percentage of acini with disrupted basement membranes was calculated. Three independent experiments (32 nM E2; 54.5% (n = 55), 50% (n = 48), 43.8% (n = 57), 0 nM E2; 23.1% (n = 52), 22.2% (n = 54), 10% (n = 50)) were performed. Bars represent +/-SD. DATA were analyzed using a Mann-Whitney U test. *p values less than 0.05 were considered statistically significant. ( c ) Representative SEM images of MCF-10A cells in a 3D culture treated with 32 nM E2 for 72 h. SEM images are shown in Matrigel matrix (blue) and basement membrane (pink). ( d ) Western blotting of GPER-expressing cell lysates (MCF-7, U2OS, MCF-10A, T47D, and MDA-MB-231) (left). MCF-7 and MCF-10A cell lysates were further probed for ERalpha expression. ( e) Immunohistochemical analysis of