Explore
 Validate
 Learn
Learn Western blot
 ELISA
ELISA Immunocytochemistry
Antibody data
- Antibody Data
- Antigen structure
- References [6]
- Comments [0]
- Validations
- Immunocytochemistry [8]
- Immunohistochemistry [7]
- Flow cytometry [4]
- Other assay [4]
Submit
Validation data
Reference
Comment
Report error
- Product number
- PA5-95505 - Provider product page

- Provider
- Invitrogen Antibodies
- Product name
- S100A10 Polyclonal Antibody
- Antibody type
- Polyclonal
- Antigen
- Recombinant full-length protein
- Description
- Reconstitute with 0.2 mL of distilled water to yield a concentration of 500 µg/mL. Positive Control - WB: human placenta tissue, human A431 whole cell, human Hacat whole cell, human U87 whole cell, monkey lung tissue, rat PC-12 whole cell, mouse NIH/3T3 whole cell. IHC: human breast tissue, human intestinal diffuse large B-cell lymphoma tissue, human liver cancer tissue, human lung adenocarcinoma tissue, human ovarian serous adenocarcinoma tissue, human tonsil tissue. ICC/IF: U2OS cell. Flow: A431 cell.|Store at -20°C for one year from date of receipt. After reconstitution, at 4°C for one month. It can also be aliquotted and stored frozen at -20°C for six months. Avoid repeated freeze-thaw cycles.
- Reactivity
- Human, Mouse, Rat
- Host
- Rabbit
- Isotype
- IgG
- Vial size
- 100 μg
- Concentration
- 500 μg/mL
- Storage
- -20°C
Submitted references Multiple therapeutic effects of human neural stem cells derived from induced pluripotent stem cells in a rat model of post-traumatic syringomyelia.
Photobiomodulation Promotes Repair Following Spinal Cord Injury by Regulating the Transformation of A1/A2 Reactive Astrocytes.
Melatonin Ameliorates Axonal Hypomyelination of Periventricular White Matter by Transforming A1 to A2 Astrocyte via JAK2/STAT3 Pathway in Septic Neonatal Rats.
Sequential progenitor states mark the generation of pancreatic endocrine lineages in mice and humans.
AIM2 inflammasome mediates hallmark neuropathological alterations and cognitive impairment in a mouse model of vascular dementia.
Contribution of endogenous antibodies to learning deficits and astrocytosis in human P301S mutant tau transgenic mice.
Xu T, Li X, Guo Y, Uhlin E, Holmberg L, Mitra S, Winn D, Falk A, Sundström E
EBioMedicine 2022 Mar;77:103882
EBioMedicine 2022 Mar;77:103882
Photobiomodulation Promotes Repair Following Spinal Cord Injury by Regulating the Transformation of A1/A2 Reactive Astrocytes.
Wang X, Zhang Z, Zhu Z, Liang Z, Zuo X, Ju C, Song Z, Li X, Hu X, Wang Z
Frontiers in neuroscience 2021;15:768262
Frontiers in neuroscience 2021;15:768262
Melatonin Ameliorates Axonal Hypomyelination of Periventricular White Matter by Transforming A1 to A2 Astrocyte via JAK2/STAT3 Pathway in Septic Neonatal Rats.
Jiang S, Wang H, Zhou Q, Li Q, Liu N, Li Z, Chen C, Deng Y
Journal of inflammation research 2021;14:5919-5937
Journal of inflammation research 2021;14:5919-5937
Sequential progenitor states mark the generation of pancreatic endocrine lineages in mice and humans.
Yu XX, Qiu WL, Yang L, Wang YC, He MY, Wang D, Zhang Y, Li LC, Zhang J, Wang Y, Xu CR
Cell research 2021 Aug;31(8):886-903
Cell research 2021 Aug;31(8):886-903
AIM2 inflammasome mediates hallmark neuropathological alterations and cognitive impairment in a mouse model of vascular dementia.
Poh L, Fann DY, Wong P, Lim HM, Foo SL, Kang SW, Rajeev V, Selvaraji S, Iyer VR, Parathy N, Khan MB, Hess DC, Jo DG, Drummond GR, Sobey CG, Lai MKP, Chen CL, Lim LHK, Arumugam TV
Molecular psychiatry 2021 Aug;26(8):4544-4560
Molecular psychiatry 2021 Aug;26(8):4544-4560
Contribution of endogenous antibodies to learning deficits and astrocytosis in human P301S mutant tau transgenic mice.
van der Hoven J, van Hummel A, Przybyla M, Asih PR, Gajwani M, Feiten AF, Ke YD, Ittner A, van Eersel J, Ittner LM
Scientific reports 2020 Aug 14;10(1):13845
Scientific reports 2020 Aug 14;10(1):13845
No comments: Submit comment
Supportive validation
- Submitted by
- Invitrogen Antibodies (provider)
- Main image

- Experimental details
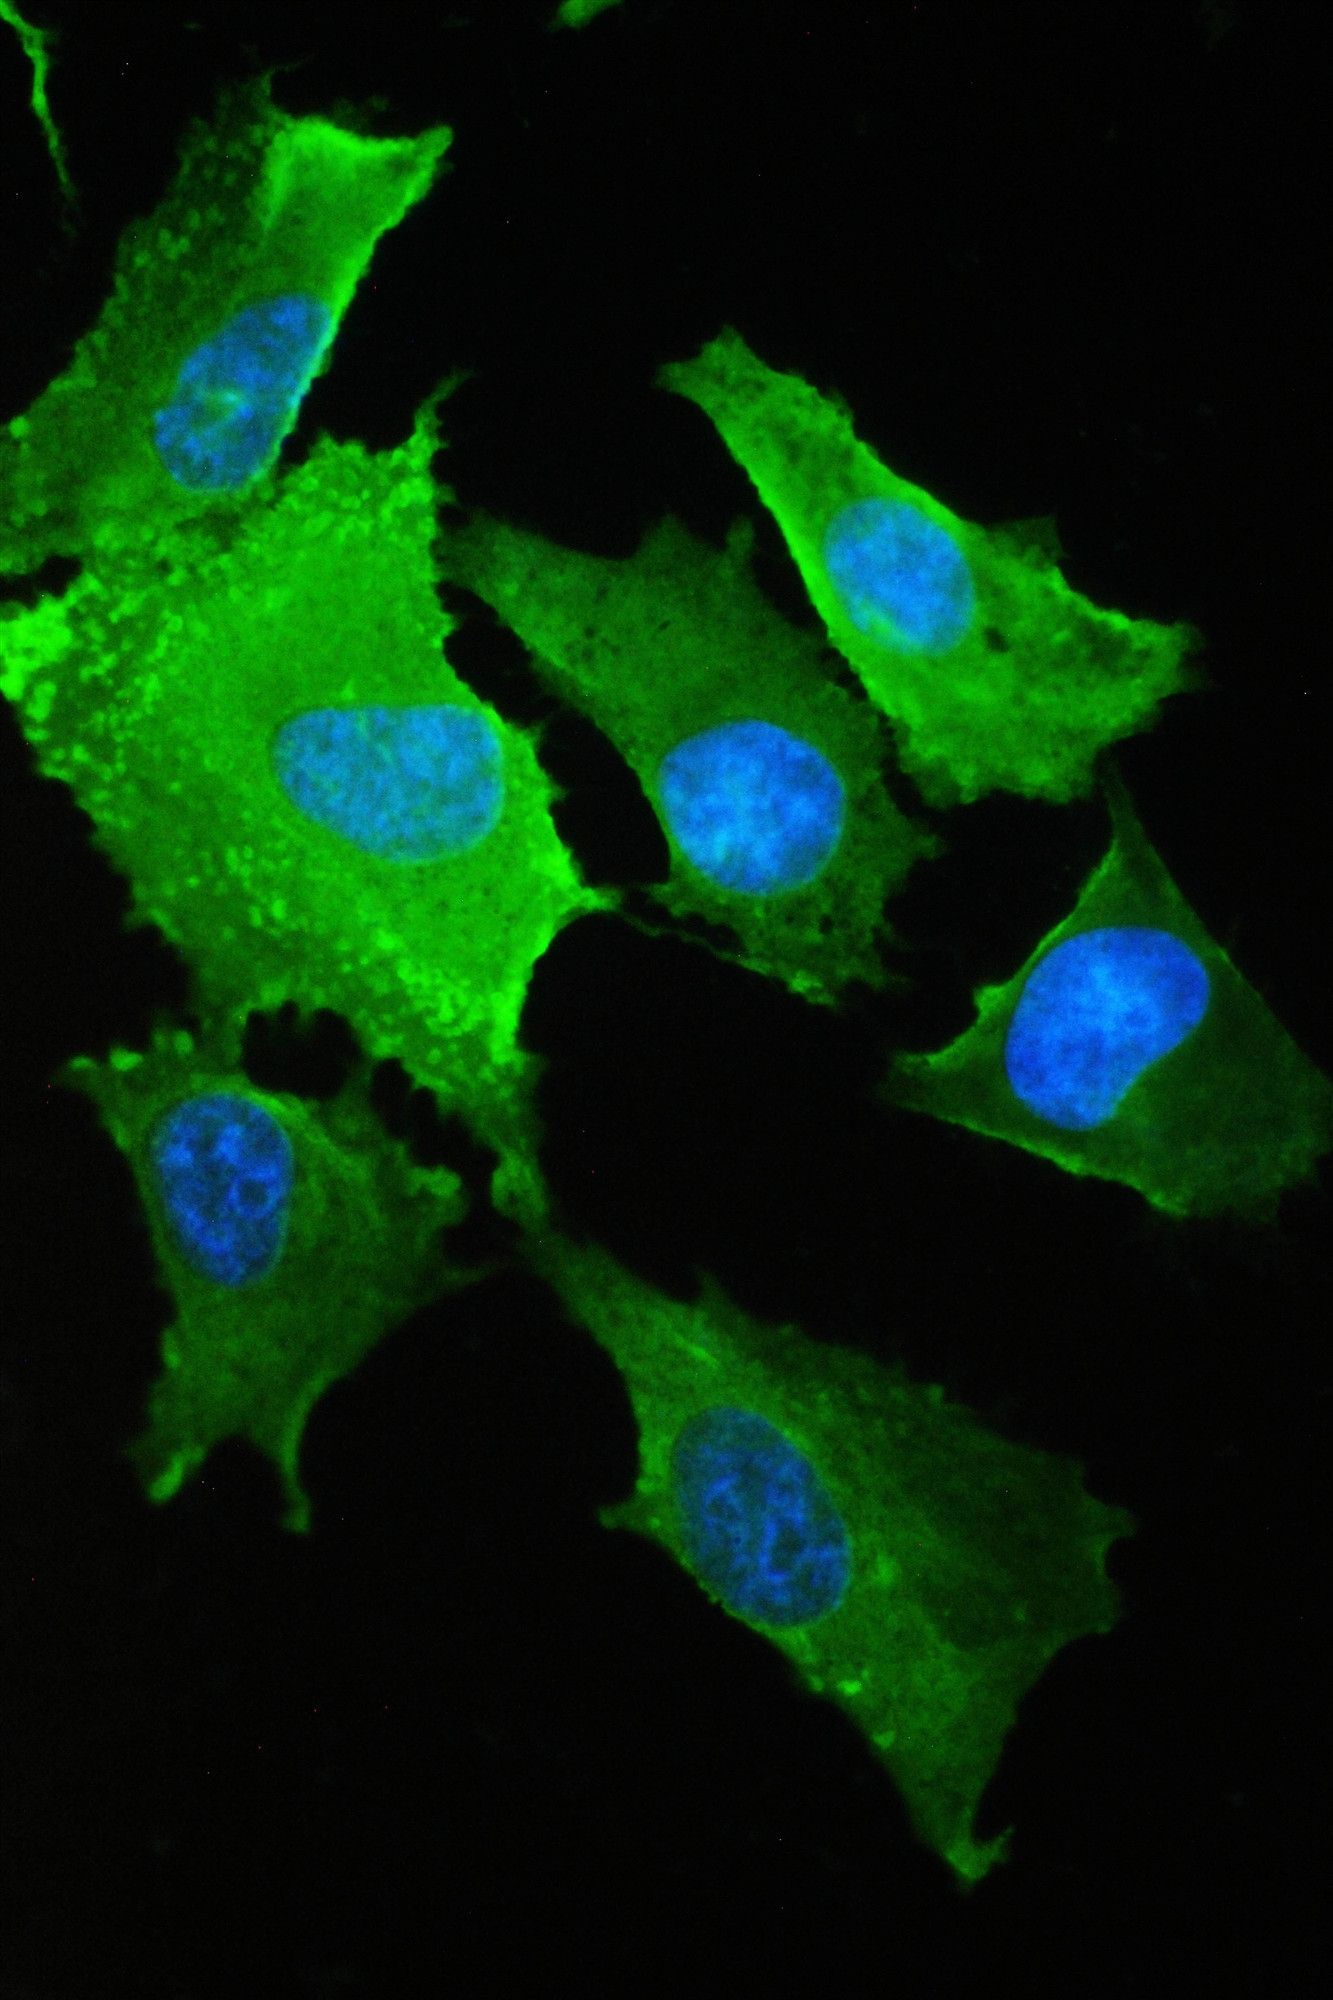
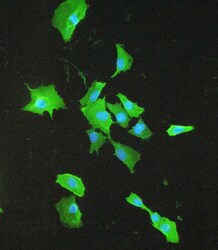
- Immunofluorescence analysis of S100A10 in A549 cell. Antigen retrieval was performed on the tissue using IHC enzyme antigen retrieval reagent and blocked with 10% goat serum. Samples were incubated with S100A10 polyclonal antibody (Product # PA5-95505) at a 2 µg/mL dilution, followed by 488 conjugated goat anti-rabbit IgG using a 1:100 dilution and DAPI.

- Submitted by
- Invitrogen Antibodies (provider)
- Main image

- Experimental details
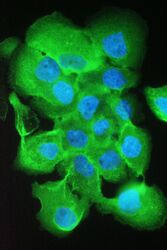
- Immunofluorescence analysis of S100A10 in A431 cell. Antigen retrieval was performed on the tissue using IHC enzyme antigen retrieval reagent and blocked with 10% goat serum. Samples were incubated with S100A10 polyclonal antibody (Product # PA5-95505) at a 2 µg/1x10^6 cells dilution, followed by 488 conjugated goat anti-rabbit IgG using a 1:100 dilution and DAPI.

- Submitted by
- Invitrogen Antibodies (provider)
- Main image

- Experimental details
- Immunofluorescence analysis of S100A10 in A549 cell. Antigen retrieval was performed on the tissue using IHC enzyme antigen retrieval reagent and blocked with 10% goat serum. Samples were incubated with S100A10 polyclonal antibody (Product # PA5-95505) at a 2 µg/mL dilution, followed by 488 conjugated goat anti-rabbit IgG using a 1:100 dilution and DAPI.
- Submitted by
- Invitrogen Antibodies (provider)
- Main image
- Experimental details
- Immunofluorescence analysis of S100A10 in A549 cell. Antigen retrieval was performed on the tissue using IHC enzyme antigen retrieval reagent and blocked with 10% goat serum. Samples were incubated with S100A10 polyclonal antibody (Product # PA5-95505) at a 2 µg/mL dilution, followed by 488 conjugated goat anti-rabbit IgG using a 1:100 dilution and DAPI.

- Submitted by
- Invitrogen Antibodies (provider)
- Main image
- Experimental details
- Immunofluorescence analysis of S100A10 in A431 cell. Antigen retrieval was performed on the tissue using IHC enzyme antigen retrieval reagent and blocked with 10% goat serum. Samples were incubated with S100A10 polyclonal antibody (Product # PA5-95505) at a 2 µg/1x10^6 cells dilution, followed by 488 conjugated goat anti-rabbit IgG using a 1:100 dilution and DAPI.

- Submitted by
- Invitrogen Antibodies (provider)
- Main image
- Experimental details
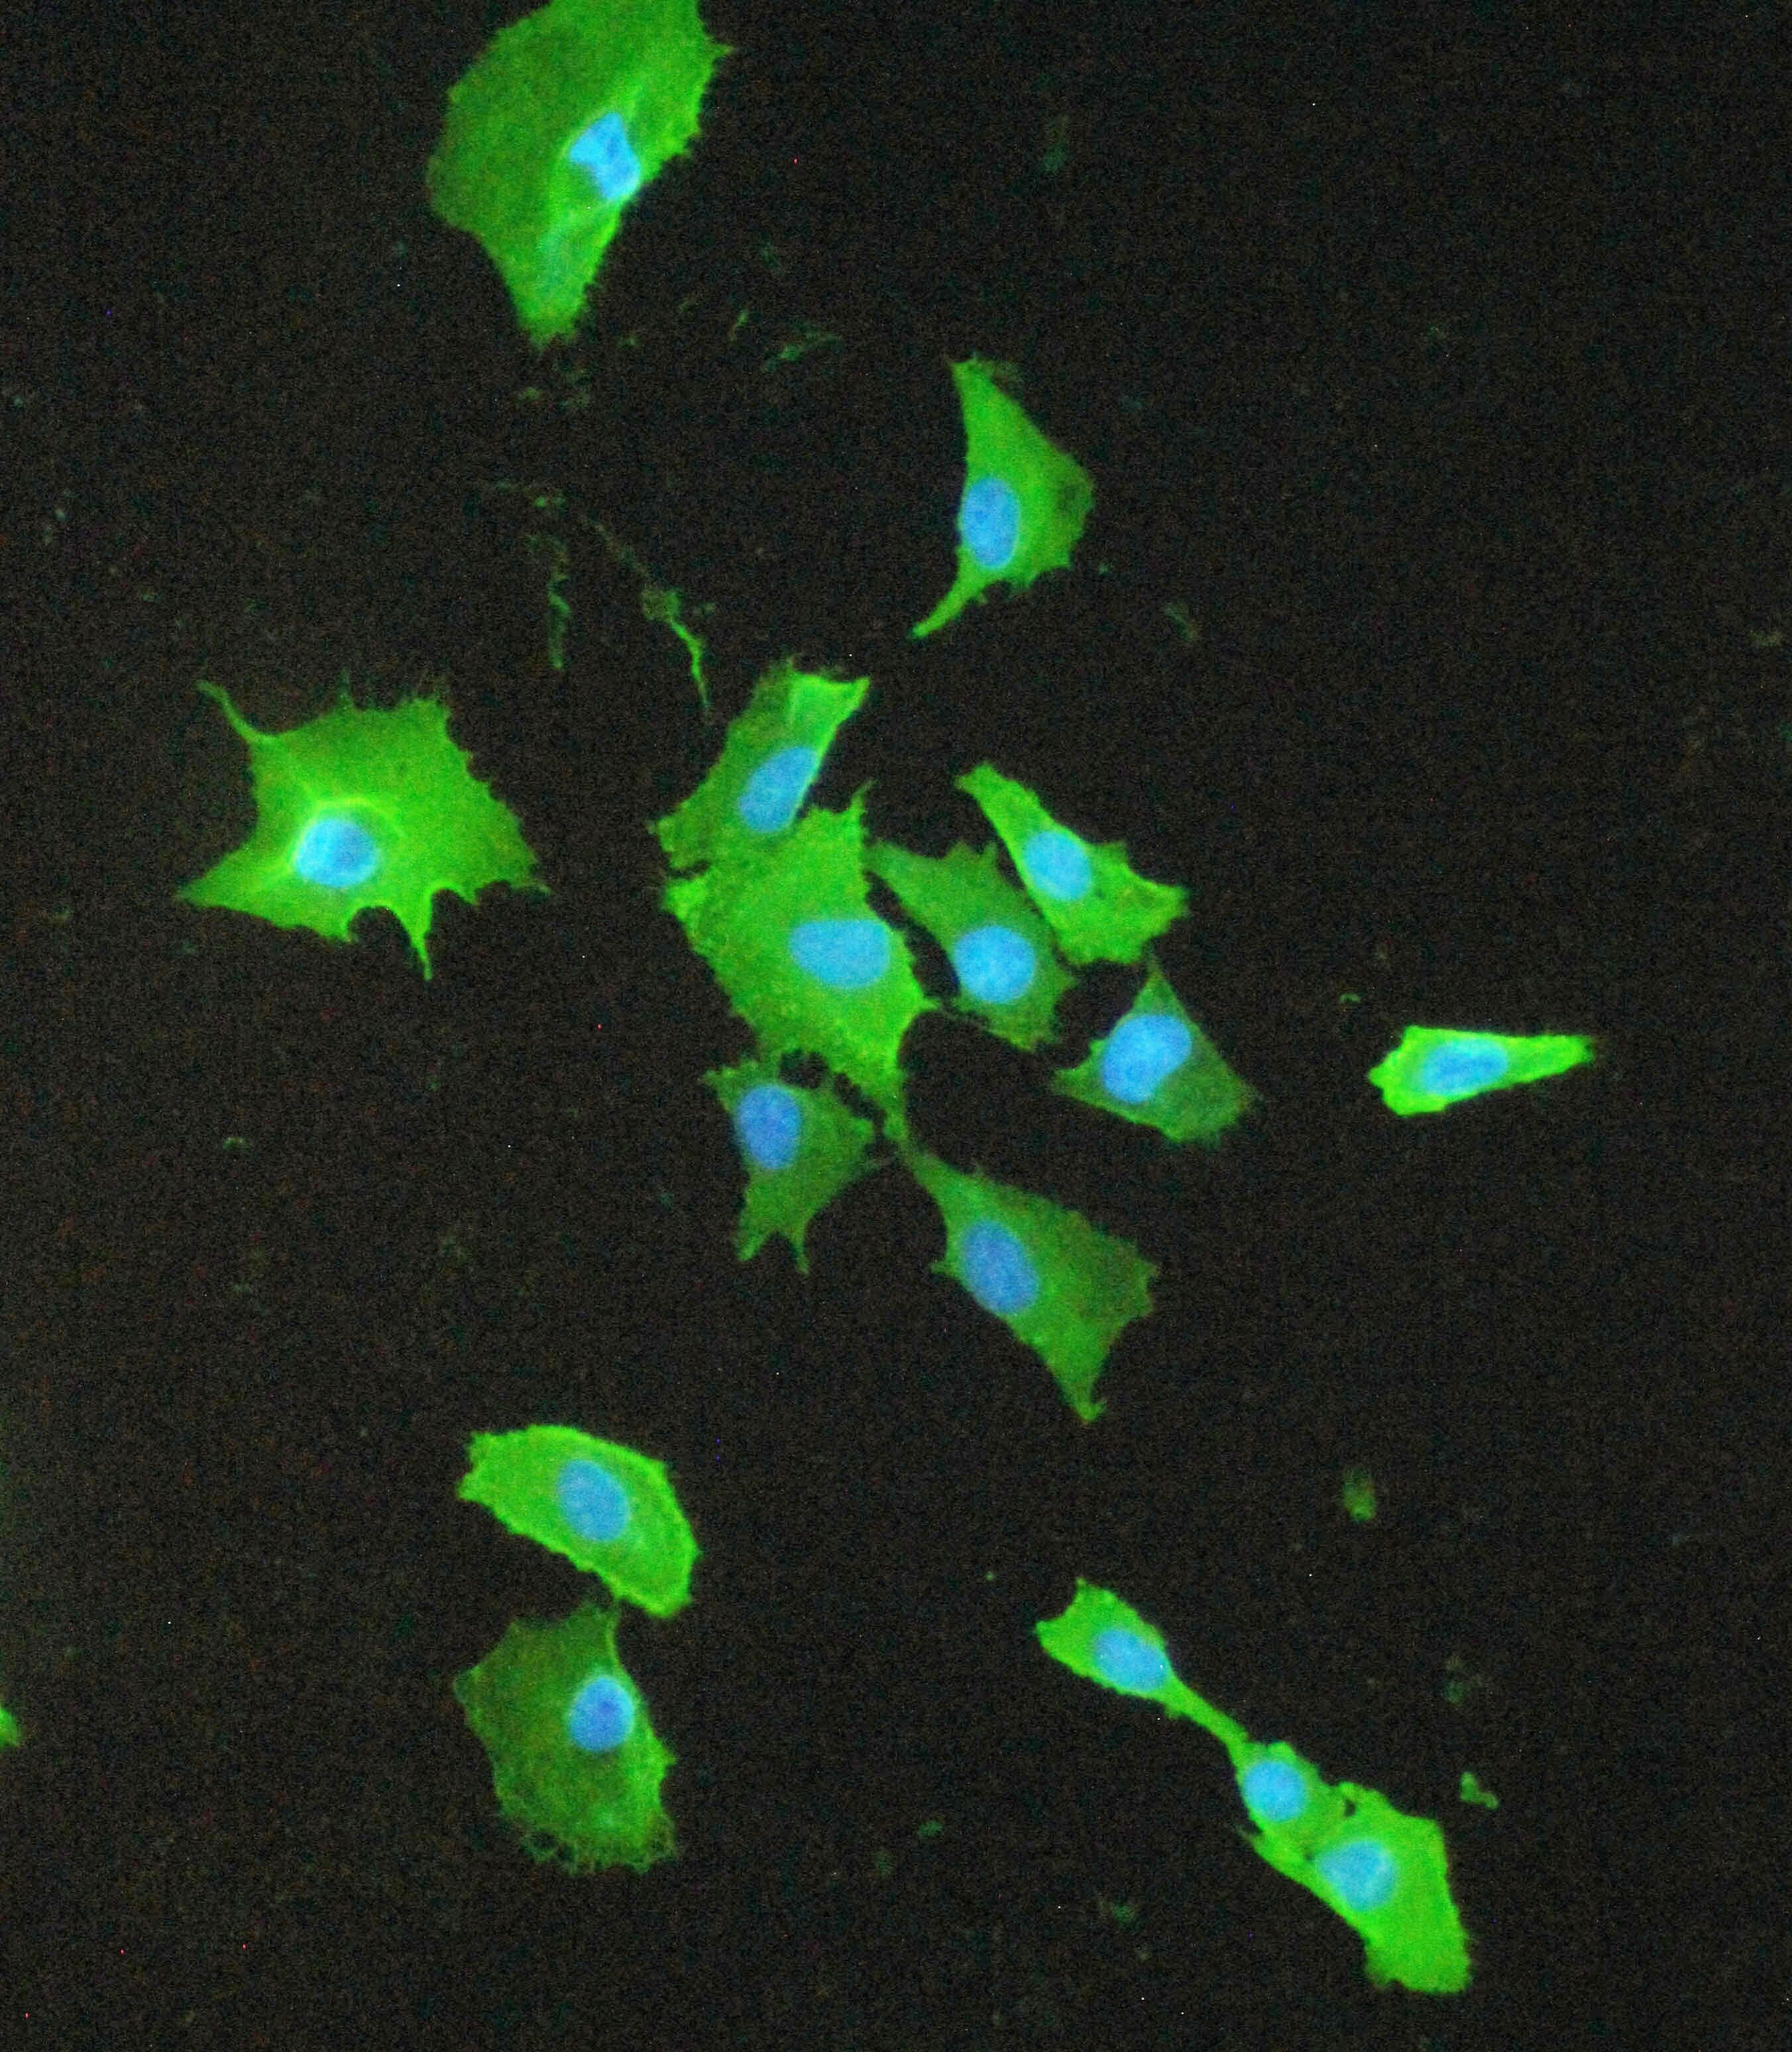
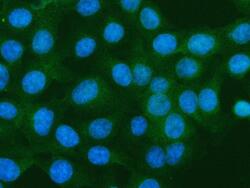
- Immunocytochemistry/Immunofluorescence analysis of S100A10 in U2OS cells using S100A10 Polyclonal Antibody (Product # PA5-95505). Enzyme antigen retrieval was performed using IHC enzyme antigen retrieval reagent for 15 mins. The cells were blocked with 10% goat serum and incubated with the primary antibody at 5 µg/mL. DyLight 488 conjugated goat anti-rabbit IgG was used as secondary antibody at 1:500 dilution and incubated for 30 minutes at 37°C. The section was counterstained with DAPI. Visualize using a fluorescence microscope and filter sets appropriate for the label used.

Supportive validation
- Submitted by
- Invitrogen Antibodies (provider)
- Main image

- Experimental details
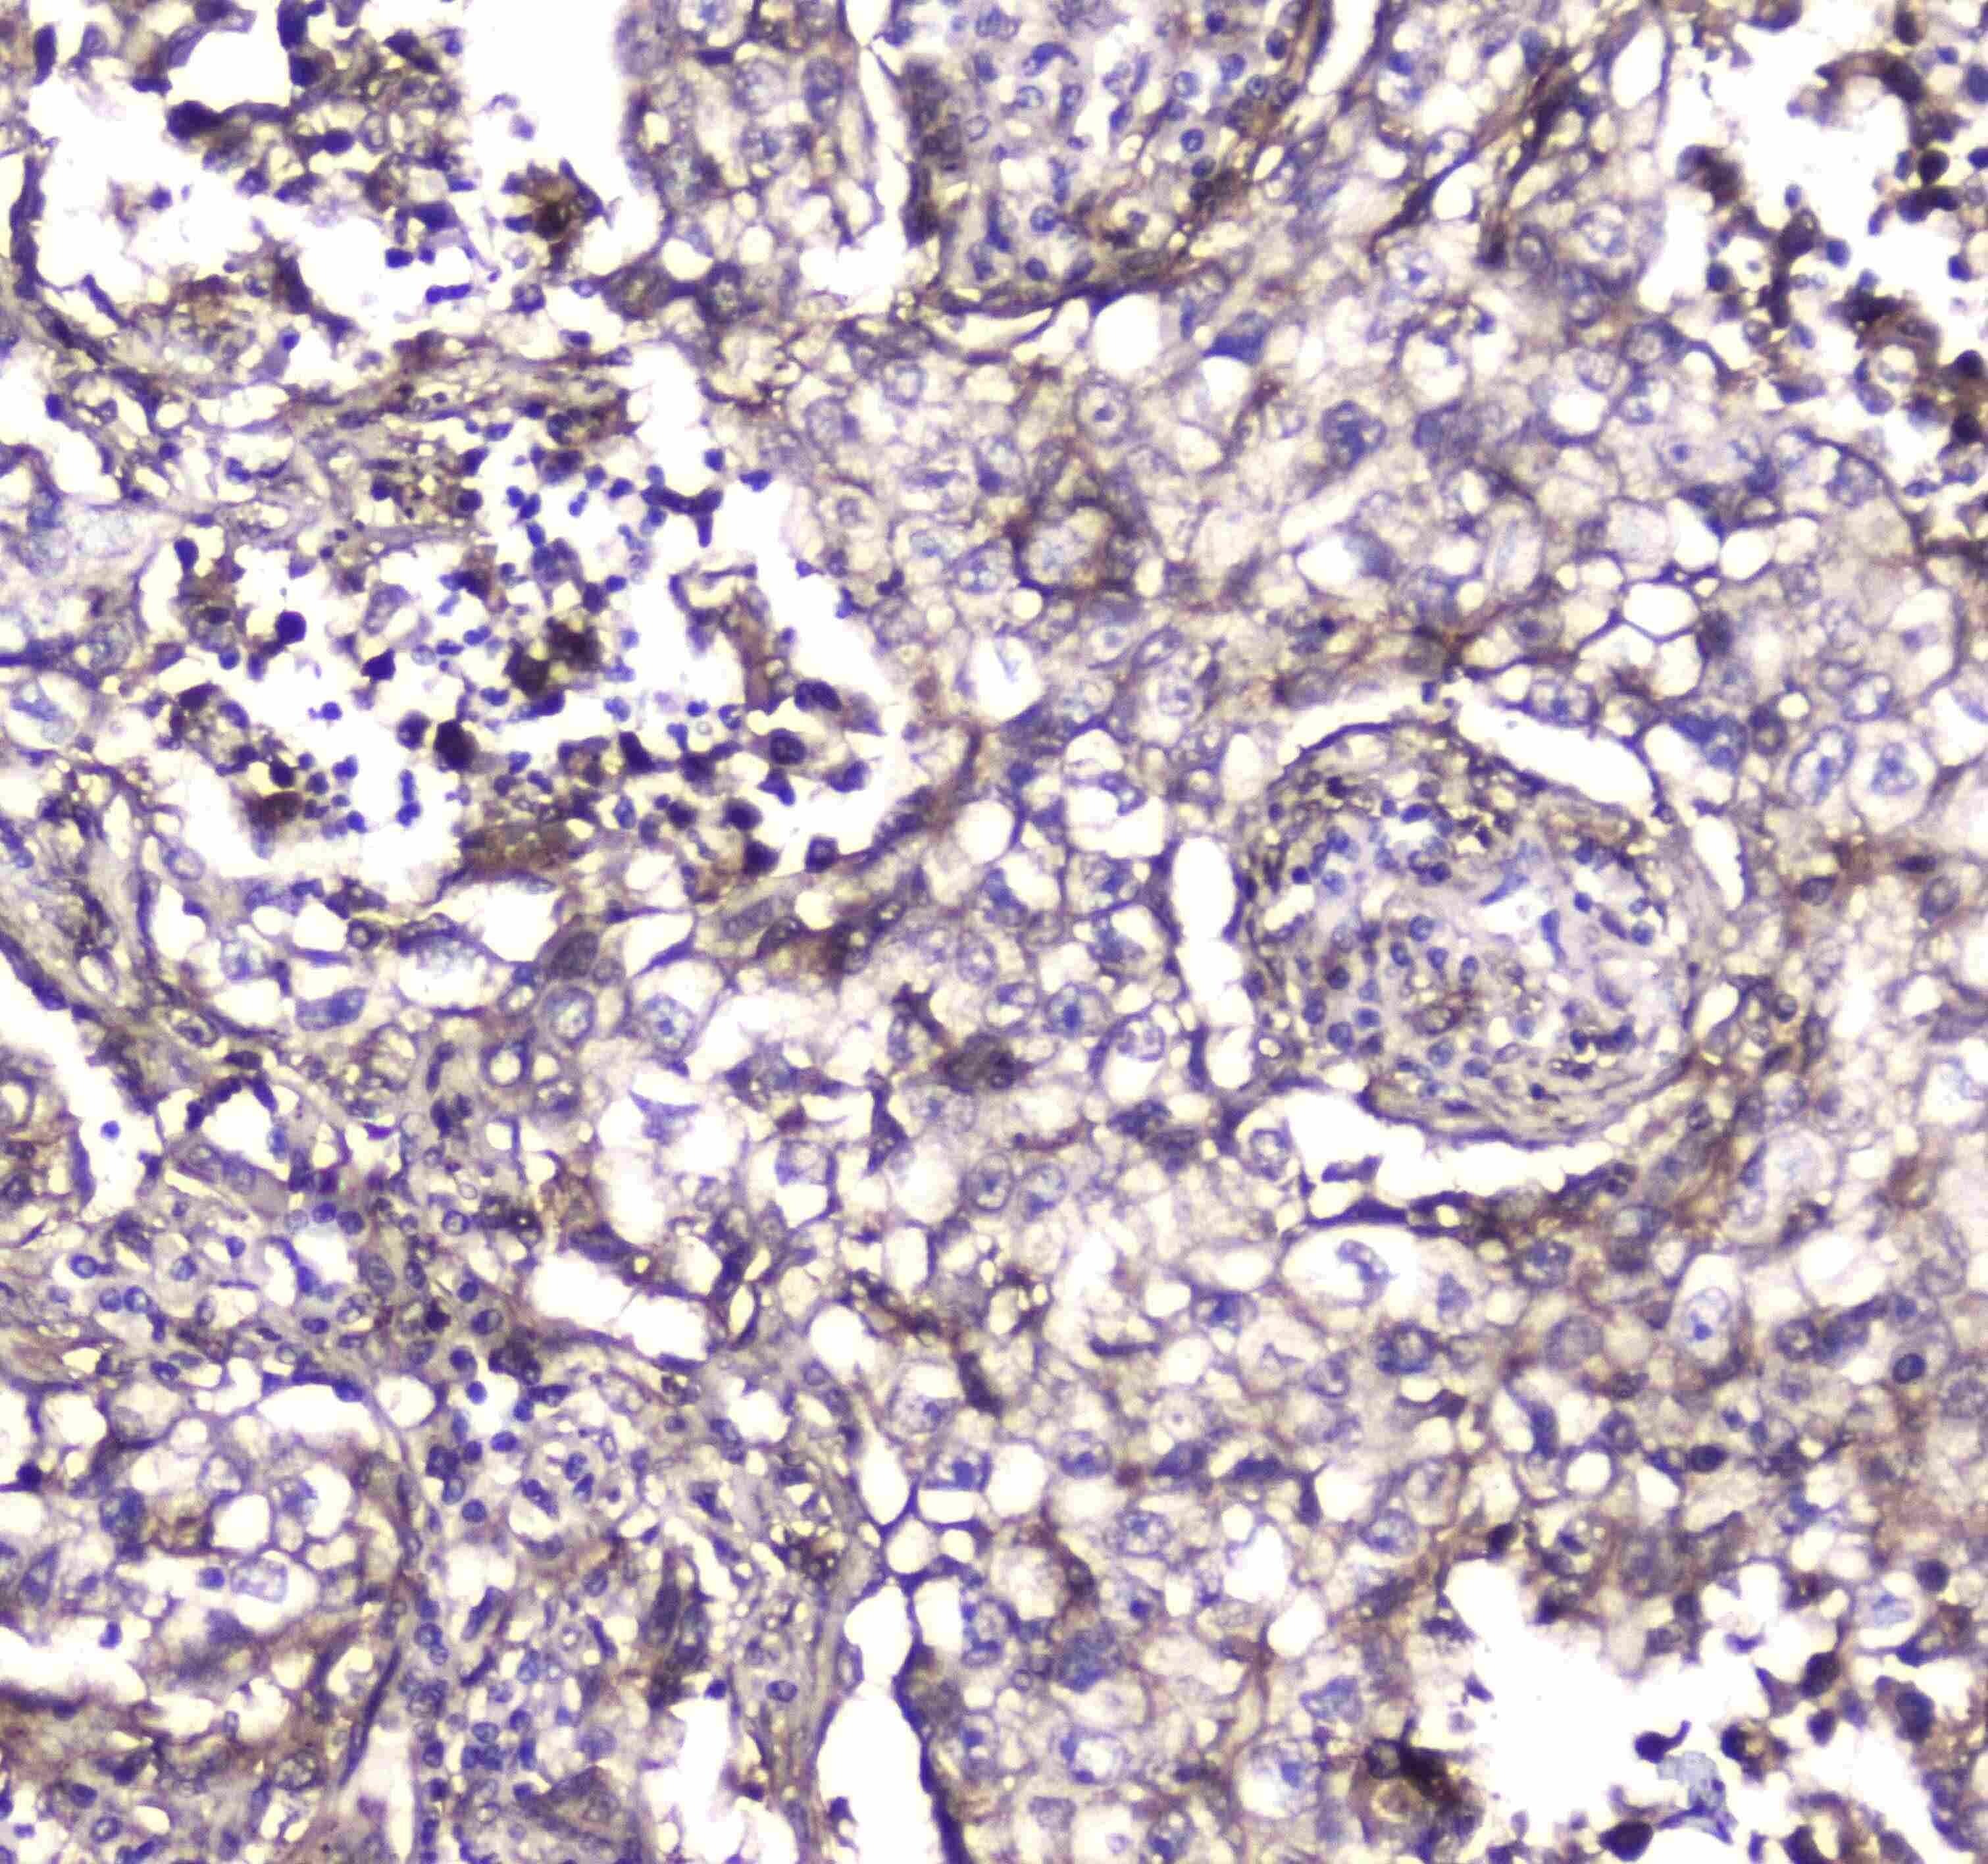
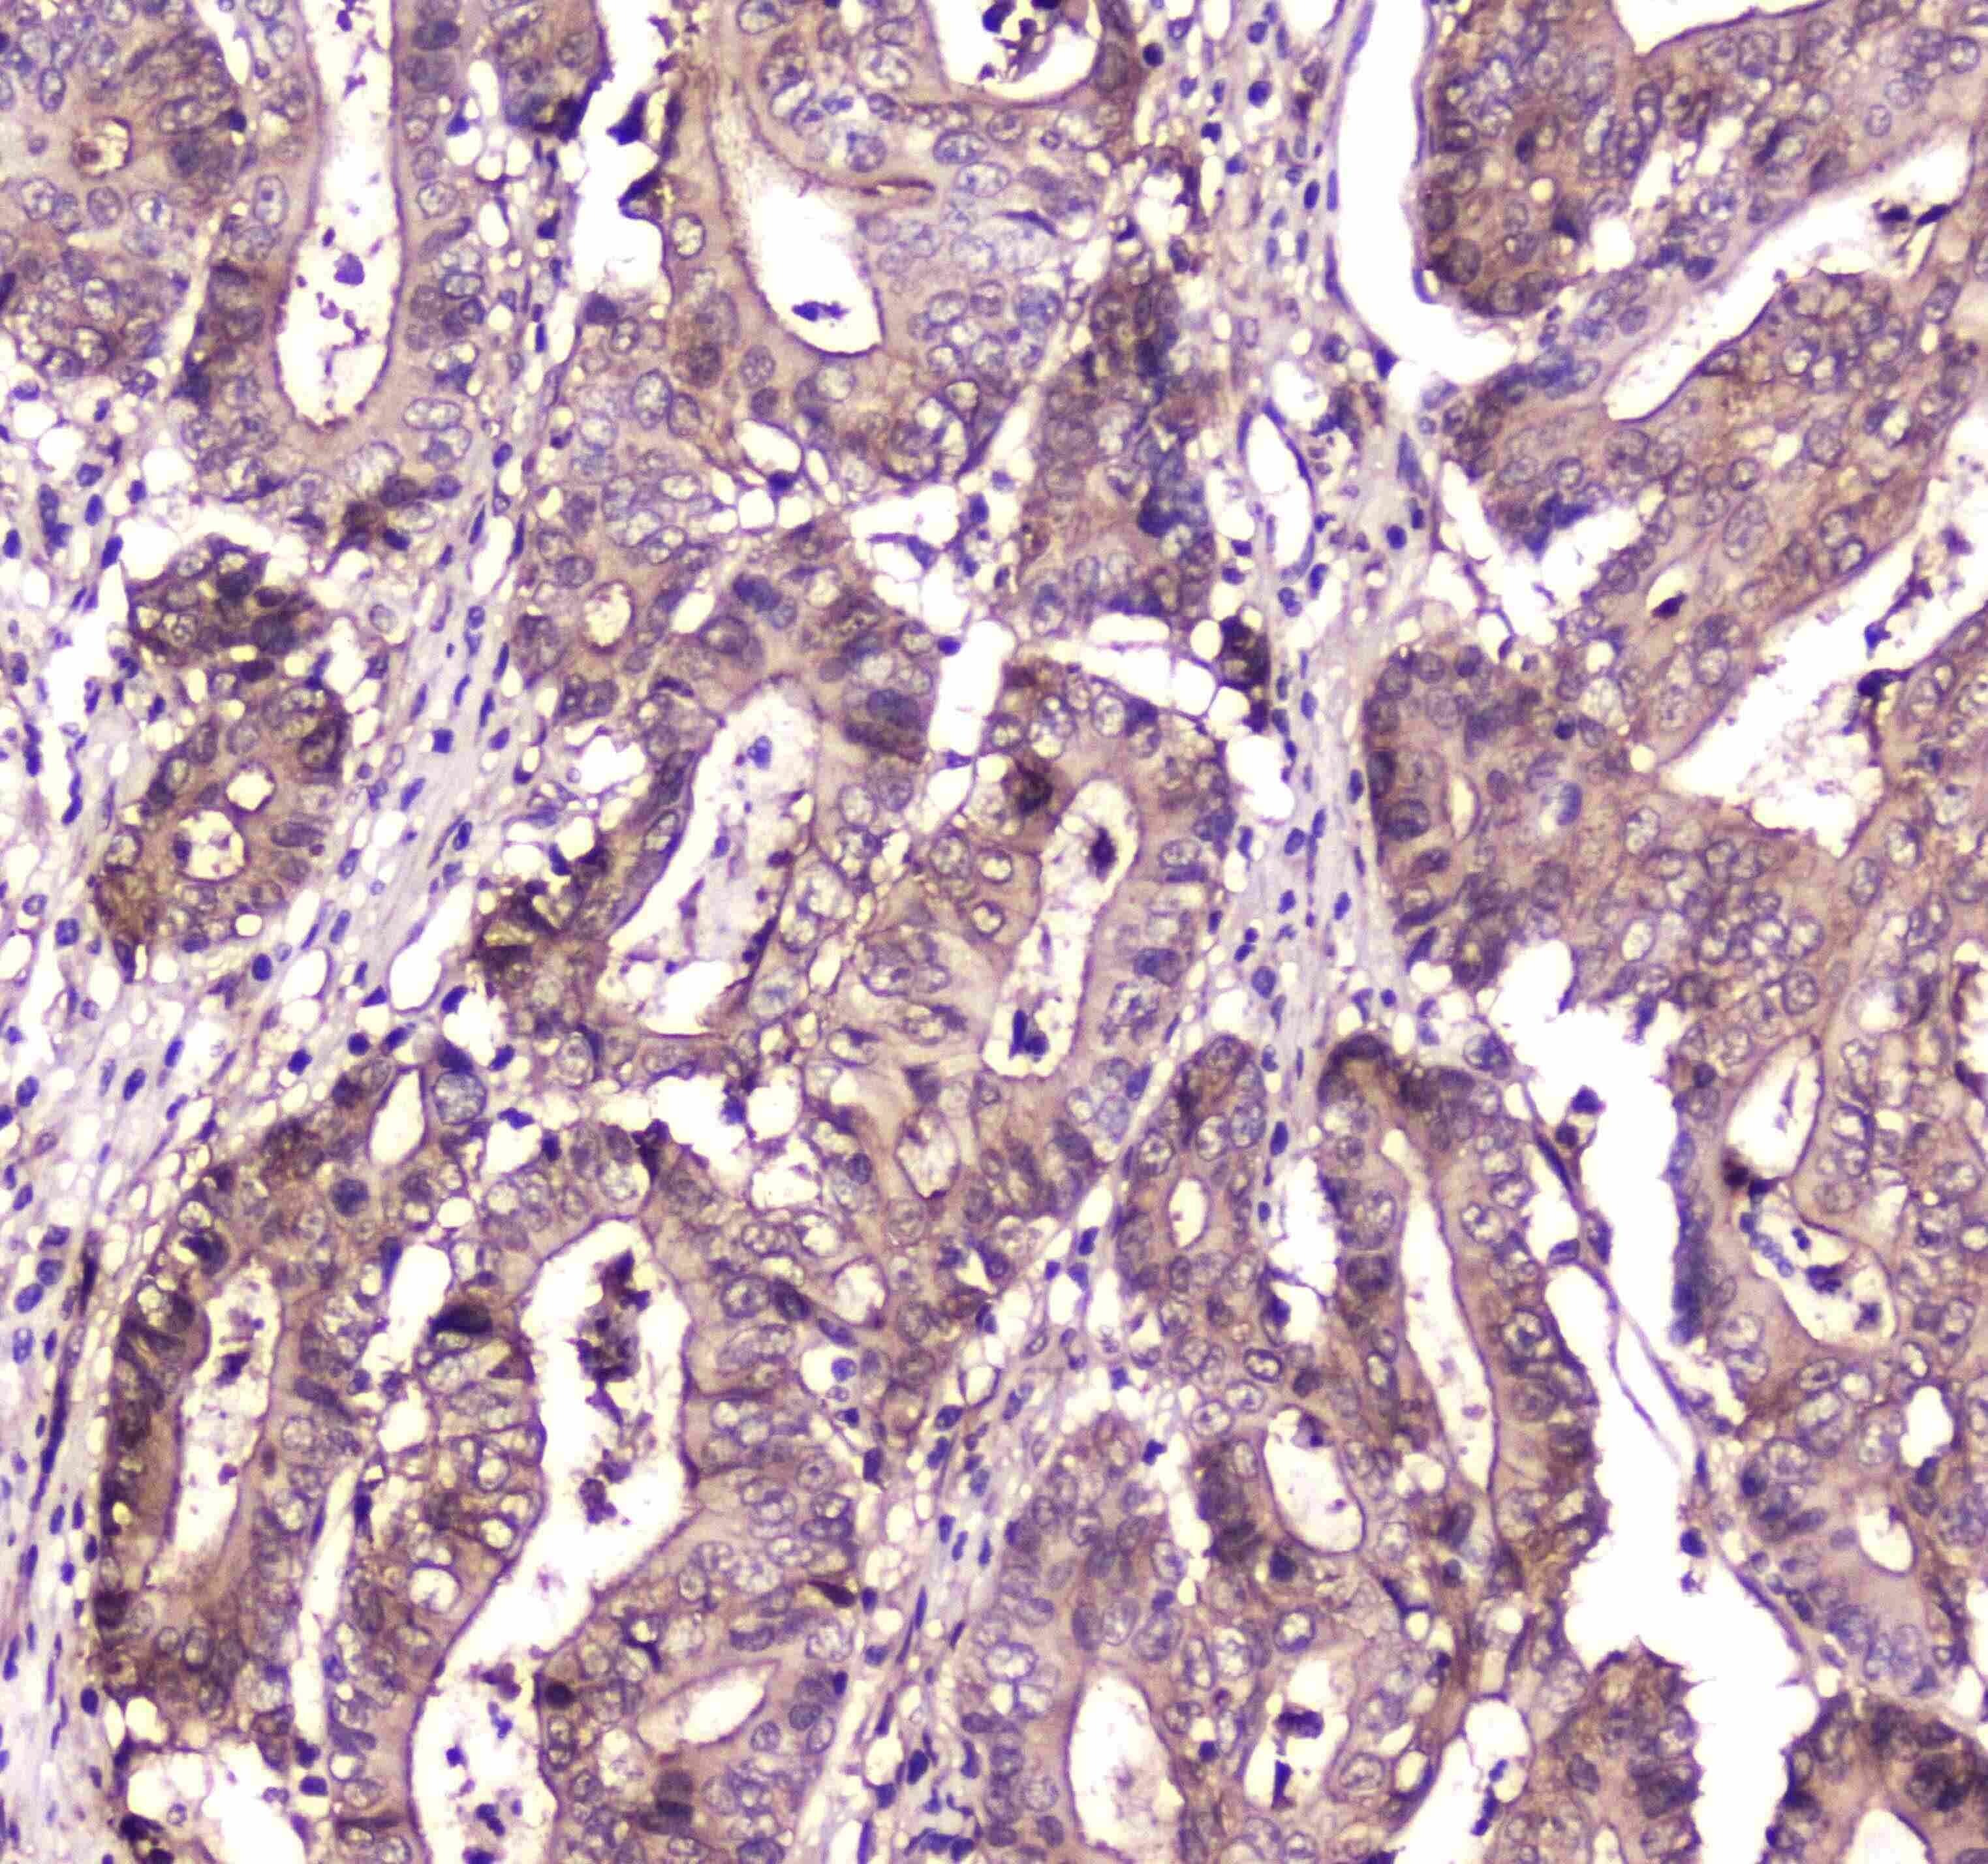
- Immunohistochemistry analysis of S100A10 in paraffin-embedded human lung cancer tissue. Antigen retrieval was performed on the tissue using citrate buffer (pH 6, 20 min) and blocked with 10% goat serum. Samples were incubated with S100A10 polyclonal antibody (Product # PA5-95505) at a 1 µg/mL dilution, followed by biotinylated goat anti-rabbit IgG (30 min, 37°C), and developed with Strepavidin-Biotin-Complex and DAB.
- Submitted by
- Invitrogen Antibodies (provider)
- Main image

- Experimental details
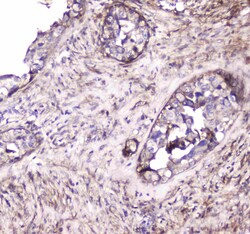
- Immunohistochemistry analysis of S100A10 in paraffin-embedded human mammary cancer tissue. Antigen retrieval was performed on the tissue using citrate buffer (pH 6, 20 min) and blocked with 10% goat serum. Samples were incubated with S100A10 polyclonal antibody (Product # PA5-95505) at a 1 µg/mL dilution, followed by biotinylated goat anti-rabbit IgG (30 min, 37°C), and developed with Strepavidin-Biotin-Complex and DAB.
- Submitted by
- Invitrogen Antibodies (provider)
- Main image

- Experimental details
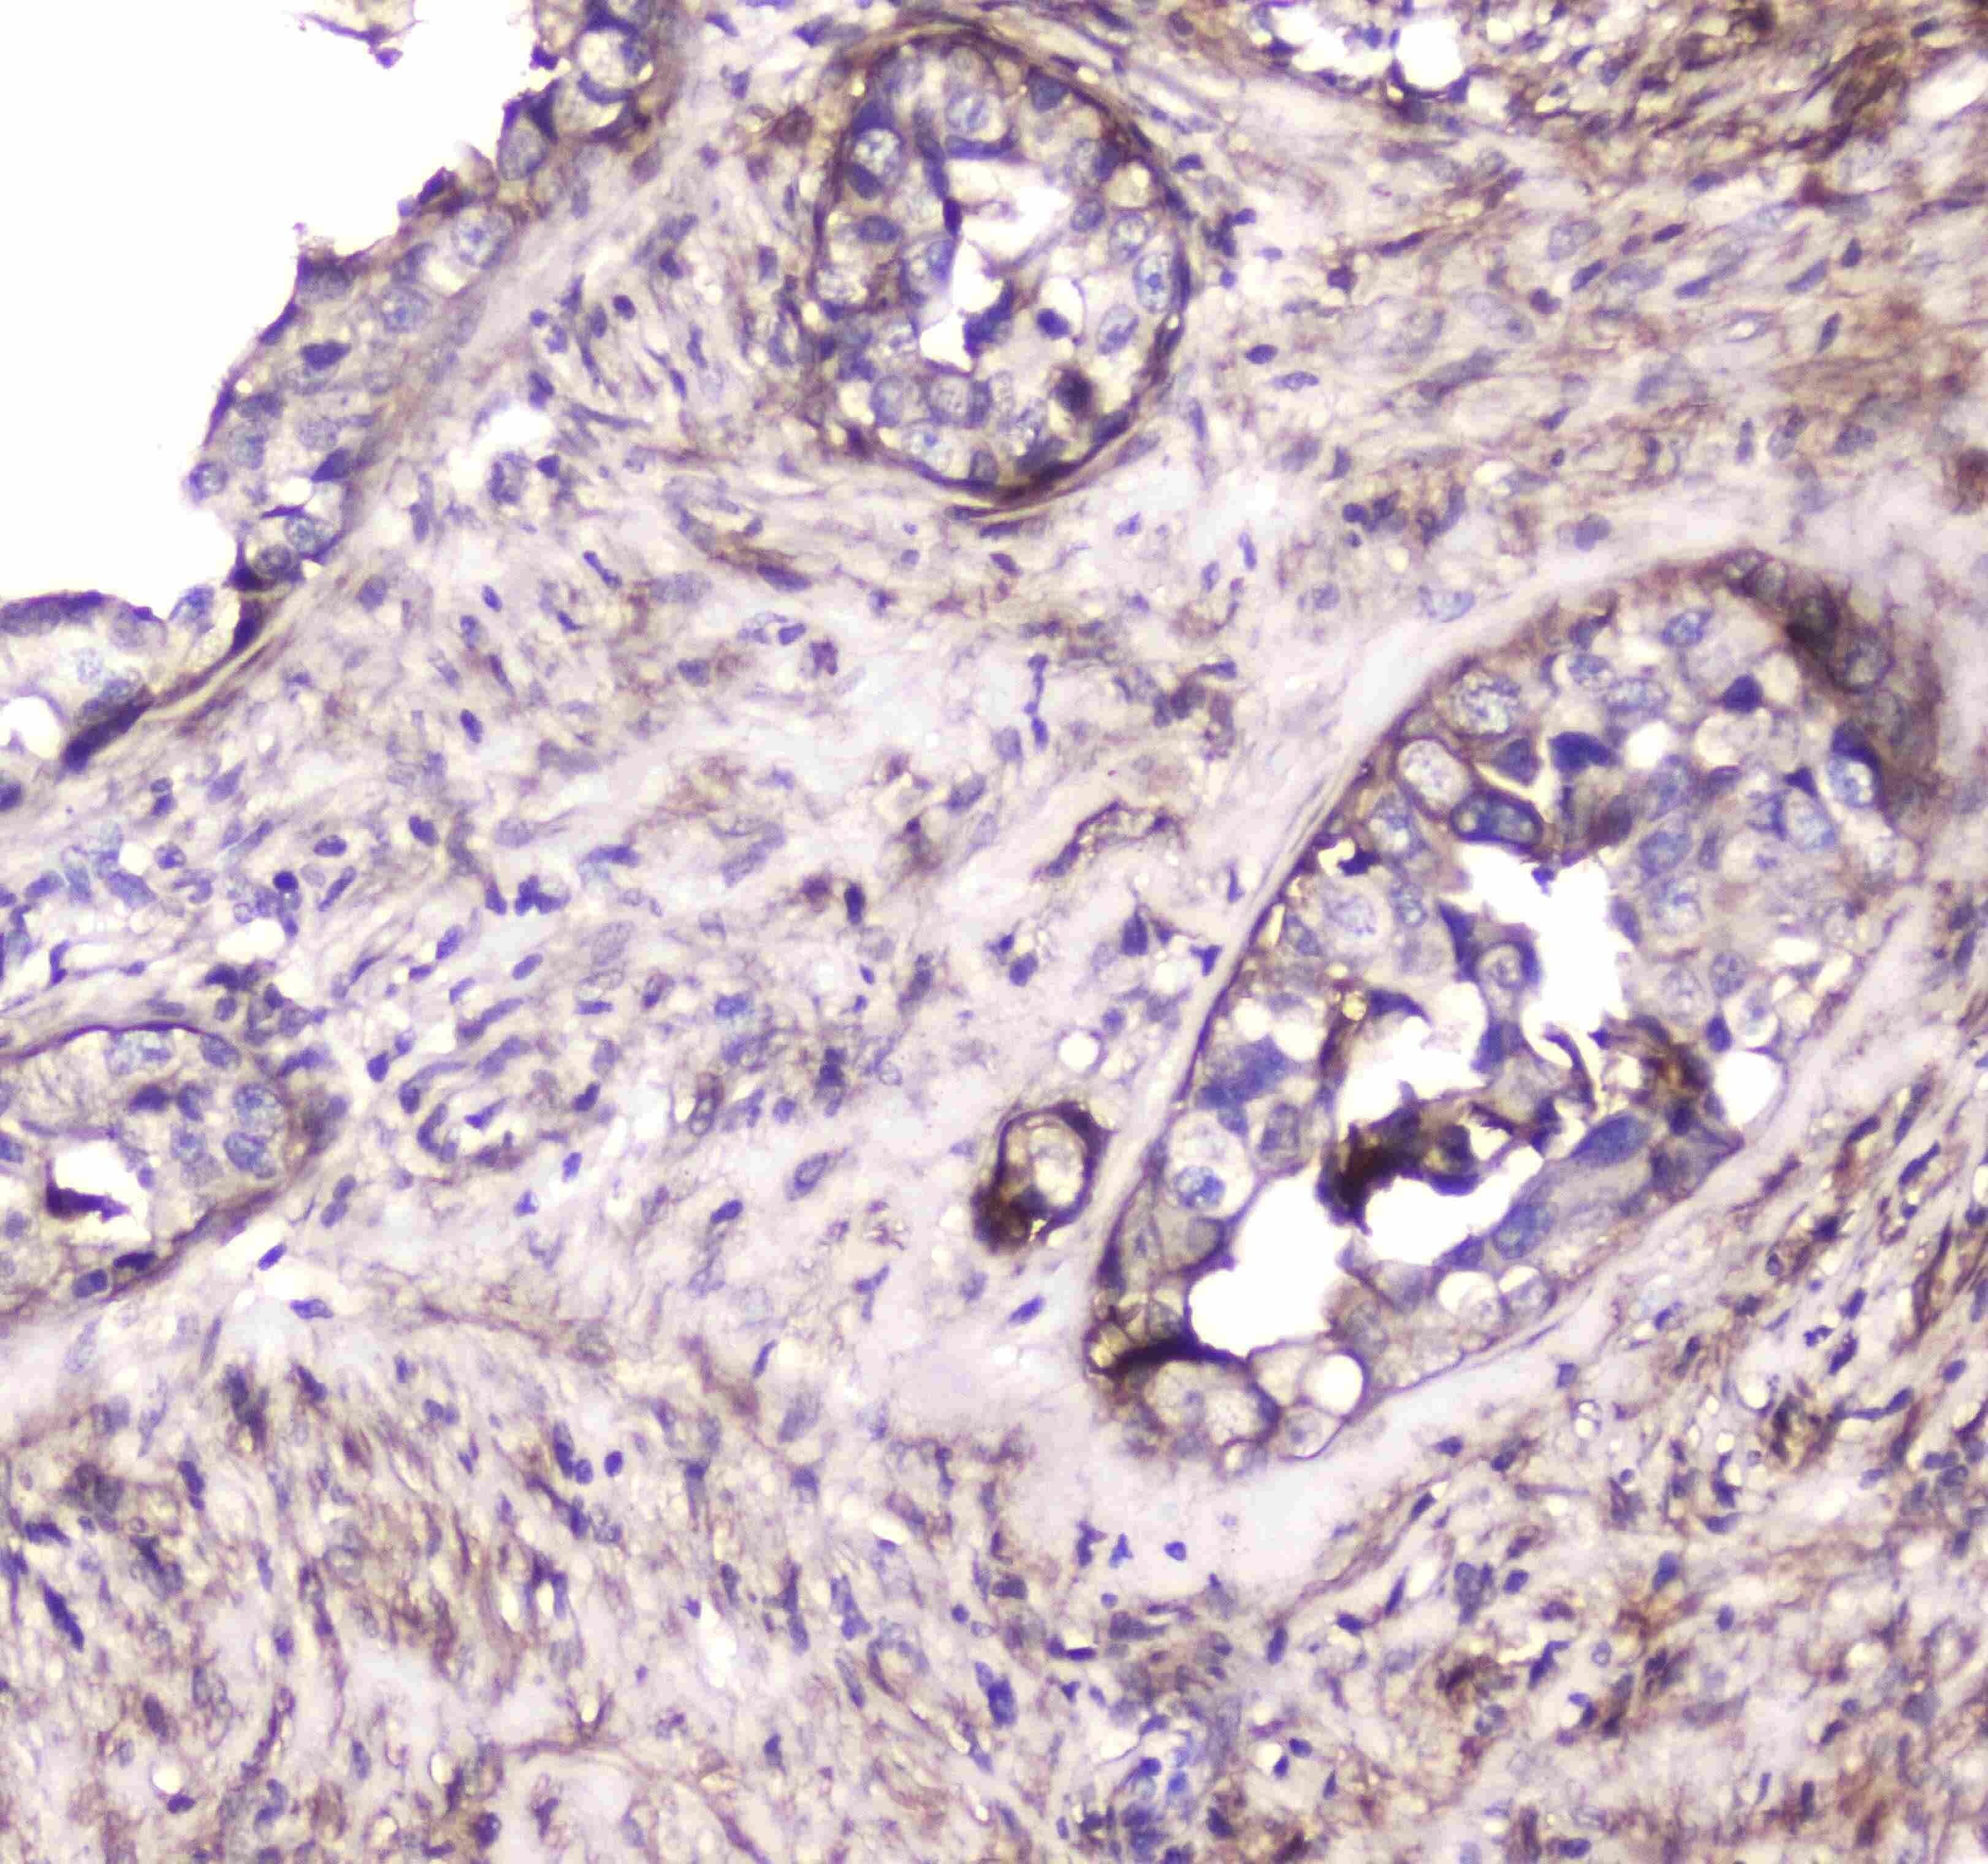
- Immunohistochemistry analysis of S100A10 in paraffin-embedded human rectal cancer tissue. Antigen retrieval was performed on the tissue using citrate buffer (pH 6, 20 min) and blocked with 10% goat serum. Samples were incubated with S100A10 polyclonal antibody (Product # PA5-95505) at a 1 µg/mL dilution, followed by biotinylated goat anti-rabbit IgG (30 min, 37°C), and developed with Strepavidin-Biotin-Complex and DAB.
- Submitted by
- Invitrogen Antibodies (provider)
- Main image
- Experimental details
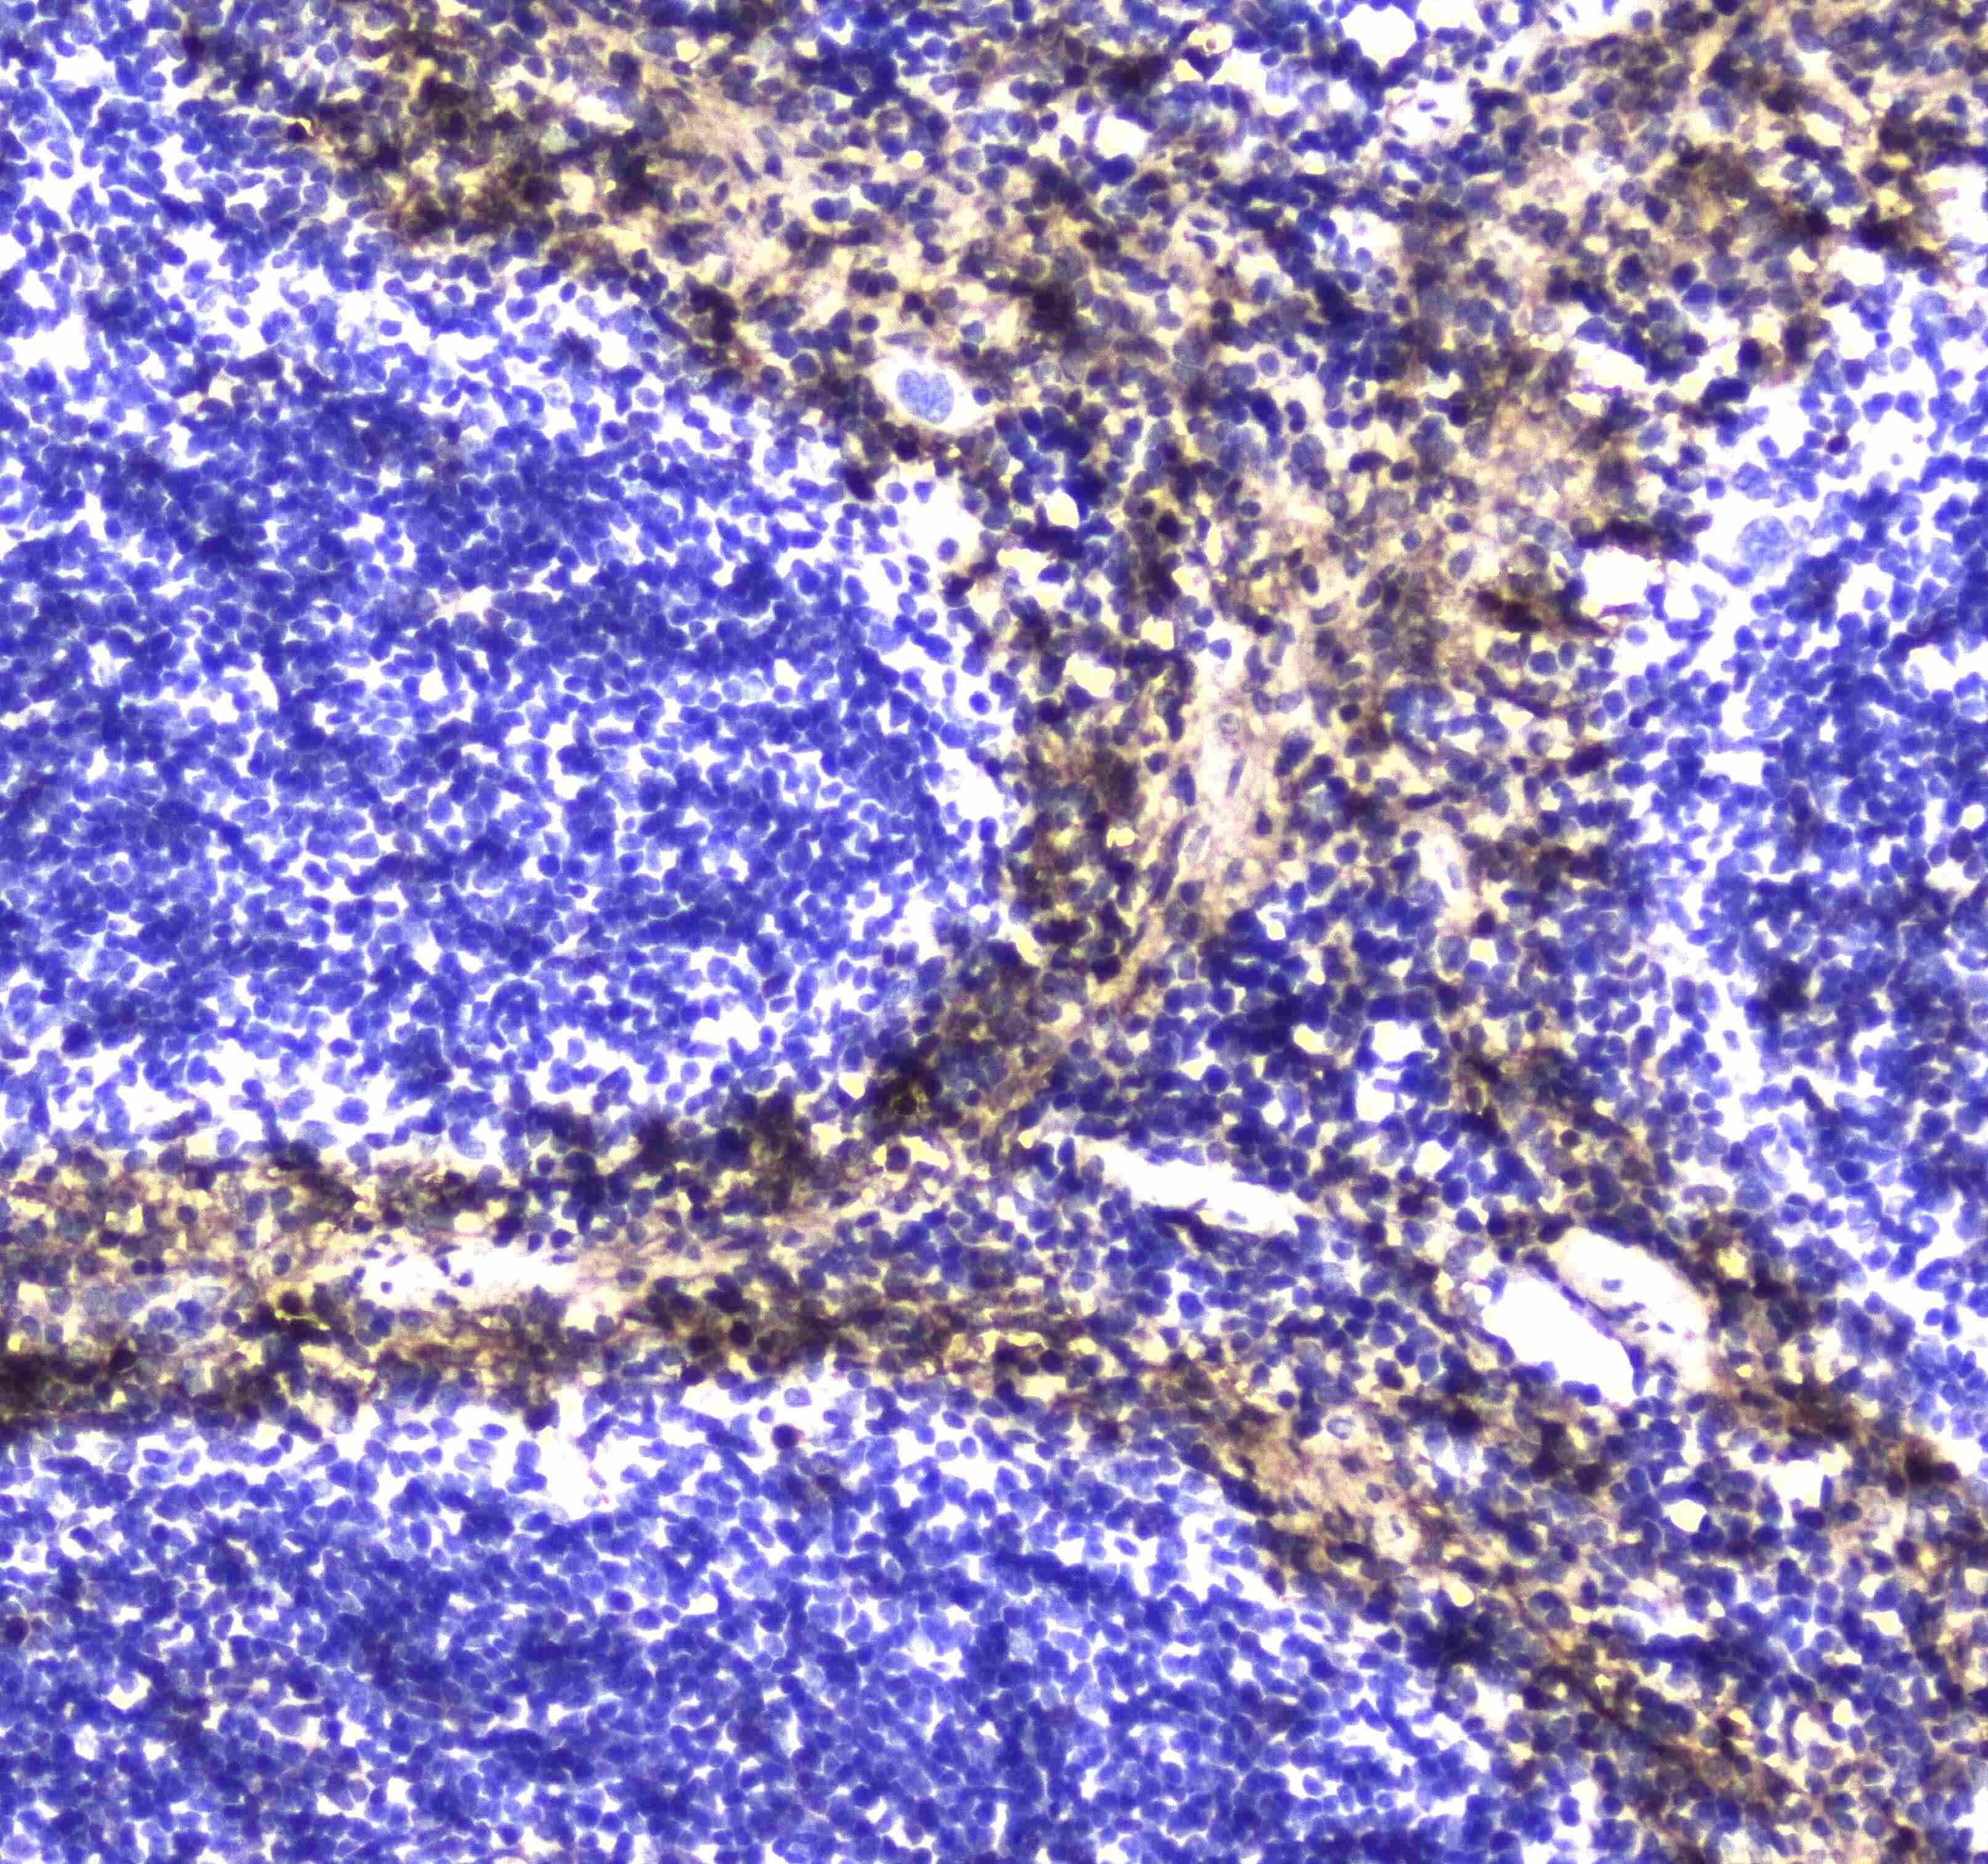
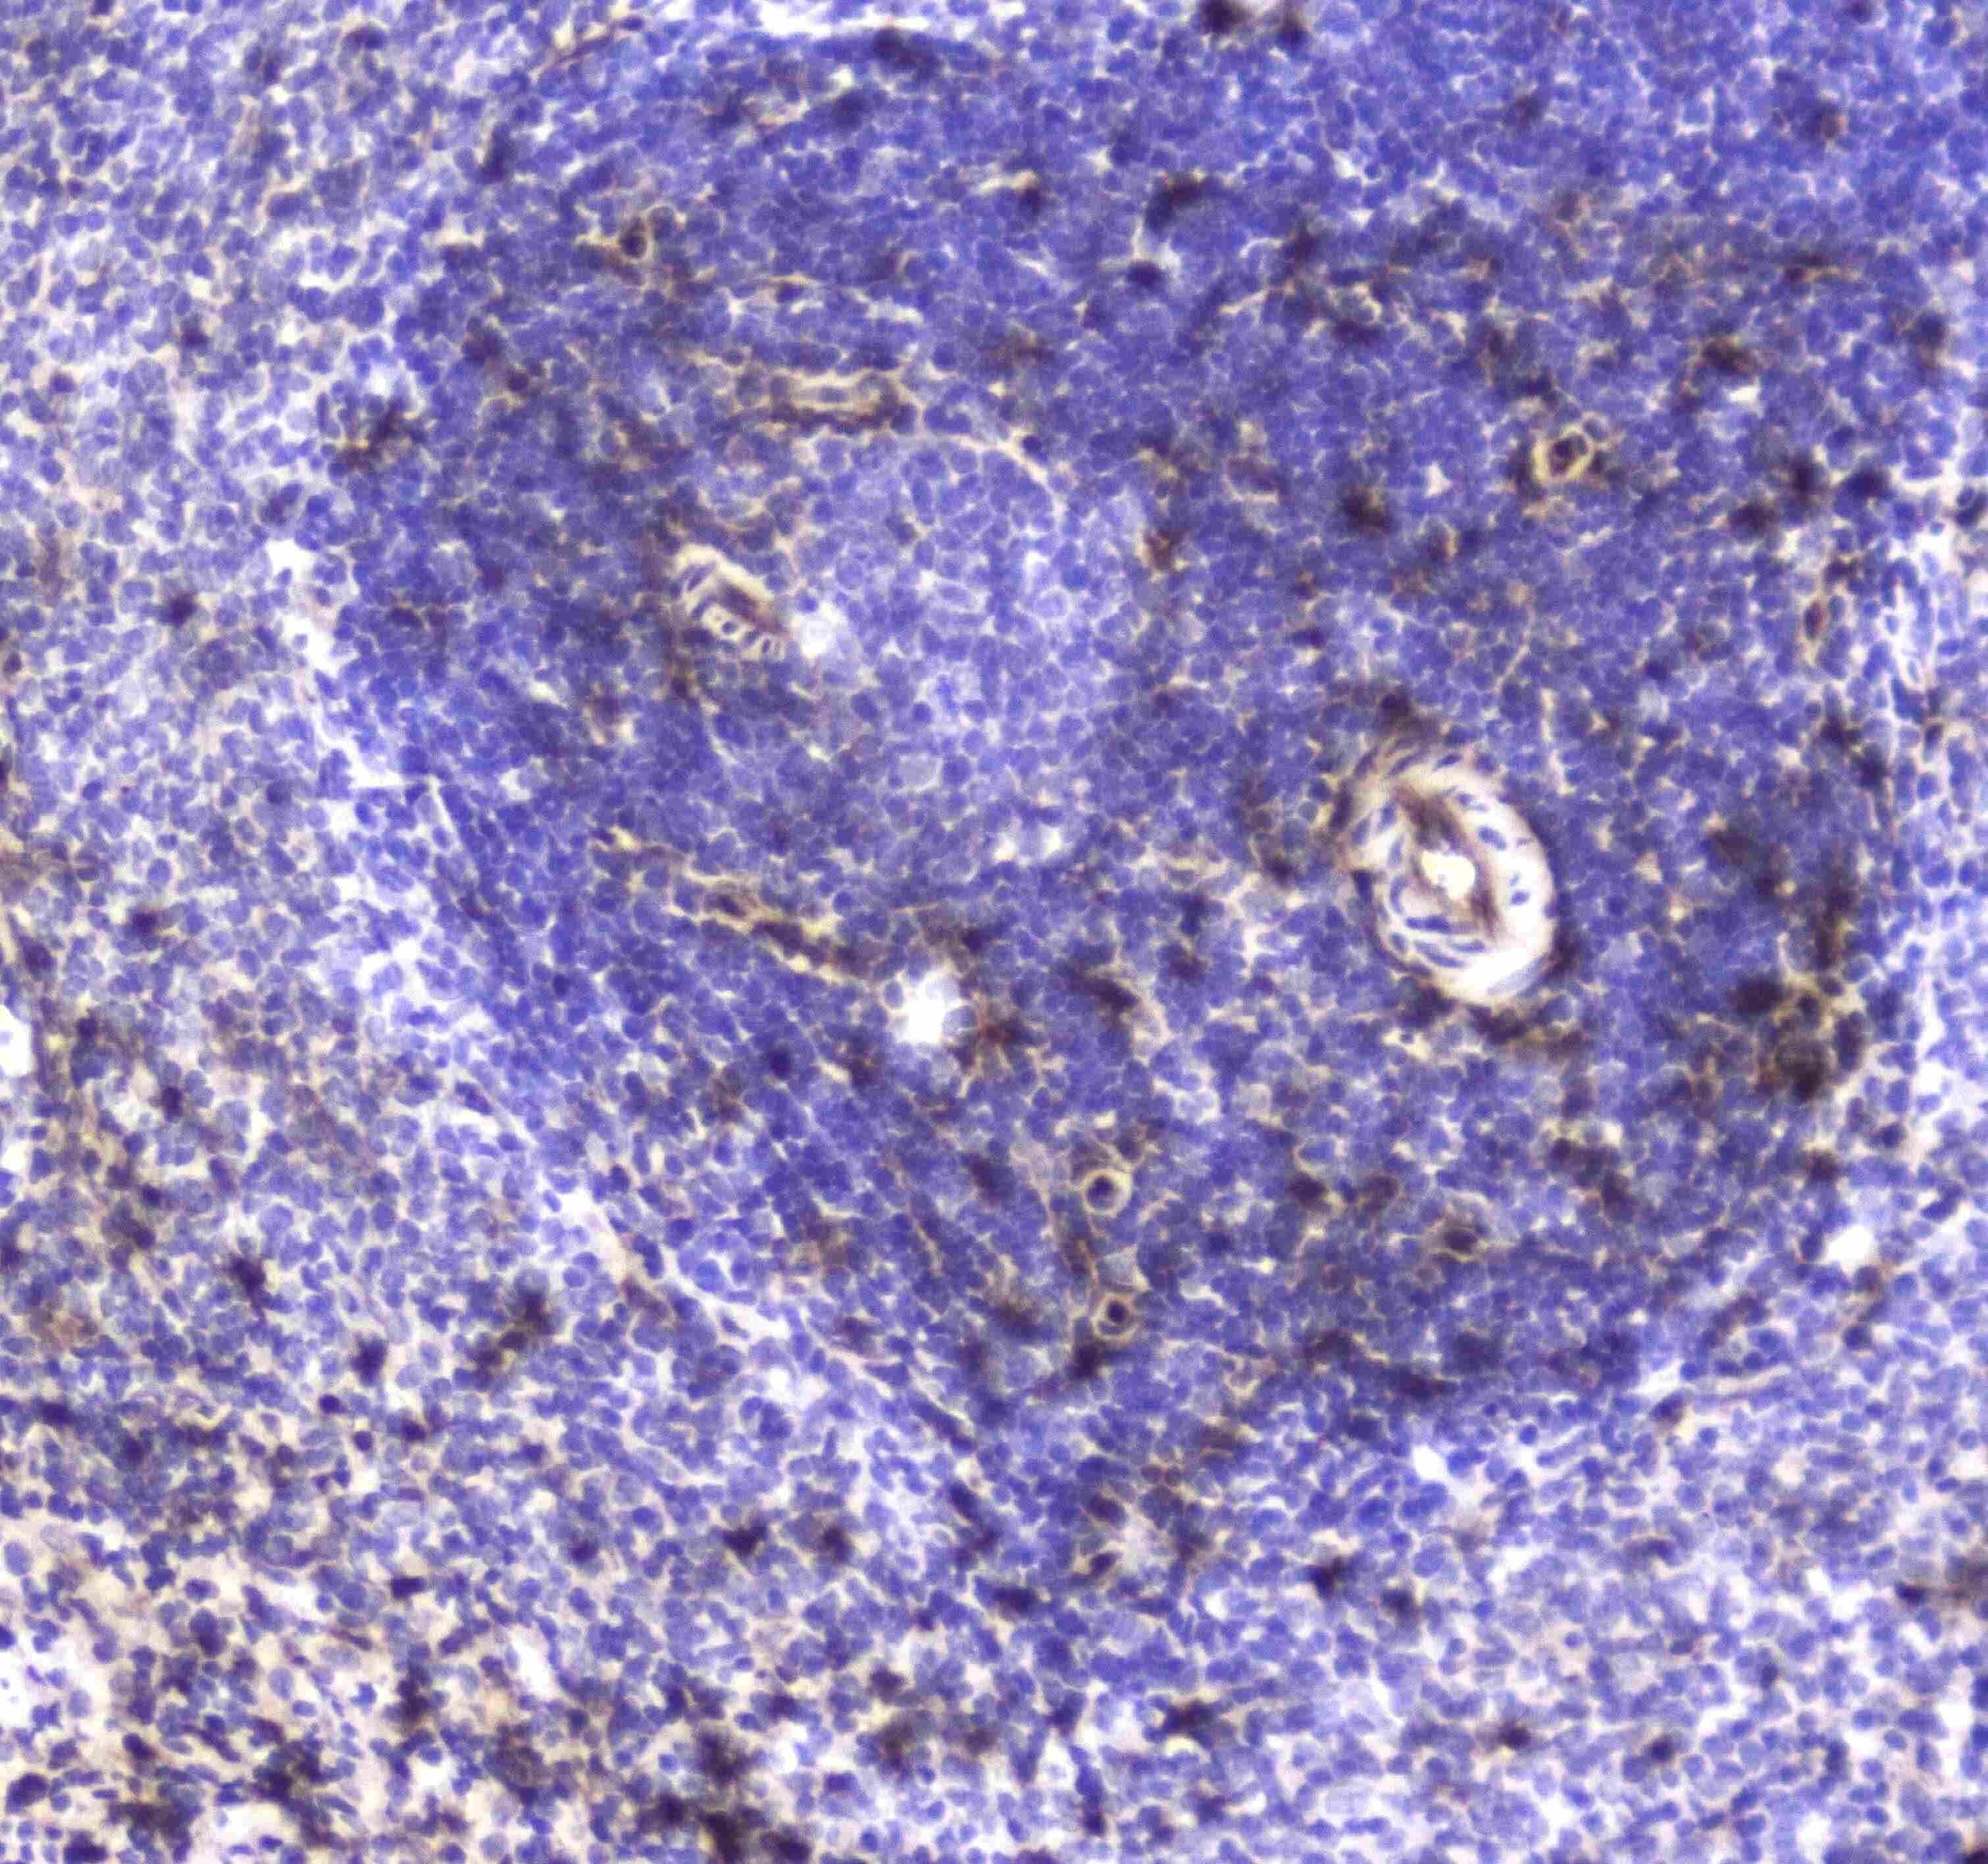
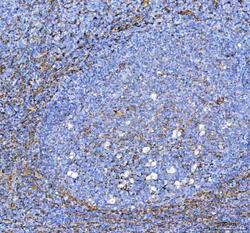
- Immunohistochemistry analysis of S100A10 in paraffin-embedded mouse spleen tissue. Antigen retrieval was performed on the tissue using citrate buffer (pH 6, 20 min) and blocked with 10% goat serum. Samples were incubated with S100A10 polyclonal antibody (Product # PA5-95505) at a 1 µg/mL dilution, followed by biotinylated goat anti-rabbit IgG (30 min, 37°C), and developed with Strepavidin-Biotin-Complex and DAB.
- Submitted by
- Invitrogen Antibodies (provider)
- Main image

- Experimental details
- Immunohistochemistry analysis of S100A10 in paraffin-embedded rat spleen tissue. Antigen retrieval was performed on the tissue using citrate buffer (pH 6, 20 min) and blocked with 10% goat serum. Samples were incubated with S100A10 polyclonal antibody (Product # PA5-95505) at a 1 µg/mL dilution, followed by biotinylated goat anti-rabbit IgG (30 min, 37°C), and developed with Strepavidin-Biotin-Complex and DAB.
- Submitted by
- Invitrogen Antibodies (provider)
- Main image
- Experimental details
- Immunohistochemistry (Paraffin) analysis of S100A10 in paraffin-embedded section of human tonsil tissue using S100A10 Polyclonal Antibody (Product # PA5-95505). Heat mediated antigen retrieval was performed in EDTA buffer (pH 8.0, epitope retrieval solution). The tissue section was blocked with 10% goat serum. The tissue section was then incubated with the primary antibody at a 2 µg/mL dilution overnight at 4°C. Peroxidase conjugated goat anti-rabbit IgG was used as secondary antibody and incubated for 30 minutes at 37°C. The tissue section was developed using HRP Conjugated Rabbit IgG Super Vision Assay Kit with DAB as the chromogen.

- Submitted by
- Invitrogen Antibodies (provider)
- Main image

- Experimental details
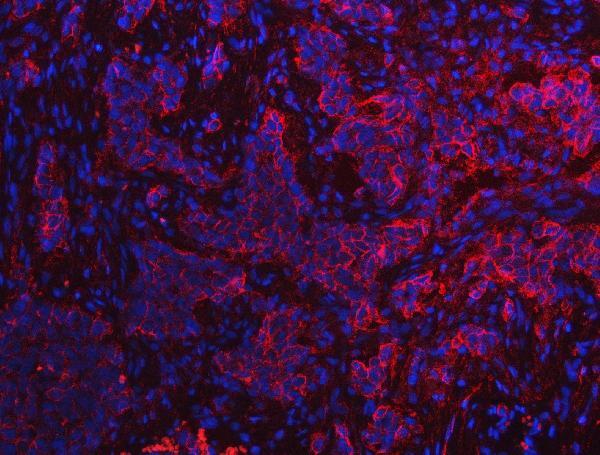
- Immunohistochemistry (Paraffin) analysis of S100A10 in paraffin-embedded section of human lung cancer tissue using S100A10 Polyclonal Antibody (Product # PA5-95505). Heat mediated antigen retrieval was performed in EDTA buffer (pH 8.0, epitope retrieval solution). The tissue section was blocked with 10% goat serum. The tissue section was then incubated with the primary antibody at a 5 µg/mL dilution overnight at 4°C. Cy3 conjugated goat anti-rabbit IgG was used as secondary antibody at 1:500 dilution and incubated for 30 minutes at 37°C. The section was counterstained with DAPI. Visualize using a fluorescence microscope and filter sets appropriate for the label used.
Supportive validation
- Submitted by
- Invitrogen Antibodies (provider)
- Main image
- Experimental details
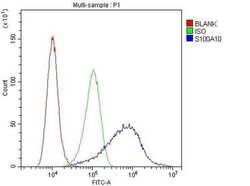
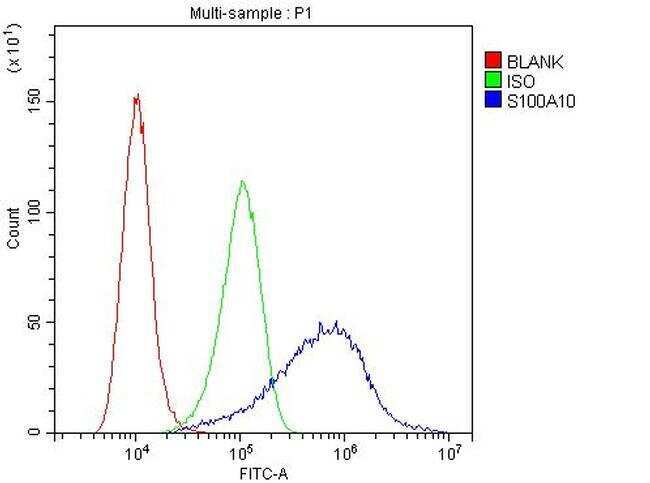
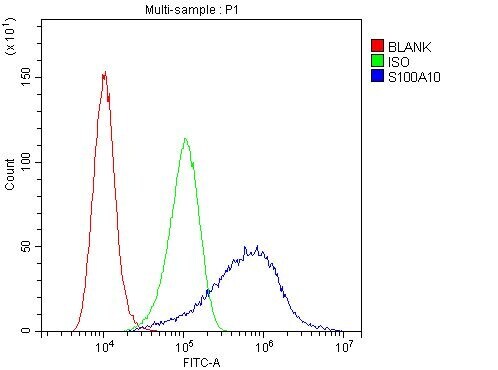
- Flow cytometry of S100A10 in A549 cells (blue line), isotype control rabbit IgG (green line) and unlabeled (red line). Samples were blocked with 10% goat serum, incubated with S100A10 polyclonal antibody (Product # PA5-95505) at a dilution of 1 µg (per 1x10^6 cells), followed by 488 conjugated goat anti-rabbit IgG (30 min at 20°C) using a 5-10 µg (per 1x10^6 cells) dilution.
- Submitted by
- Invitrogen Antibodies (provider)
- Main image

- Experimental details
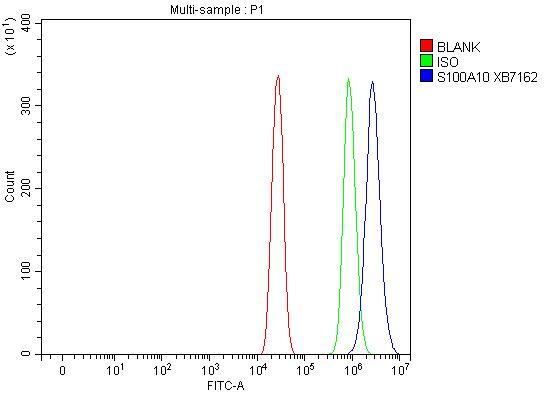
- Flow Cytometry of S100A10 in A431 cells (blue line), isotype control rabbit IgG (green line) and unlabeled (red line). Samples were blocked with 10% goat serum, incubated with S100A10 Polyclonal Antibody (Product # PA5-95505) at a dilution of 1 μg (per 1x10^6 cells), followed by DyLight®488 conjugated goat anti-rabbit IgG (for 30 minutes at 20°C) using 5-10 μg (per 1x10^6 cells) dilution.

- Submitted by
- Invitrogen Antibodies (provider)
- Main image
- Experimental details
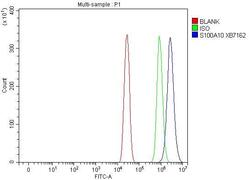
- Flow cytometry analysis of S100A10 in A431 cells using S100A10 Polyclonal Antibody (Product # PA5-95505), shown in overlay histogram (blue line). To facilitate intracellular staining, cells were fixed with 4% paraformaldehyde and permeabilized with permeabilization buffer. The cells were blocked with 10% normal goat serum, and incubated with the primary antibody (1 μg/1x10^6 cells) for 30 min at 20°C. DyLight 488 conjugated goat anti-rabbit IgG (5-10 µg/1x10^6 cells) was used as secondary antibody for 30 minutes at 20°C. Isotype control antibody (Green line) was rabbit IgG (1 µg/1x10^6) used under the same conditions. Unlabelled sample (Red line) was also used as a control.
- Submitted by
- Invitrogen Antibodies (provider)
- Main image

- Experimental details
- Flow Cytometry of S100A10 in A431 cells (blue line), isotype control rabbit IgG (green line) and unlabeled (red line). Samples were blocked with 10% goat serum, incubated with S100A10 Polyclonal Antibody (Product # PA5-95505) at a dilution of 1 μg (per 1x10^6 cells), followed by DyLight®488 conjugated goat anti-rabbit IgG (for 30 minutes at 20°C) using 5-10 μg (per 1x10^6 cells) dilution.
Supportive validation
- Submitted by
- Invitrogen Antibodies (provider)
- Main image
- Experimental details
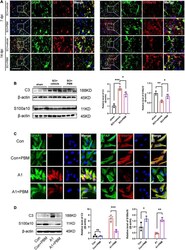
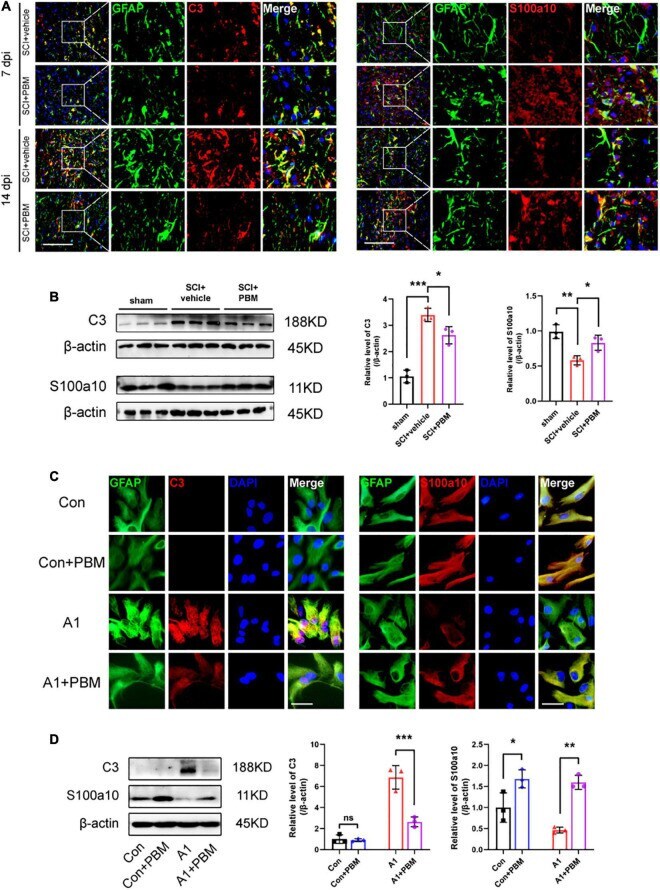
- FIGURE 3 Photobiomodulation modulated the transformation of A1/A2 astrocytes. (A) Representative images of immunofluorescence staining for GFAP (green) and C3 (red) or S100a10 (red) in the lesion area 150 mum from the epicenter in the SCI + vehicle and SCI + PBM groups at 7 and 14 dpi. Scale bar: 200 mum. (B) Western blot analysis and quantification of the expression levels of C3 and S100a10 in each group at 7 dpi ( n = 3 individuals per group). (C) Representative immunofluorescence images of GFAP (green) and C3 (red) or S100a10 (red) in astrocytes in the control, control + PBM, A1, and A1 + PBM groups. Con, control; A1, A1 astrocytes. Scale bar: 200 mm. (D) Representative blots and quantification of the expression levels of C3 and S100a10 in each group. The experiments were independently repeated three times. * p < 0.05, ** p < 0.01, *** p < 0.001.
- Submitted by
- Invitrogen Antibodies (provider)
- Main image
- Experimental details
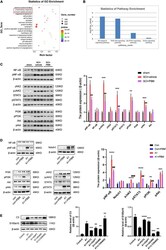
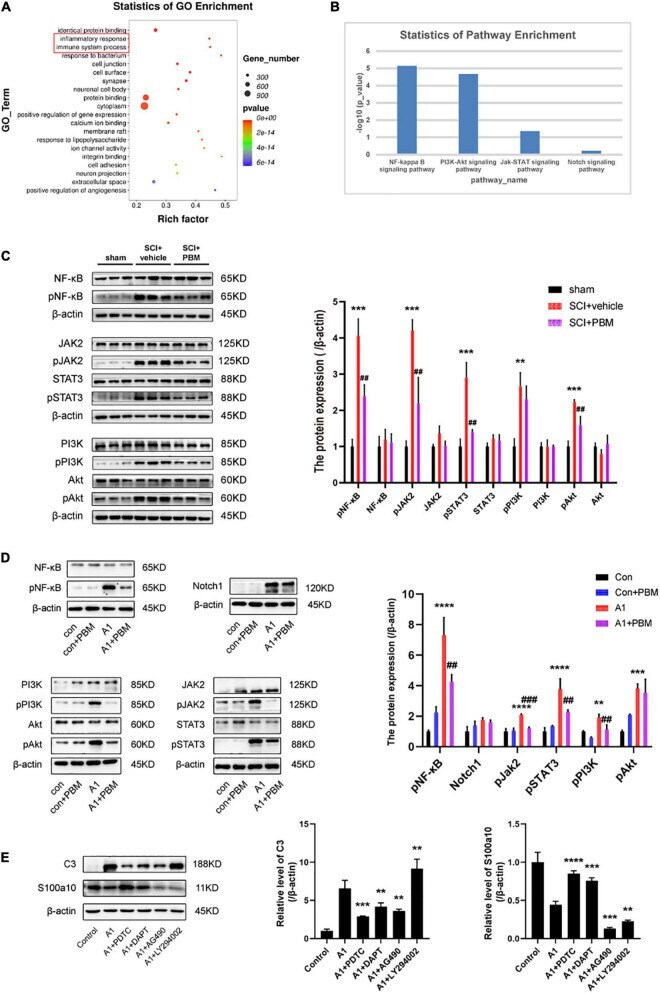
- FIGURE 4 Signaling pathways involved in A1/A2 astrocyte activation were regulated by PBM. (A) GO function analysis between the SCI-7d group and sham control group. The inflammatory response and immune system process were dramatically activated. (B) The histogram shows the -log10 ( p -value) of the NF-kappaB pathway, PI3K-Akt pathway, JAK-STAT pathway, and Notch pathway (comparison between multiple groups vs. the sham control group), as determined by KEGG enrichment analysis. (C) Western blot analysis of the expression of proteins related to the NF-kappaB signaling pathway, JAK2-STAT3 signaling pathway, and PI3K-Akt signaling pathway in the sham control, SCI + vehicle, and SCI + PBM groups at 7 dpi. Quantification of the relative protein levels of pNF-kappaB, NF-kappaB, pJAK2, JAK2, pSTAT3, STAT3, pPI3K, PI3K, pAkt, and Akt. n = 3 individuals per group. ** p < 0.01, *** p < 0.001, the SCI + vehicle group vs. the sham control group; ## p < 0.01, the SCI + PBM group vs. the SCI + vehicle group. (D) Representative blots and quantification of the relative levels of pNF-kappaB, NF-kappaB, Notch1, pJAK2, JAK2, pSTAT3, STAT3, pPI3K, PI3K, pAkt, and Akt in the control, control + PBM, A1, and A1 + PBM groups. Con, control; A1, A1 astrocytes. The experiments were independently repeated three times. ** p < 0.01, *** p < 0.001, **** p < 0.0001, the A1 group vs. the control group; ## p < 0.01, ### p < 0.001, the A1 + PBM group vs. the A1 group. (E) Representative blots and quantification o
- Submitted by
- Invitrogen Antibodies (provider)
- Main image
- Experimental details
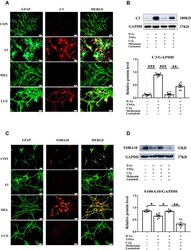
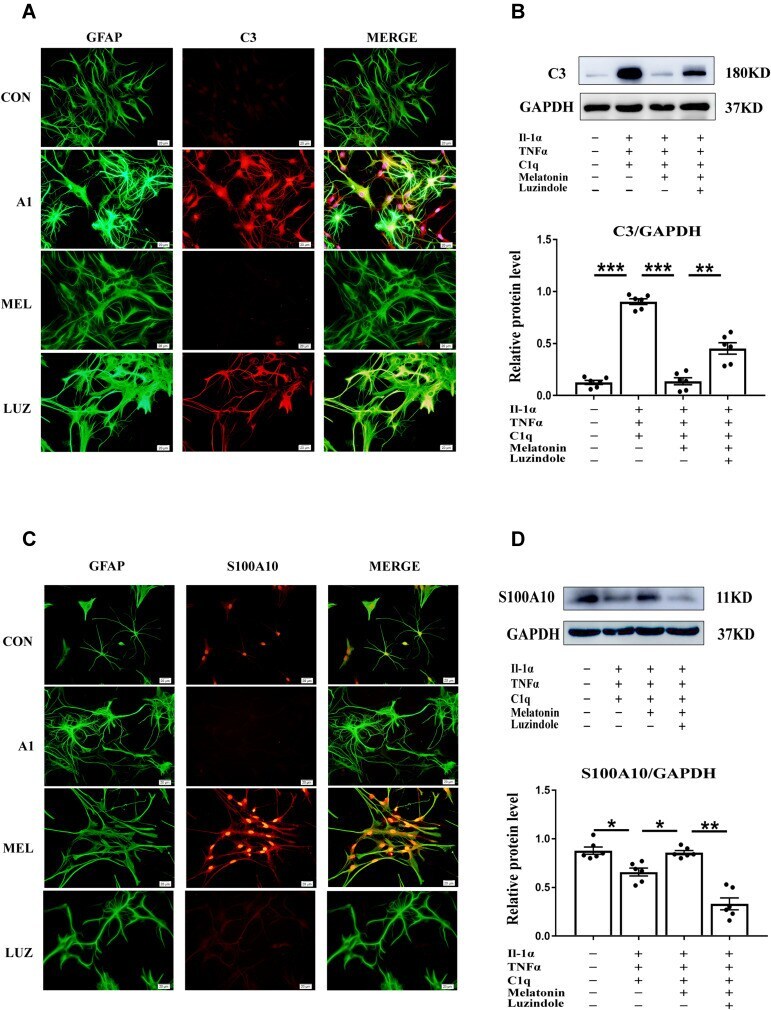
- Figure 6 Melatonin reversed the increased expression of C3, and decreased expression of S100A10 in primary astrocytes stimulated by IL-1alpha, TNF-alpha and C1q in vitro. After melatonin treatment and IL-1alpha, TNF-alpha and C1q exposure, the astrocytes were processed for immunofluorescence staining using primary antibodies GFAP (green), and anti-C3 (red) for A1 detection. Immunofluorescence images of cultured primary astrocytes showing the expression of GFAP and C3 at 24h after the treatment with IL-1alpha + C1q + TNF-alpha, IL-1alpha + C1q + TNF-alpha + melatonin and IL-1alpha + C1q + TNF-alpha + melatonin + luzindole when compared with the corresponding control ( A ). ( B ) Shows the optical density changes of C3 protein relative to GAPDH. A2 astrocytes were examined by immunofluorescence labeling using anti-GFAP (green) and A2 marker anti-S100A10 (red). Immunofluorescence images of cultured primary astrocytes showing expression of GFAP and S100A10 at 24h after treatment of IL-1alpha + C1q + TNF-alpha, IL-1alpha + C1q + TNF-alpha + melatonin, and IL-1alpha + C1q + TNF-alpha + luzindole when compared with the corresponding control ( C ). ( D ) Shows the optical density changes of S100A10 protein, relative to GAPDH. Scale bars: 20 mum. * P
- Submitted by
- Invitrogen Antibodies (provider)
- Main image
- Experimental details
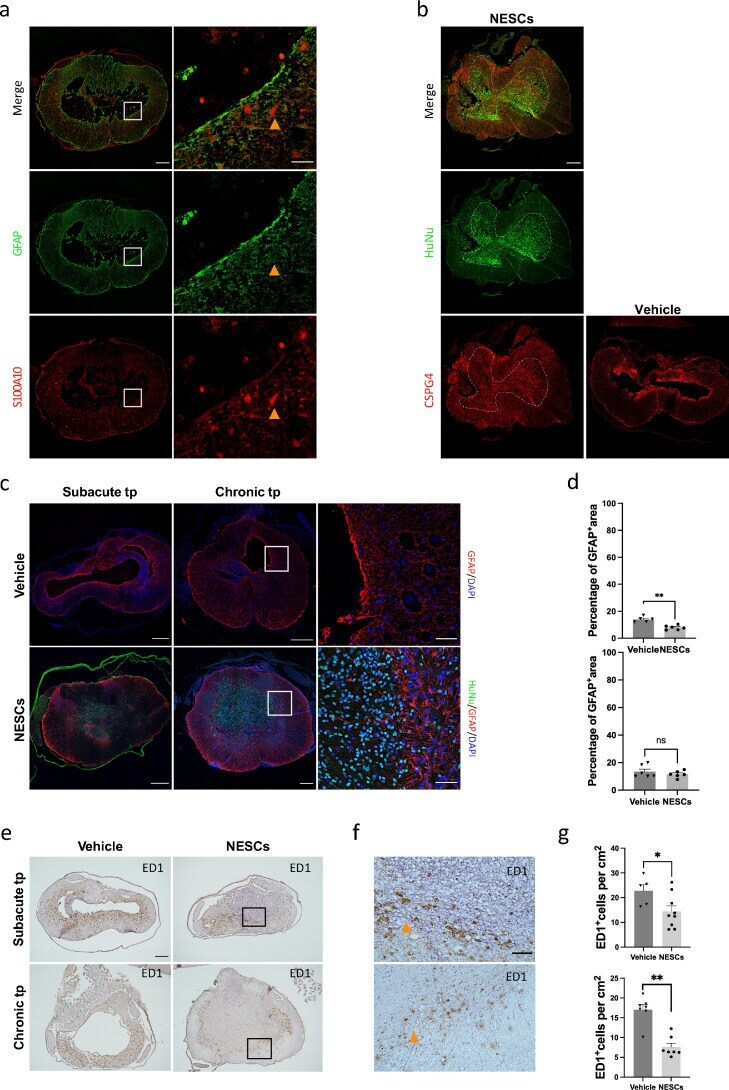
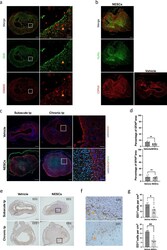
- Reactive astrocytes and scar-forming astrocytes were affected by transplanted NESCs. (a) Spinal cord sections of lesion sites from vehicle treated rats in chronic transplantation condition showing a large cyst surrounded by parenchyma stained for GFAP (green) and S100A10 (red). (b) Spinal cord sections of lesion site from vehicle and NESCs groups after chronic transplantation stained for HuNu (green), CSPG4 (red) and DAPI (blue). (c) Spinal cord sections of lesion sites stained for HuNu (green) and GFAP (red) from both vehicle and NESCs groups 10 weeks after subacute or chronic transplantation. (d) Quantification of the GFAP positive area to whole section of the experiment illustrated in b (mean +- SEM, two-tailed t-test, subacute: p < 0*01, n = 5 and 6 rats, respectively, chronic: no statistical significance, n = 6). (e) Spinal cord sections of lesion sites from vehicle and NESCs groups 10 weeks after subacute or chronic transplantation stained for ED1. (f) Magnified image of the boxed area in e. (g) Quantification of ED1 positive cells 10 weeks after subacute or chronic transplantation as described in E (mean +- SEM, two-tailed t-test, subacute: p < 0*05, n = 5 and 9 rats, respectively, chronic: p < 0*05, n = 7 rats per group). Section thickness = 10 um. Figure5