Explore
 Validate
 Learn
Learn Western blot
 ELISA
ELISA Immunohistochemistry
Antibody data
- Antibody Data
- Antigen structure
- References [1]
- Comments [0]
- Validations
- Immunohistochemistry [1]
- Other assay [1]
Submit
Validation data
Reference
Comment
Report error
- Product number
- MA5-35243 - Provider product page

- Provider
- Invitrogen Antibodies
- Product name
- ITGA2 Recombinant Rabbit Monoclonal Antibody (7O9H6)
- Antibody type
- Monoclonal
- Antigen
- Synthetic peptide
- Description
- Immunogen sequence: GTFASSTFQT VQLTAAAEIN TYNPEIYVIE DNTVTIPLMI MKPDEKAEVP TGVIIGSIIA GILLLLALVA ILWKLGFFKR KYEKMTKNPD EIDETTELSS
- Reactivity
- Human, Mouse, Rat
- Host
- Rabbit
- Isotype
- IgG
- Antibody clone number
- 7O9H6
- Vial size
- 100 μL
- Concentration
- 0.8 mg/mL
- Storage
- -20°C, Avoid Freeze/Thaw Cycles
Submitted references Global miRNA/proteomic analyses identify miRNAs at 14q32 and 3p21, which contribute to features of chronic iron-exposed fallopian tube epithelial cells.
Chhabra R, Rockfield S, Guergues J, Nadeau OW, Hill R, Stevens SM Jr, Nanjundan M
Scientific reports 2021 Mar 18;11(1):6270
Scientific reports 2021 Mar 18;11(1):6270
No comments: Submit comment
Supportive validation
- Submitted by
- Invitrogen Antibodies (provider)
- Main image
- Experimental details
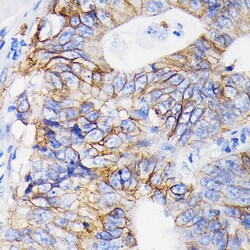
- Immunohistochemistry analysis of ITGA2 in paraffin-embedded human colon carcinoma. Samples were incubated with ITGA2 Monoclonal antibody (Product # MA5-35243) using a dilution of 1:100 (40x lens). Perform microwave antigen retrieval with 10 mM PBS buffer pH 7.2 before commencing with IHC staining protocol.

Supportive validation
- Submitted by
- Invitrogen Antibodies (provider)
- Main image
- Experimental details
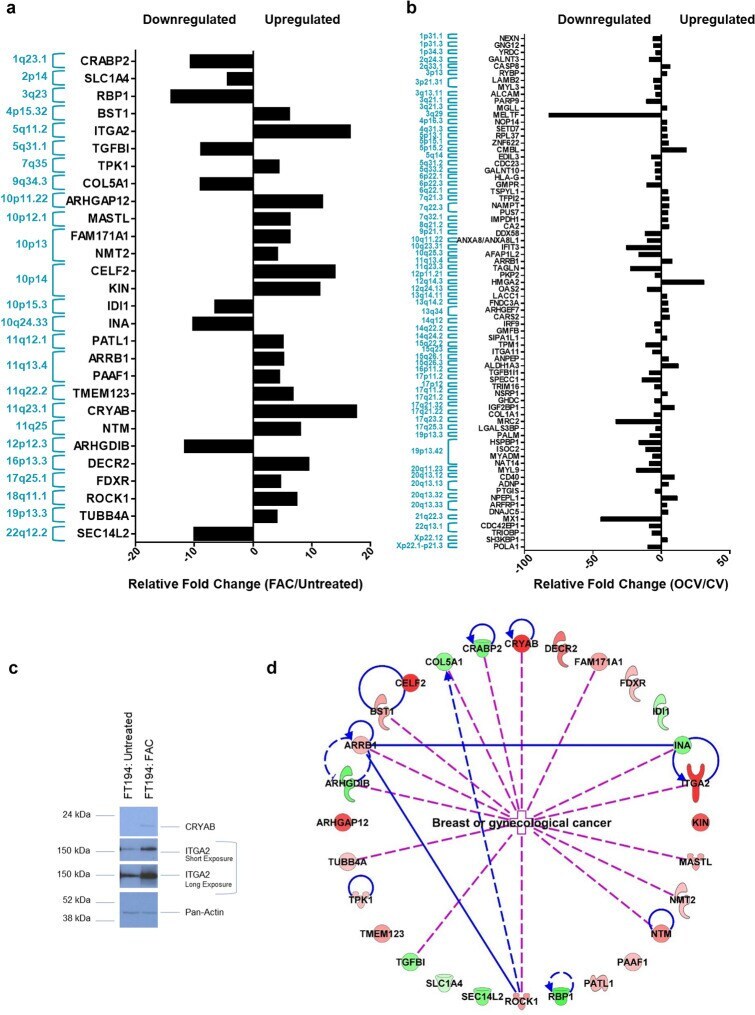
- Figure 4 Protein targets and their genomic locations associated with top miRNAs altered in FT194 cells. These graphs show the protein targets associated with highly dysregulated miRNAs in FT194 cells, as determined by IPA analysis. Protein targets with > fourfold change, corresponding to the miRNAs, were compiled and organized by their genomic locations. Relative fold change of these protein targets has been represented for ( a ) 250 nM FAC-treated FT194 cells compared to Untreated, and ( b ) transformed OCV cells compared to CV cells. ( c ) Western Blotting analysis of 250 nM FAC-exposed and Untreated FT194 cells, using cell lysates collected at day 170 of FAC treatment ( p = 52). Three independent replicates were performed; representative cropped blots are displayed. White space between cropped blots delineate different antibody applications to the same blot. The full-length uncropped blots are displayed in the Supplementary Information File. ( d ) Top 28 protein targets altered in gynecological cancers, with > fourfold change, identified for 250 nM FAC-treated FT194 cells compared to Untreated. Upregulated proteins are shown in red and downregulated proteins in green, ranging color intensity based on the fold change associated with each. The detailed legend for all molecular processes in the protein network is included in tabular form in supplementary Fig. S6 .