 Explore
 Validate
 Learn
Learn Flow cytometry
Antibody data
- Antibody Data
- Antigen structure
- References [7]
- Comments [0]
- Validations
- Flow cytometry [1]
- Other assay [3]
Submit
Validation data
Reference
Comment
Report error
- Product number
- 12-1038-42 - Provider product page

- Provider
- Invitrogen Antibodies
- Product name
- CD103 (Integrin alpha E) Monoclonal Antibody (B-Ly7), PE, eBioscience™
- Antibody type
- Monoclonal
- Antigen
- Other
- Description
- Description: The B-Ly7 monoclonal antibody reacts with human CD103, the alpha E integrin. CD103 non-covalently associates with integrin beta 7. CD103 is expressed mainly on intraepithelial lymphocytes and a small subset of peripheral lymphocytes. CD103 is also expressed by hairy cell leukemia (HCL) and by some chronic B cell lymphocytic leukemias. In vitro stimulation of human T cells with mitogens induces upregulation of CD103. Epithelial cell antigen, E-cadherin, binds to CD103 and mediates homing of lymphocytes to the intestinal epithelium. Applications Reported: B-Ly7 has been reported for use in flow cytometric analysis. Applications Tested: This B-Ly7 antibody has been pre-titrated and tested by flow cytometric analysis of stimulated normal human peripheral blood cells. This can be used at 5 µL (0.25 µg) per test. A test is defined as the amount (µg) of antibody that will stain a cell sample in a final volume of 100 µL. Cell number should be determined empirically but can range from 10^5 to 10^8 cells/test. Excitation: 488-561 nm; Emission: 578 nm; Laser: Blue Laser, Green Laser, Yellow-Green Laser. Filtration: 0.2 µm post-manufacturing filtered.
- Reactivity
- Human
- Host
- Mouse
- Conjugate
- Yellow dye
- Isotype
- IgG
- Antibody clone number
- B-Ly7
- Vial size
- 100 Tests
- Concentration
- 5 µL/Test
- Storage
- 4° C, store in dark, DO NOT FREEZE!
Submitted references Neoadjuvant anti-OX40 (MEDI6469) therapy in patients with head and neck squamous cell carcinoma activates and expands antigen-specific tumor-infiltrating T cells.
Distinct epigenetic features of tumor-reactive CD8+ T cells in colorectal cancer patients revealed by genome-wide DNA methylation analysis.
Co-expression of CD39 and CD103 identifies tumor-reactive CD8 T cells in human solid tumors.
Evidence for Resident Memory T Cells in Rasmussen Encephalitis.
CD1c-Expression by Monocytes - Implications for the Use of Commercial CD1c+ Dendritic Cell Isolation Kits.
RSV-specific airway resident memory CD8+ T cells and differential disease severity after experimental human infection.
Norwalk virus does not replicate in human macrophages or dendritic cells derived from the peripheral blood of susceptible humans.
Duhen R, Ballesteros-Merino C, Frye AK, Tran E, Rajamanickam V, Chang SC, Koguchi Y, Bifulco CB, Bernard B, Leidner RS, Curti BD, Fox BA, Urba WJ, Bell RB, Weinberg AD
Nature communications 2021 Feb 16;12(1):1047
Nature communications 2021 Feb 16;12(1):1047
Distinct epigenetic features of tumor-reactive CD8+ T cells in colorectal cancer patients revealed by genome-wide DNA methylation analysis.
Yang R, Cheng S, Luo N, Gao R, Yu K, Kang B, Wang L, Zhang Q, Fang Q, Zhang L, Li C, He A, Hu X, Peng J, Ren X, Zhang Z
Genome biology 2019 Dec 31;21(1):2
Genome biology 2019 Dec 31;21(1):2
Co-expression of CD39 and CD103 identifies tumor-reactive CD8 T cells in human solid tumors.
Duhen T, Duhen R, Montler R, Moses J, Moudgil T, de Miranda NF, Goodall CP, Blair TC, Fox BA, McDermott JE, Chang SC, Grunkemeier G, Leidner R, Bell RB, Weinberg AD
Nature communications 2018 Jul 13;9(1):2724
Nature communications 2018 Jul 13;9(1):2724
Evidence for Resident Memory T Cells in Rasmussen Encephalitis.
Owens GC, Chang JW, Huynh MN, Chirwa T, Vinters HV, Mathern GW
Frontiers in immunology 2016;7:64
Frontiers in immunology 2016;7:64
CD1c-Expression by Monocytes - Implications for the Use of Commercial CD1c+ Dendritic Cell Isolation Kits.
Schrøder M, Melum GR, Landsverk OJ, Bujko A, Yaqub S, Gran E, Aamodt H, Bækkevold ES, Jahnsen FL, Richter L
PloS one 2016;11(6):e0157387
PloS one 2016;11(6):e0157387
RSV-specific airway resident memory CD8+ T cells and differential disease severity after experimental human infection.
Jozwik A, Habibi MS, Paras A, Zhu J, Guvenel A, Dhariwal J, Almond M, Wong EHC, Sykes A, Maybeno M, Del Rosario J, Trujillo-Torralbo MB, Mallia P, Sidney J, Peters B, Kon OM, Sette A, Johnston SL, Openshaw PJ, Chiu C
Nature communications 2015 Dec 21;6:10224
Nature communications 2015 Dec 21;6:10224
Norwalk virus does not replicate in human macrophages or dendritic cells derived from the peripheral blood of susceptible humans.
Lay MK, Atmar RL, Guix S, Bharadwaj U, He H, Neill FH, Sastry KJ, Yao Q, Estes MK
Virology 2010 Oct 10;406(1):1-11
Virology 2010 Oct 10;406(1):1-11
No comments: Submit comment
Supportive validation
- Submitted by
- Invitrogen Antibodies (provider)
- Main image

- Experimental details
- Staining of PHA-stimulated normal human peripheral blood cells with Mouse IgG1 K Isotype Control PE (Product # 12-4714-81) (blue histogram) or Anti-Human CD103 (Integrin alpha E) PE (purple histogram). Total viable cells were used for analysis.
- Conjugate
- Yellow dye

Supportive validation
- Submitted by
- Invitrogen Antibodies (provider)
- Main image
- Experimental details
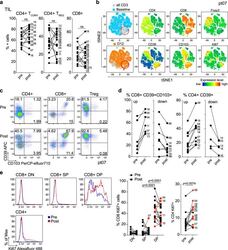
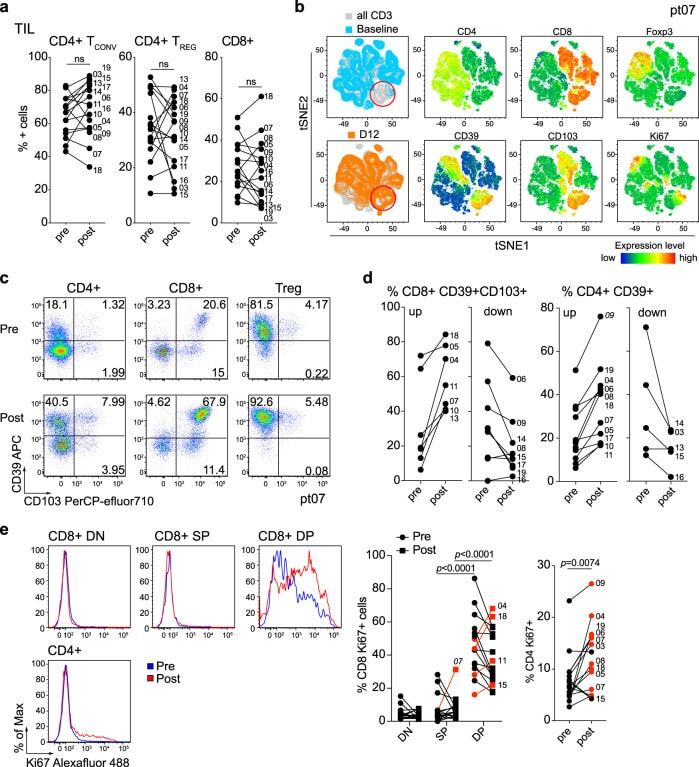
- Fig. 2 Changes in TIL composition after OX40 administration. TIL from a pretreatment biopsy and a surgical specimen after OX40 therapy were assessed for lymphocyte composition and activation markers. The gating strategy is outlined in Supplementary Fig. 3 . a Percentages of CD4+ Tconv cells, CD4+ Treg cells, and CD8+ T cells in each patient before and after OX40 administration, N = 17 patients. b tSNE analysis of the pre and post specimens from patient HNOX07, gated on CD3+ cells. Blue represents the baseline sample, orange the day of surgery sample and gray is the concatenated file. The red circle indicates the population of cells expressing both CD103 and CD39. tSNE analysis was performed on N = 4 patients, one representative patient is shown here, two more patients are shown in Supplementary Fig. 4 . c Flow cytometric analysis of the expression of CD103 and CD39 in CD4+ Tconv cells, CD8+ cells, and CD4+ Treg cells in one immune-responding head and neck squamous cell carcinoma (HNSCC) patient pre- and post OX40 therapy. d Summary of the flow cytometric analysis in (c), left panel depicts CD8+ CD103+ CD39+ T cells and the right panel depicts CD4+ CD39+ T cells; patients with an increase are shown on the left, patients with a decrease are on the right. e Expression of Ki-67 was assessed among memory CD4+ TIL and CD8+ TIL subsets (DN, SP, and DP) in biopsy (pre) and DOS (post) tissue ( N = 17 patients). Blue histograms indicate pre, red indicate post tissues. The left graph sh
- Conjugate
- Yellow dye
- Submitted by
- Invitrogen Antibodies (provider)
- Main image
- Experimental details
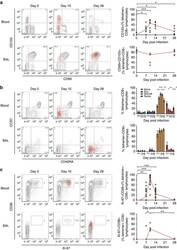
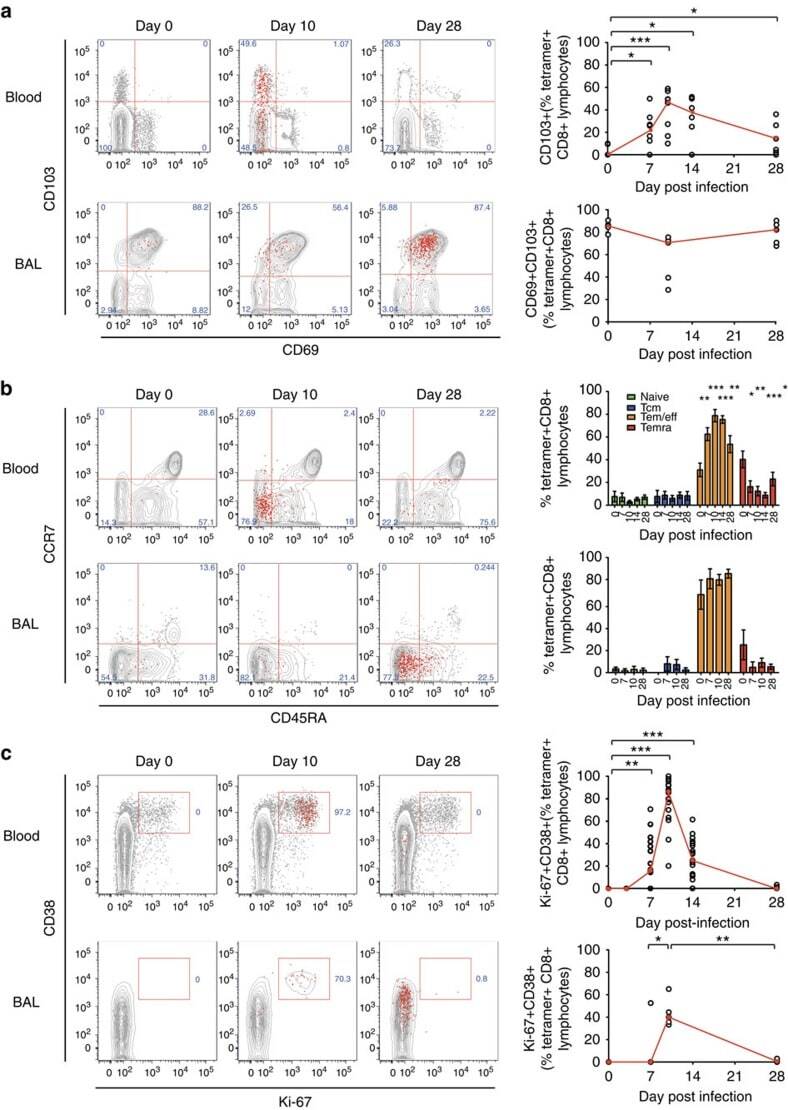
- Figure 6 RSV-specific CD8+ T cells in BAL display a distinctive resident memory phenotype. Tetramer+ CD8+ T cells in blood and BAL were co-stained for markers to assess their differentiation status. ( a ) CD69 and CD103 as canonical markers of resident memory CD8+ T cells are shown in blood ( n =9) and BAL ( n =5) from infected volunteers. Significant P values for two-tailed Wilcoxon matched pairs tests in blood compared with baseline are shown (day 7, P =0.0313; day 10, P =0.0039; day 14, P =0.0313; and day 28, P =0.0313). ( b ) Memory markers CD45RA and CCR7 are shown in blood ( n =19) and BAL ( n =8). Mean+-significant P values for two-tailed Wilcoxon matched pairs tests compared with baseline are shown in blood for T-effector/effector memory cells (day 7, P =0.0034; day 10, P =0.0002; day 14, P =0.0002; day 28, P =0.0067) and effector memory T cells re-expressing CD45RA (day 7, P =0.0443; day 10, P =0.0025; day 14, P =0.0003; day 28, P =0.0135). ( c ) Proliferation and activation markers Ki-67 and CD38 are shown in blood ( n =19) and BAL ( n =8). Significant P values for two-tailed Wilcoxon matched pairs tests are shown compared with baseline in blood (day 7, P =0.0025; day 10, P =0.0001; and day 14, P =0.0005) and BAL (day 7 versus day 10, P =0.0444; and day 10 versus day 28, P =0.0022 as no Ki-67+CD38+ cells were found in any baseline samples). Throughout, representative plots from a single subject at day 0, 10 and 28 post infection are shown with tetramer+ cells as red
- Conjugate
- Yellow dye
- Submitted by
- Invitrogen Antibodies (provider)
- Main image

- Experimental details
- Fig. 1 Comparative transcriptional analysis reveals tumor-reactive CD8+ T cells to have a T RM signature with high expression of exhaustion markers. a Experimental design for the isolation of different CD8+ T cell populations from CRC patients. b , c Representative plots of FACS-isolated T cell populations. d Gene expression heat map of five CD8+ T cell populations. Rows represent signature genes, and columns represent cell types. Selective specifically expressed genes are marked in red. e GSVA was performed to identify enriched significant biological pathways in five CD8+ T cell subtypes. Five gene sets for each T cell population are depicted in a heat map. f PCA analysis of transcriptome expression of five CD8+ T cell populations. Each symbol represents one patient. g Volcano plot showing differential gene expression of CD103+CD39+ T cells vs. CD103-CD39- T cells (log2-transformed). Each red dot denotes an individual gene with a false-discovery rate (FDR) < 0.05. h Enrichment plot for the gene sets of ""T cell exhaustion"" and ""T RM "" in the transcriptome of CD103+CD39+ T cells vs. that of CD103-CD39- T cells by GSEA. NES, normalized enrichment score
- Conjugate
- Yellow dye
