Explore
 Validate
 Learn
Learn Western blot
Antibody data
- Antibody Data
- Antigen structure
- References [55]
- Comments [0]
- Validations
- Western blot [1]
- Immunocytochemistry [2]
- Other assay [22]
Submit
Validation data
Reference
Comment
Report error
- Product number
- 14-9966-95 - Provider product page

- Provider
- Invitrogen Antibodies
- Product name
- Gata-3 Monoclonal Antibody (TWAJ), eBioscience™
- Antibody type
- Monoclonal
- Antigen
- Other
- Description
- Description: The monoclonal antibody TWAJ recognizes mouse and human Gata-3, a member of the Gata family of transcription factors. Gata-3 is a T cell-specific transcription factor important for thymic development and Th2 differentiation. Expression during embryonic development is found in the central nervous system, skin, mammary glands and kidney. During development, the expression of Gata-3 is essential as homozygous knock-out of Gata-3 is embryonic lethal. The Gata-3 is also essential for T cell commitment and survival. In the thymus, expression is found mainly on the CD4 single positive cells. During Th2 differentiation, Gata-3 binds to the IL-4 promoter as well as represses the expression of T-bet, thus inhibiting Th1 differentiation.
- Antibody clone number
- TWAJ
- Concentration
- 0.5 mg/mL
Submitted references Graded RhoA GTPase Expression in Treg Cells Distinguishes Tumor Immunity From Autoimmunity.
Effector T cell responses unleashed by regulatory T cell ablation exacerbate oral squamous cell carcinoma.
A coordinated progression of progenitor cell states initiates urinary tract development.
CD8(+) T cells inhibit metastasis and CXCL4 regulates its function.
Histone deacetylase 3 represses cholesterol efflux during CD4(+) T-cell activation.
In Situ Characterization of Follicular Helper CD4 T Cells Using Multiplexed Imaging.
The obesity-induced adipokine sST2 exacerbates adipose T(reg) and ILC2 depletion and promotes insulin resistance.
Intestinal vitamin D receptor knockout protects from oxazolone-induced colitis.
Attenuation of TCR-induced transcription by Bach2 controls regulatory T cell differentiation and homeostasis.
Cell Types Promoting Goosebumps Form a Niche to Regulate Hair Follicle Stem Cells.
Perturbed myoepithelial cell differentiation in BRCA mutation carriers and in ductal carcinoma in situ.
Compartmentalized gut lymph node drainage dictates adaptive immune responses.
IL-33-mediated mast cell activation promotes gastric cancer through macrophage mobilization.
CD4(+) T Cell Fate Decisions Are Stochastic, Precede Cell Division, Depend on GITR Co-Stimulation, and Are Associated With Uropodium Development.
Mass cytometry reveals innate lymphoid cell differentiation pathways in the human fetal intestine.
IgE promotes type 2 innate lymphoid cells in murine food allergy.
Tissue-Restricted Adaptive Type 2 Immunity Is Orchestrated by Expression of the Costimulatory Molecule OX40L on Group 2 Innate Lymphoid Cells.
Fas ligand promotes an inducible TLR-dependent model of cutaneous lupus-like inflammation.
Flt3 ligand expands bona fide innate lymphoid cell precursors in vivo.
Oxysterol Sensing through the Receptor GPR183 Promotes the Lymphoid-Tissue-Inducing Function of Innate Lymphoid Cells and Colonic Inflammation.
Stabilization of cytokine mRNAs in iNKT cells requires the serine-threonine kinase IRE1alpha.
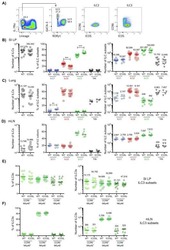
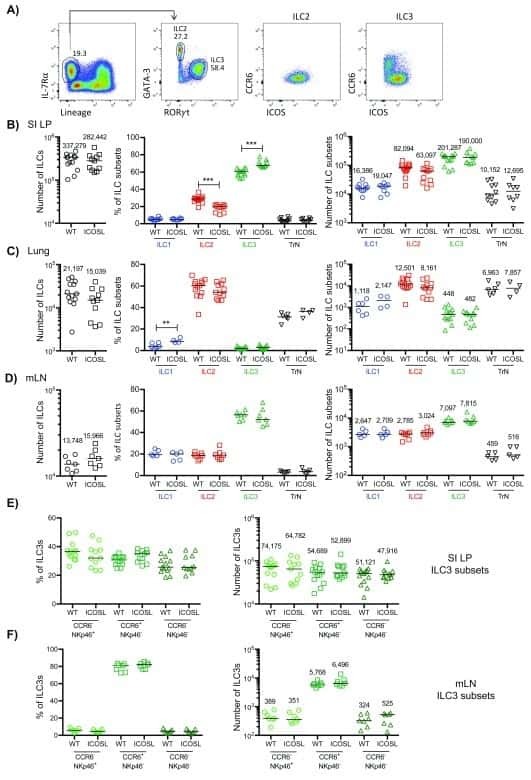
Characterisation of innate lymphoid cell populations at different sites in mice with defective T cell immunity.
Protein kinase CK2 controls T-cell polarization through dendritic cell activation in response to contact sensitizers.
NLRP3 signaling drives macrophage-induced adaptive immune suppression in pancreatic carcinoma.
PD-1 regulates KLRG1(+) group 2 innate lymphoid cells.
Stability and function of regulatory T cells expressing the transcription factor T-bet.
Dissection of SAP-dependent and SAP-independent SLAM family signaling in NKT cell development and humoral immunity.
NK cells regulate CXCR2+ neutrophil recruitment during acute lung injury.
An asthma-associated IL4R variant exacerbates airway inflammation by promoting conversion of regulatory T cells to TH17-like cells.
FOXP3+ Tregs require WASP to restrain Th2-mediated food allergy.
Phenotypic and functional characterization of the major lymphocyte populations in the fruit-eating bat Pteropus alecto.
Group 2 innate lymphoid cells utilize the IRF4-IL-9 module to coordinate epithelial cell maintenance of lung homeostasis.
Deletion of 5-Lipoxygenase in the Tumor Microenvironment Promotes Lung Cancer Progression and Metastasis through Regulating T Cell Recruitment.
Monocyte-Derived Dendritic Cells Promote Th Polarization, whereas Conventional Dendritic Cells Promote Th Proliferation.
Conditions for the generation of cytotoxic CD4(+) Th cells that enhance CD8(+) CTL-mediated tumor regression.
Ndfip-mediated degradation of Jak1 tunes cytokine signalling to limit expansion of CD4+ effector T cells.
Intranasal Administration of Lentiviral miR-135a Regulates Mast Cell and Allergen-Induced Inflammation by Targeting GATA-3.
Chronic Trichuris muris Infection in C57BL/6 Mice Causes Significant Changes in Host Microbiota and Metabolome: Effects Reversed by Pathogen Clearance.
The long intergenic noncoding RNA landscape of human lymphocytes highlights the regulation of T cell differentiation by linc-MAF-4.
Retinoic Acid Differentially Regulates the Migration of Innate Lymphoid Cell Subsets to the Gut.
CCR7-dependent trafficking of RORγ⁺ ILCs creates a unique microenvironment within mucosal draining lymph nodes.
The AGC kinase SGK1 regulates TH1 and TH2 differentiation downstream of the mTORC2 complex.
Differential requirement for Nfil3 during NK cell development.
Cutting edge: Failure of antigen-specific CD4+ T cell recruitment to the kidney during systemic candidiasis.
HTLV-1 induces a Th1-like state in CD4+CCR4+ T cells.
Nitric oxide-induced regulatory T cells inhibit Th17 but not Th1 cell differentiation and function.
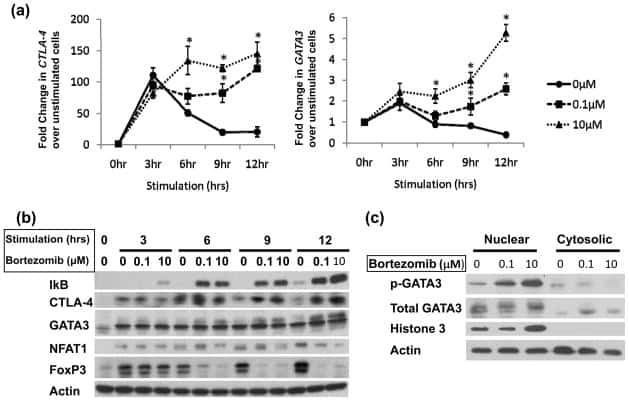
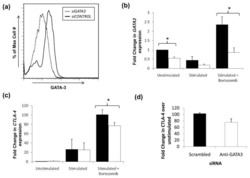
Impaired proteasome function activates GATA3 in T cells and upregulates CTLA-4: relevance for Sézary syndrome.
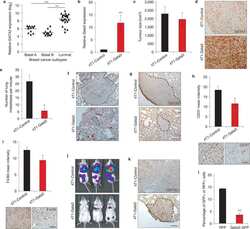
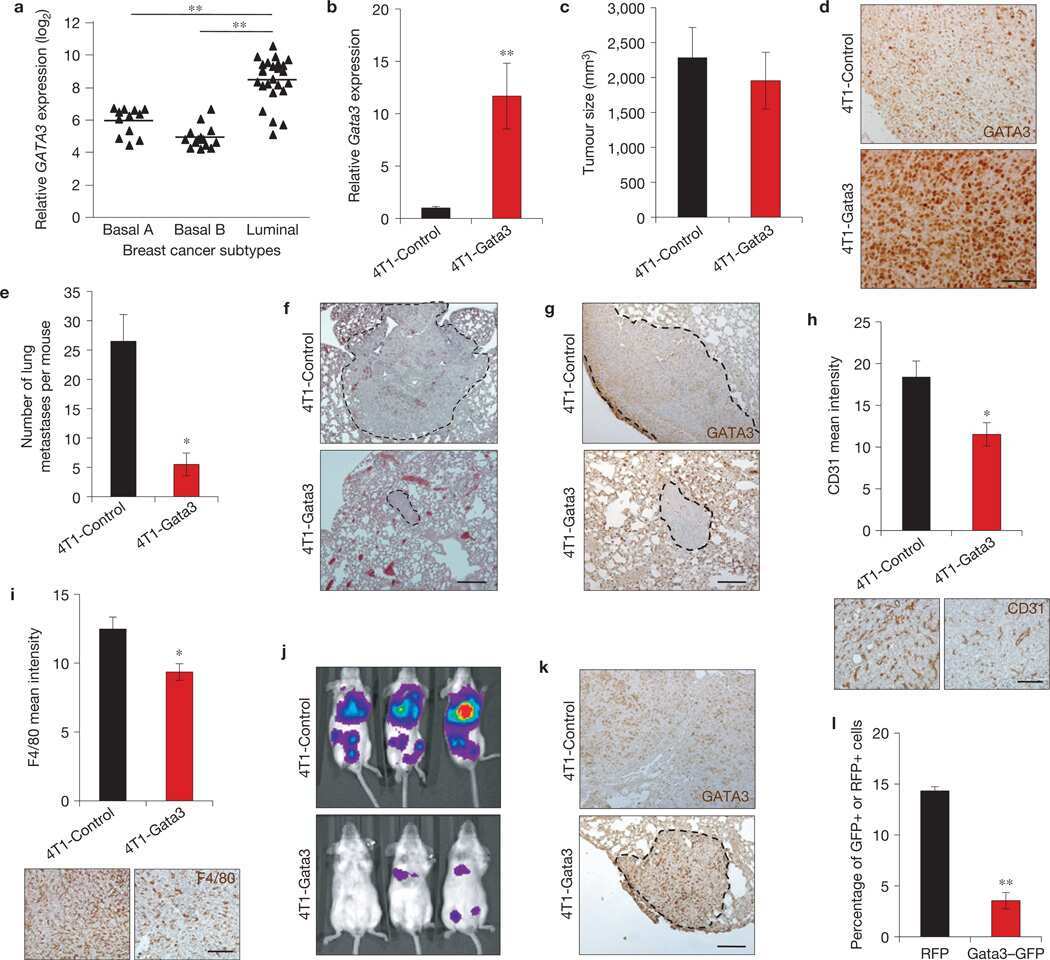
GATA3 suppresses metastasis and modulates the tumour microenvironment by regulating microRNA-29b expression.
Mesenchymal stem cells alleviate TNBS-induced colitis by modulating inflammatory and autoimmune responses.
Transcutaneous vaccination via laser microporation.
Bcl6 controls the Th2 inflammatory activity of regulatory T cells by repressing Gata3 function.
Inflammation driven by tumour-specific Th1 cells protects against B-cell cancer.
TLR4 signaling via MyD88 and TRIF differentially shape the CD4+ T cell response to Porphyromonas gingivalis hemagglutinin B.
Micro-RNA dysregulation in multiple sclerosis favours pro-inflammatory T-cell-mediated autoimmunity.
Role of CD44 in the differentiation of Th1 and Th2 cells: CD44-deficiency enhances the development of Th2 effectors in response to sheep RBC and chicken ovalbumin.
Kalim KW, Yang JQ, Modur V, Nguyen P, Li Y, Zheng Y, Guo F
Frontiers in immunology 2021;12:726393
Frontiers in immunology 2021;12:726393
Effector T cell responses unleashed by regulatory T cell ablation exacerbate oral squamous cell carcinoma.
Chao JL, Korzinkin M, Zhavoronkov A, Ozerov IV, Walker MT, Higgins K, Lingen MW, Izumchenko E, Savage PA
Cell reports. Medicine 2021 Sep 21;2(9):100399
Cell reports. Medicine 2021 Sep 21;2(9):100399
A coordinated progression of progenitor cell states initiates urinary tract development.
Sanchez-Ferras O, Pacis A, Sotiropoulou M, Zhang Y, Wang YC, Bourgey M, Bourque G, Ragoussis J, Bouchard M
Nature communications 2021 May 11;12(1):2627
Nature communications 2021 May 11;12(1):2627
CD8(+) T cells inhibit metastasis and CXCL4 regulates its function.
Joseph R, Soundararajan R, Vasaikar S, Yang F, Allton KL, Tian L, den Hollander P, Isgandarova S, Haemmerle M, Mino B, Zhou T, Shin C, Martinez-Paniagua M, Sahin AA, Rodriguez-Canales J, Gelovani J, Chang JT, Acharya G, Sood AK, Wistuba II, Gibbons DL, Solis LM, Barton MC, Varadarajan N, Rosen JM, Zhang XH, Mani SA
British journal of cancer 2021 Jul;125(2):176-189
British journal of cancer 2021 Jul;125(2):176-189
Histone deacetylase 3 represses cholesterol efflux during CD4(+) T-cell activation.
Wilfahrt D, Philips RL, Lama J, Kizerwetter M, Shapiro MJ, McCue SA, Kennedy MM, Rajcula MJ, Zeng H, Shapiro VS
eLife 2021 Dec 2;10
eLife 2021 Dec 2;10
In Situ Characterization of Follicular Helper CD4 T Cells Using Multiplexed Imaging.
Ioannidou K, Ndiaye DR, Noto A, Fenwick C, Fortis SP, Pantaleo G, Petrovas C, de Leval L
Frontiers in immunology 2020;11:607626
Frontiers in immunology 2020;11:607626
The obesity-induced adipokine sST2 exacerbates adipose T(reg) and ILC2 depletion and promotes insulin resistance.
Zhao XY, Zhou L, Chen Z, Ji Y, Peng X, Qi L, Li S, Lin JD
Science advances 2020 May;6(20):eaay6191
Science advances 2020 May;6(20):eaay6191
Intestinal vitamin D receptor knockout protects from oxazolone-induced colitis.
Shi Y, Liu Z, Cui X, Zhao Q, Liu T
Cell death & disease 2020 Jun 15;11(6):461
Cell death & disease 2020 Jun 15;11(6):461
Attenuation of TCR-induced transcription by Bach2 controls regulatory T cell differentiation and homeostasis.
Sidwell T, Liao Y, Garnham AL, Vasanthakumar A, Gloury R, Blume J, Teh PP, Chisanga D, Thelemann C, de Labastida Rivera F, Engwerda CR, Corcoran L, Kometani K, Kurosaki T, Smyth GK, Shi W, Kallies A
Nature communications 2020 Jan 14;11(1):252
Nature communications 2020 Jan 14;11(1):252
Cell Types Promoting Goosebumps Form a Niche to Regulate Hair Follicle Stem Cells.
Shwartz Y, Gonzalez-Celeiro M, Chen CL, Pasolli HA, Sheu SH, Fan SM, Shamsi F, Assaad S, Lin ET, Zhang B, Tsai PC, He M, Tseng YH, Lin SJ, Hsu YC
Cell 2020 Aug 6;182(3):578-593.e19
Cell 2020 Aug 6;182(3):578-593.e19
Perturbed myoepithelial cell differentiation in BRCA mutation carriers and in ductal carcinoma in situ.
Ding L, Su Y, Fassl A, Hinohara K, Qiu X, Harper NW, Huh SJ, Bloushtain-Qimron N, Jovanović B, Ekram M, Zi X, Hines WC, Alečković M, Gil Del Alcazar C, Caulfield RJ, Bonal DM, Nguyen QD, Merino VF, Choudhury S, Ethington G, Panos L, Grant M, Herlihy W, Au A, Rosson GD, Argani P, Richardson AL, Dillon D, Allred DC, Babski K, Kim EMH, McDonnell CH 3rd, Wagner J, Rowberry R, Bobolis K, Kleer CG, Hwang ES, Blum JL, Cristea S, Sicinski P, Fan R, Long HW, Sukumar S, Park SY, Garber JE, Bissell M, Yao J, Polyak K
Nature communications 2019 Sep 13;10(1):4182
Nature communications 2019 Sep 13;10(1):4182
Compartmentalized gut lymph node drainage dictates adaptive immune responses.
Esterházy D, Canesso MCC, Mesin L, Muller PA, de Castro TBR, Lockhart A, ElJalby M, Faria AMC, Mucida D
Nature 2019 May;569(7754):126-130
Nature 2019 May;569(7754):126-130
IL-33-mediated mast cell activation promotes gastric cancer through macrophage mobilization.
Eissmann MF, Dijkstra C, Jarnicki A, Phesse T, Brunnberg J, Poh AR, Etemadi N, Tsantikos E, Thiem S, Huntington ND, Hibbs ML, Boussioutas A, Grimbaldeston MA, Buchert M, O'Donoghue RJJ, Masson F, Ernst M
Nature communications 2019 Jun 21;10(1):2735
Nature communications 2019 Jun 21;10(1):2735
CD4(+) T Cell Fate Decisions Are Stochastic, Precede Cell Division, Depend on GITR Co-Stimulation, and Are Associated With Uropodium Development.
Cobbold SP, Adams E, Howie D, Waldmann H
Frontiers in immunology 2018;9:1381
Frontiers in immunology 2018;9:1381
Mass cytometry reveals innate lymphoid cell differentiation pathways in the human fetal intestine.
Li N, van Unen V, Höllt T, Thompson A, van Bergen J, Pezzotti N, Eisemann E, Vilanova A, Chuva de Sousa Lopes SM, Lelieveldt BPF, Koning F
The Journal of experimental medicine 2018 May 7;215(5):1383-1396
The Journal of experimental medicine 2018 May 7;215(5):1383-1396
IgE promotes type 2 innate lymphoid cells in murine food allergy.
Burton OT, Medina Tamayo J, Stranks AJ, Miller S, Koleoglou KJ, Weinberg EO, Oettgen HC
Clinical and experimental allergy : journal of the British Society for Allergy and Clinical Immunology 2018 Mar;48(3):288-296
Clinical and experimental allergy : journal of the British Society for Allergy and Clinical Immunology 2018 Mar;48(3):288-296
Tissue-Restricted Adaptive Type 2 Immunity Is Orchestrated by Expression of the Costimulatory Molecule OX40L on Group 2 Innate Lymphoid Cells.
Halim TYF, Rana BMJ, Walker JA, Kerscher B, Knolle MD, Jolin HE, Serrao EM, Haim-Vilmovsky L, Teichmann SA, Rodewald HR, Botto M, Vyse TJ, Fallon PG, Li Z, Withers DR, McKenzie ANJ
Immunity 2018 Jun 19;48(6):1195-1207.e6
Immunity 2018 Jun 19;48(6):1195-1207.e6
Fas ligand promotes an inducible TLR-dependent model of cutaneous lupus-like inflammation.
Mande P, Zirak B, Ko WC, Taravati K, Bride KL, Brodeur TY, Deng A, Dresser K, Jiang Z, Ettinger R, Fitzgerald KA, Rosenblum MD, Harris JE, Marshak-Rothstein A
The Journal of clinical investigation 2018 Jul 2;128(7):2966-2978
The Journal of clinical investigation 2018 Jul 2;128(7):2966-2978
Flt3 ligand expands bona fide innate lymphoid cell precursors in vivo.
Parigi SM, Czarnewski P, Das S, Steeg C, Brockmann L, Fernandez-Gaitero S, Yman V, Forkel M, Höög C, Mjösberg J, Westerberg L, Färnert A, Huber S, Jacobs T, Villablanca EJ
Scientific reports 2018 Jan 9;8(1):154
Scientific reports 2018 Jan 9;8(1):154
Oxysterol Sensing through the Receptor GPR183 Promotes the Lymphoid-Tissue-Inducing Function of Innate Lymphoid Cells and Colonic Inflammation.
Emgård J, Kammoun H, García-Cassani B, Chesné J, Parigi SM, Jacob JM, Cheng HW, Evren E, Das S, Czarnewski P, Sleiers N, Melo-Gonzalez F, Kvedaraite E, Svensson M, Scandella E, Hepworth MR, Huber S, Ludewig B, Peduto L, Villablanca EJ, Veiga-Fernandes H, Pereira JP, Flavell RA, Willinger T
Immunity 2018 Jan 16;48(1):120-132.e8
Immunity 2018 Jan 16;48(1):120-132.e8
Stabilization of cytokine mRNAs in iNKT cells requires the serine-threonine kinase IRE1alpha.
Govindarajan S, Gaublomme D, Van der Cruyssen R, Verheugen E, Van Gassen S, Saeys Y, Tavernier S, Iwawaki T, Bloch Y, Savvides SN, Lambrecht BN, Janssens S, Elewaut D, Drennan MB
Nature communications 2018 Dec 17;9(1):5340
Nature communications 2018 Dec 17;9(1):5340
Characterisation of innate lymphoid cell populations at different sites in mice with defective T cell immunity.
Dutton EE, Camelo A, Sleeman M, Herbst R, Carlesso G, Belz GT, Withers DR
Wellcome open research 2017;2:117
Wellcome open research 2017;2:117
Protein kinase CK2 controls T-cell polarization through dendritic cell activation in response to contact sensitizers.
de Bourayne M, Gallais Y, El Ali Z, Rousseau P, Damiens MH, Cochet C, Filhol O, Chollet-Martin S, Pallardy M, Kerdine-Römer S
Journal of leukocyte biology 2017 Mar;101(3):703-715
Journal of leukocyte biology 2017 Mar;101(3):703-715
NLRP3 signaling drives macrophage-induced adaptive immune suppression in pancreatic carcinoma.
Daley D, Mani VR, Mohan N, Akkad N, Pandian GSDB, Savadkar S, Lee KB, Torres-Hernandez A, Aykut B, Diskin B, Wang W, Farooq MS, Mahmud AI, Werba G, Morales EJ, Lall S, Wadowski BJ, Rubin AG, Berman ME, Narayanan R, Hundeyin M, Miller G
The Journal of experimental medicine 2017 Jun 5;214(6):1711-1724
The Journal of experimental medicine 2017 Jun 5;214(6):1711-1724
PD-1 regulates KLRG1(+) group 2 innate lymphoid cells.
Taylor S, Huang Y, Mallett G, Stathopoulou C, Felizardo TC, Sun MA, Martin EL, Zhu N, Woodward EL, Elias MS, Scott J, Reynolds NJ, Paul WE, Fowler DH, Amarnath S
The Journal of experimental medicine 2017 Jun 5;214(6):1663-1678
The Journal of experimental medicine 2017 Jun 5;214(6):1663-1678
Stability and function of regulatory T cells expressing the transcription factor T-bet.
Levine AG, Mendoza A, Hemmers S, Moltedo B, Niec RE, Schizas M, Hoyos BE, Putintseva EV, Chaudhry A, Dikiy S, Fujisawa S, Chudakov DM, Treuting PM, Rudensky AY
Nature 2017 Jun 15;546(7658):421-425
Nature 2017 Jun 15;546(7658):421-425
Dissection of SAP-dependent and SAP-independent SLAM family signaling in NKT cell development and humoral immunity.
Chen S, Cai C, Li Z, Liu G, Wang Y, Blonska M, Li D, Du J, Lin X, Yang M, Dong Z
The Journal of experimental medicine 2017 Feb;214(2):475-489
The Journal of experimental medicine 2017 Feb;214(2):475-489
NK cells regulate CXCR2+ neutrophil recruitment during acute lung injury.
Hoegl S, Ehrentraut H, Brodsky KS, Victorino F, Golden-Mason L, Eltzschig HK, McNamee EN
Journal of leukocyte biology 2017 Feb;101(2):471-480
Journal of leukocyte biology 2017 Feb;101(2):471-480
An asthma-associated IL4R variant exacerbates airway inflammation by promoting conversion of regulatory T cells to TH17-like cells.
Massoud AH, Charbonnier LM, Lopez D, Pellegrini M, Phipatanakul W, Chatila TA
Nature medicine 2016 Sep;22(9):1013-22
Nature medicine 2016 Sep;22(9):1013-22
FOXP3+ Tregs require WASP to restrain Th2-mediated food allergy.
Lexmond WS, Goettel JA, Lyons JJ, Jacobse J, Deken MM, Lawrence MG, DiMaggio TH, Kotlarz D, Garabedian E, Sackstein P, Nelson CC, Jones N, Stone KD, Candotti F, Rings EH, Thrasher AJ, Milner JD, Snapper SB, Fiebiger E
The Journal of clinical investigation 2016 Oct 3;126(10):4030-4044
The Journal of clinical investigation 2016 Oct 3;126(10):4030-4044
Phenotypic and functional characterization of the major lymphocyte populations in the fruit-eating bat Pteropus alecto.
Martínez Gómez JM, Periasamy P, Dutertre CA, Irving AT, Ng JH, Crameri G, Baker ML, Ginhoux F, Wang LF, Alonso S
Scientific reports 2016 Nov 24;6:37796
Scientific reports 2016 Nov 24;6:37796
Group 2 innate lymphoid cells utilize the IRF4-IL-9 module to coordinate epithelial cell maintenance of lung homeostasis.
Mohapatra A, Van Dyken SJ, Schneider C, Nussbaum JC, Liang HE, Locksley RM
Mucosal immunology 2016 Jan;9(1):275-86
Mucosal immunology 2016 Jan;9(1):275-86
Deletion of 5-Lipoxygenase in the Tumor Microenvironment Promotes Lung Cancer Progression and Metastasis through Regulating T Cell Recruitment.
Poczobutt JM, Nguyen TT, Hanson D, Li H, Sippel TR, Weiser-Evans MC, Gijon M, Murphy RC, Nemenoff RA
Journal of immunology (Baltimore, Md. : 1950) 2016 Jan 15;196(2):891-901
Journal of immunology (Baltimore, Md. : 1950) 2016 Jan 15;196(2):891-901
Monocyte-Derived Dendritic Cells Promote Th Polarization, whereas Conventional Dendritic Cells Promote Th Proliferation.
Chow KV, Lew AM, Sutherland RM, Zhan Y
Journal of immunology (Baltimore, Md. : 1950) 2016 Jan 15;196(2):624-36
Journal of immunology (Baltimore, Md. : 1950) 2016 Jan 15;196(2):624-36
Conditions for the generation of cytotoxic CD4(+) Th cells that enhance CD8(+) CTL-mediated tumor regression.
Li K, Baird M, Yang J, Jackson C, Ronchese F, Young S
Clinical & translational immunology 2016 Aug;5(8):e95
Clinical & translational immunology 2016 Aug;5(8):e95
Ndfip-mediated degradation of Jak1 tunes cytokine signalling to limit expansion of CD4+ effector T cells.
O'Leary CE, Riling CR, Spruce LA, Ding H, Kumar S, Deng G, Liu Y, Seeholzer SH, Oliver PM
Nature communications 2016 Apr 18;7:11226
Nature communications 2016 Apr 18;7:11226
Intranasal Administration of Lentiviral miR-135a Regulates Mast Cell and Allergen-Induced Inflammation by Targeting GATA-3.
Deng YQ, Yang YQ, Wang SB, Li F, Liu MZ, Hua QQ, Tao ZZ
PloS one 2015;10(9):e0139322
PloS one 2015;10(9):e0139322
Chronic Trichuris muris Infection in C57BL/6 Mice Causes Significant Changes in Host Microbiota and Metabolome: Effects Reversed by Pathogen Clearance.
Houlden A, Hayes KS, Bancroft AJ, Worthington JJ, Wang P, Grencis RK, Roberts IS
PloS one 2015;10(5):e0125945
PloS one 2015;10(5):e0125945
The long intergenic noncoding RNA landscape of human lymphocytes highlights the regulation of T cell differentiation by linc-MAF-4.
Ranzani V, Rossetti G, Panzeri I, Arrigoni A, Bonnal RJ, Curti S, Gruarin P, Provasi E, Sugliano E, Marconi M, De Francesco R, Geginat J, Bodega B, Abrignani S, Pagani M
Nature immunology 2015 Mar;16(3):318-325
Nature immunology 2015 Mar;16(3):318-325
Retinoic Acid Differentially Regulates the Migration of Innate Lymphoid Cell Subsets to the Gut.
Kim MH, Taparowsky EJ, Kim CH
Immunity 2015 Jul 21;43(1):107-19
Immunity 2015 Jul 21;43(1):107-19
CCR7-dependent trafficking of RORγ⁺ ILCs creates a unique microenvironment within mucosal draining lymph nodes.
Mackley EC, Houston S, Marriott CL, Halford EE, Lucas B, Cerovic V, Filbey KJ, Maizels RM, Hepworth MR, Sonnenberg GF, Milling S, Withers DR
Nature communications 2015 Jan 9;6:5862
Nature communications 2015 Jan 9;6:5862
The AGC kinase SGK1 regulates TH1 and TH2 differentiation downstream of the mTORC2 complex.
Heikamp EB, Patel CH, Collins S, Waickman A, Oh MH, Sun IH, Illei P, Sharma A, Naray-Fejes-Toth A, Fejes-Toth G, Misra-Sen J, Horton MR, Powell JD
Nature immunology 2014 May;15(5):457-64
Nature immunology 2014 May;15(5):457-64
Differential requirement for Nfil3 during NK cell development.
Seillet C, Huntington ND, Gangatirkar P, Axelsson E, Minnich M, Brady HJ, Busslinger M, Smyth MJ, Belz GT, Carotta S
Journal of immunology (Baltimore, Md. : 1950) 2014 Mar 15;192(6):2667-76
Journal of immunology (Baltimore, Md. : 1950) 2014 Mar 15;192(6):2667-76
Cutting edge: Failure of antigen-specific CD4+ T cell recruitment to the kidney during systemic candidiasis.
Drummond RA, Wallace C, Reid DM, Way SS, Kaplan DH, Brown GD
Journal of immunology (Baltimore, Md. : 1950) 2014 Dec 1;193(11):5381-5
Journal of immunology (Baltimore, Md. : 1950) 2014 Dec 1;193(11):5381-5
HTLV-1 induces a Th1-like state in CD4+CCR4+ T cells.
Araya N, Sato T, Ando H, Tomaru U, Yoshida M, Coler-Reilly A, Yagishita N, Yamauchi J, Hasegawa A, Kannagi M, Hasegawa Y, Takahashi K, Kunitomo Y, Tanaka Y, Nakajima T, Nishioka K, Utsunomiya A, Jacobson S, Yamano Y
The Journal of clinical investigation 2014 Aug;124(8):3431-42
The Journal of clinical investigation 2014 Aug;124(8):3431-42
Nitric oxide-induced regulatory T cells inhibit Th17 but not Th1 cell differentiation and function.
Niedbala W, Besnard AG, Jiang HR, Alves-Filho JC, Fukada SY, Nascimento D, Mitani A, Pushparaj P, Alqahtani MH, Liew FY
Journal of immunology (Baltimore, Md. : 1950) 2013 Jul 1;191(1):164-70
Journal of immunology (Baltimore, Md. : 1950) 2013 Jul 1;191(1):164-70
Impaired proteasome function activates GATA3 in T cells and upregulates CTLA-4: relevance for Sézary syndrome.
Gibson HM, Mishra A, Chan DV, Hake TS, Porcu P, Wong HK
The Journal of investigative dermatology 2013 Jan;133(1):249-57
The Journal of investigative dermatology 2013 Jan;133(1):249-57
GATA3 suppresses metastasis and modulates the tumour microenvironment by regulating microRNA-29b expression.
Chou J, Lin JH, Brenot A, Kim JW, Provot S, Werb Z
Nature cell biology 2013 Feb;15(2):201-13
Nature cell biology 2013 Feb;15(2):201-13
Mesenchymal stem cells alleviate TNBS-induced colitis by modulating inflammatory and autoimmune responses.
Chen QQ, Yan L, Wang CZ, Wang WH, Shi H, Su BB, Zeng QH, Du HT, Wan J
World journal of gastroenterology 2013 Aug 7;19(29):4702-17
World journal of gastroenterology 2013 Aug 7;19(29):4702-17
Transcutaneous vaccination via laser microporation.
Weiss R, Hessenberger M, Kitzmüller S, Bach D, Weinberger EE, Krautgartner WD, Hauser-Kronberger C, Malissen B, Boehler C, Kalia YN, Thalhamer J, Scheiblhofer S
Journal of controlled release : official journal of the Controlled Release Society 2012 Sep 10;162(2):391-9
Journal of controlled release : official journal of the Controlled Release Society 2012 Sep 10;162(2):391-9
Bcl6 controls the Th2 inflammatory activity of regulatory T cells by repressing Gata3 function.
Sawant DV, Sehra S, Nguyen ET, Jadhav R, Englert K, Shinnakasu R, Hangoc G, Broxmeyer HE, Nakayama T, Perumal NB, Kaplan MH, Dent AL
Journal of immunology (Baltimore, Md. : 1950) 2012 Nov 15;189(10):4759-69
Journal of immunology (Baltimore, Md. : 1950) 2012 Nov 15;189(10):4759-69
Inflammation driven by tumour-specific Th1 cells protects against B-cell cancer.
Haabeth OA, Lorvik KB, Hammarström C, Donaldson IM, Haraldsen G, Bogen B, Corthay A
Nature communications 2011;2:240
Nature communications 2011;2:240
TLR4 signaling via MyD88 and TRIF differentially shape the CD4+ T cell response to Porphyromonas gingivalis hemagglutinin B.
Gaddis DE, Michalek SM, Katz J
Journal of immunology (Baltimore, Md. : 1950) 2011 May 15;186(10):5772-83
Journal of immunology (Baltimore, Md. : 1950) 2011 May 15;186(10):5772-83
Micro-RNA dysregulation in multiple sclerosis favours pro-inflammatory T-cell-mediated autoimmunity.
Guerau-de-Arellano M, Smith KM, Godlewski J, Liu Y, Winger R, Lawler SE, Whitacre CC, Racke MK, Lovett-Racke AE
Brain : a journal of neurology 2011 Dec;134(Pt 12):3578-89
Brain : a journal of neurology 2011 Dec;134(Pt 12):3578-89
Role of CD44 in the differentiation of Th1 and Th2 cells: CD44-deficiency enhances the development of Th2 effectors in response to sheep RBC and chicken ovalbumin.
Guan H, Nagarkatti PS, Nagarkatti M
Journal of immunology (Baltimore, Md. : 1950) 2009 Jul 1;183(1):172-80
Journal of immunology (Baltimore, Md. : 1950) 2009 Jul 1;183(1):172-80
No comments: Submit comment
Supportive validation
- Submitted by
- Invitrogen Antibodies (provider)
- Main image

- Experimental details
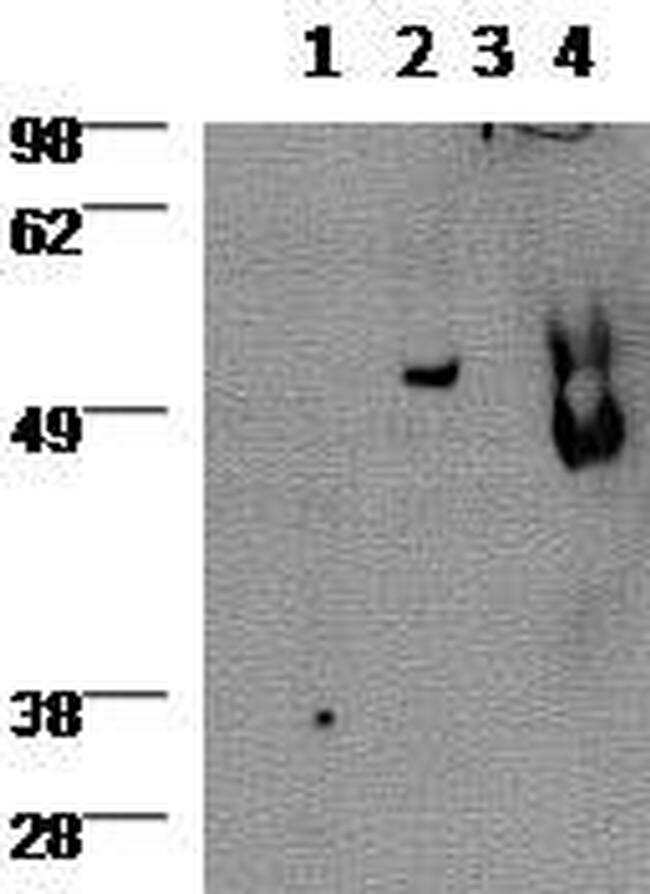
- Western blot using 2 µg/mL Anti-Human/Mouse Gata-3 Purified) and revealed with Anti-Rat IgG HRP.Lane 1: 3 day anti-CD3/CD28 stimulated human CD4 cells, 2: 6 day Th2 polarized cultured human cells, 3: Jurkat cell line, 4: MCF7 cell line.
Supportive validation
- Submitted by
- Invitrogen Antibodies (provider)
- Main image
- Experimental details
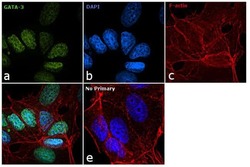
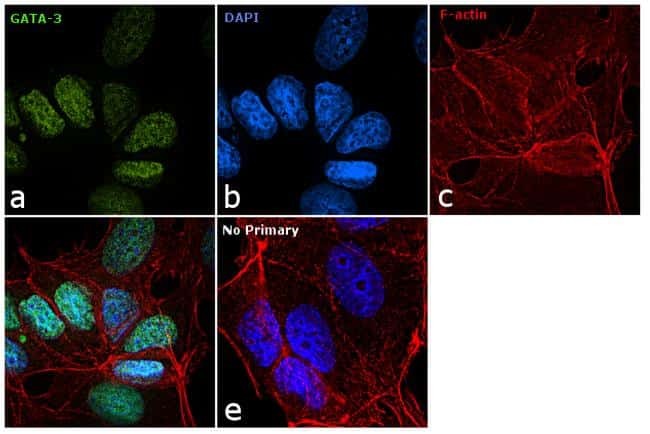
- Immunofluorescence analysis of GATA-3 was performed using 70% confluent log phase MCF7 cells. The cells were fixed with 4% paraformaldehyde for 10 minutes, permeabilized with 0.1% Triton™ X-100 for 15 minutes, and blocked with 1% BSA for 1 hour at room temperature. The cells were labeled with GATA-3 Monoclonal Antibody (TWAJ) (Product # 14-9966-80) at 5 µg/mL in 0.1% BSA, incubated at 4 degree Celsius overnight, followed by labelling with Goat anti-Rat IgG (H+L) Superclonal™ Secondary Antibody, Alexa Fluor® 488 conjugate (Product # A11006) at a dilution of 1:2000 for 45 minutes at room temperature (Panel a: green). Nuclei (Panel b: blue) were stained with SlowFade® Gold Antifade Mountant with DAPI (Product # S36938). F-actin (Panel c: red) was stained with Rhodamine Phalloidin (Product # R415, 1:300). Panel d represents the merged image showing nuclear localization. Panel e represents control cells with no primary antibody to assess background. The images were captured at 60X magnification.
- Submitted by
- Invitrogen Antibodies (provider)
- Main image
- Experimental details
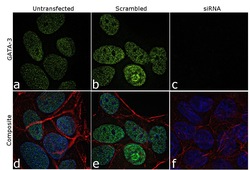
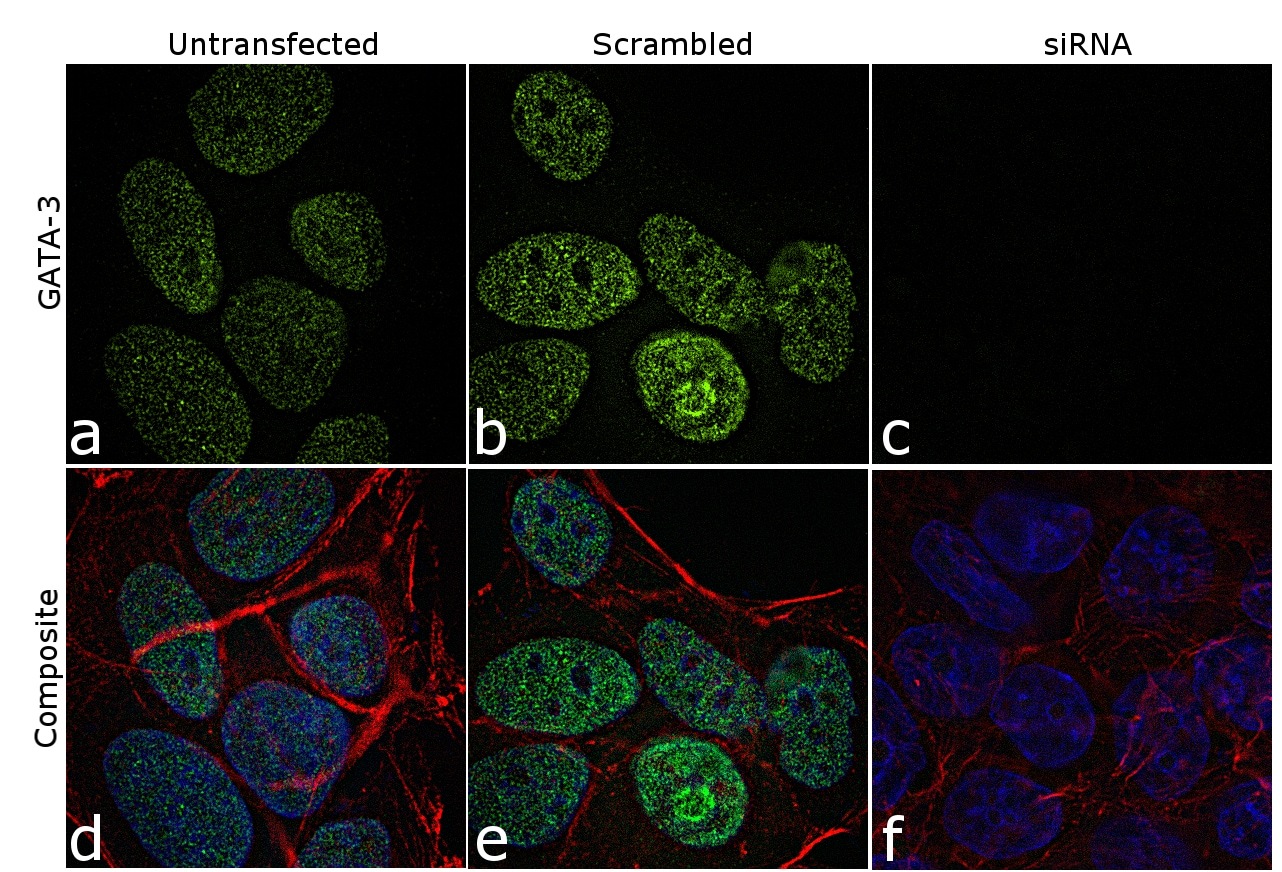
- Knockdown of GATA-3 was achieved by transfecting MCF7 cells with GATA-3 specific siRNAs (Silencer® select Product # s5600; s5599). Immunofluorescence analysis was performed using untransfected MCF7 (panels a, d), transfected with non-specific scrambled siRNA (panels b,e) and transfected with GATA-3 specific siRNAs (panel c,f). The cells were labeled with GATA-3 Monoclonal Antibody (TWAJ) (Product # 14-9966-80) at 5 µg/mL in 0.1% BSA, incubated at 4 degree Celsius overnight, followed by labelling with Goat anti-Rat IgG (H+L) Superclonal™ Secondary Antibody, Alexa Fluor® 488 conjugate (Product # A11006) at a dilution of 1:2000 for 45 minutes at room temperature (Panel a: green). Nuclei (blue) were stained using ProLong™ Diamond Antifade Mountant with DAPI (Product # P36962) and Rhodamine Phalloidin (Product # R415, 1:300) was used for cytoskeletal F-actin (red) staining. Reduction of GATA-3 expression was observed upon siRNA mediated knockdown (panel c,f), confirming the specificity of the antibody to GATA-3. The images were captured at 60X magnification.
Supportive validation
- Submitted by
- Invitrogen Antibodies (provider)
- Main image
- Experimental details
- NULL

- Submitted by
- Invitrogen Antibodies (provider)
- Main image
- Experimental details
- NULL

- Submitted by
- Invitrogen Antibodies (provider)
- Main image

- Experimental details
- NULL
- Submitted by
- Invitrogen Antibodies (provider)
- Main image
- Experimental details
- NULL

- Submitted by
- Invitrogen Antibodies (provider)
- Main image
- Experimental details
- NULL
- Submitted by
- Invitrogen Antibodies (provider)
- Main image
- Experimental details
- NULL
- Submitted by
- Invitrogen Antibodies (provider)
- Main image
- Experimental details
- NULL
- Submitted by
- Invitrogen Antibodies (provider)
- Main image
- Experimental details
- NULL
- Submitted by
- Invitrogen Antibodies (provider)
- Main image
- Experimental details
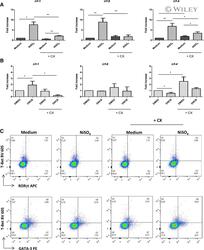
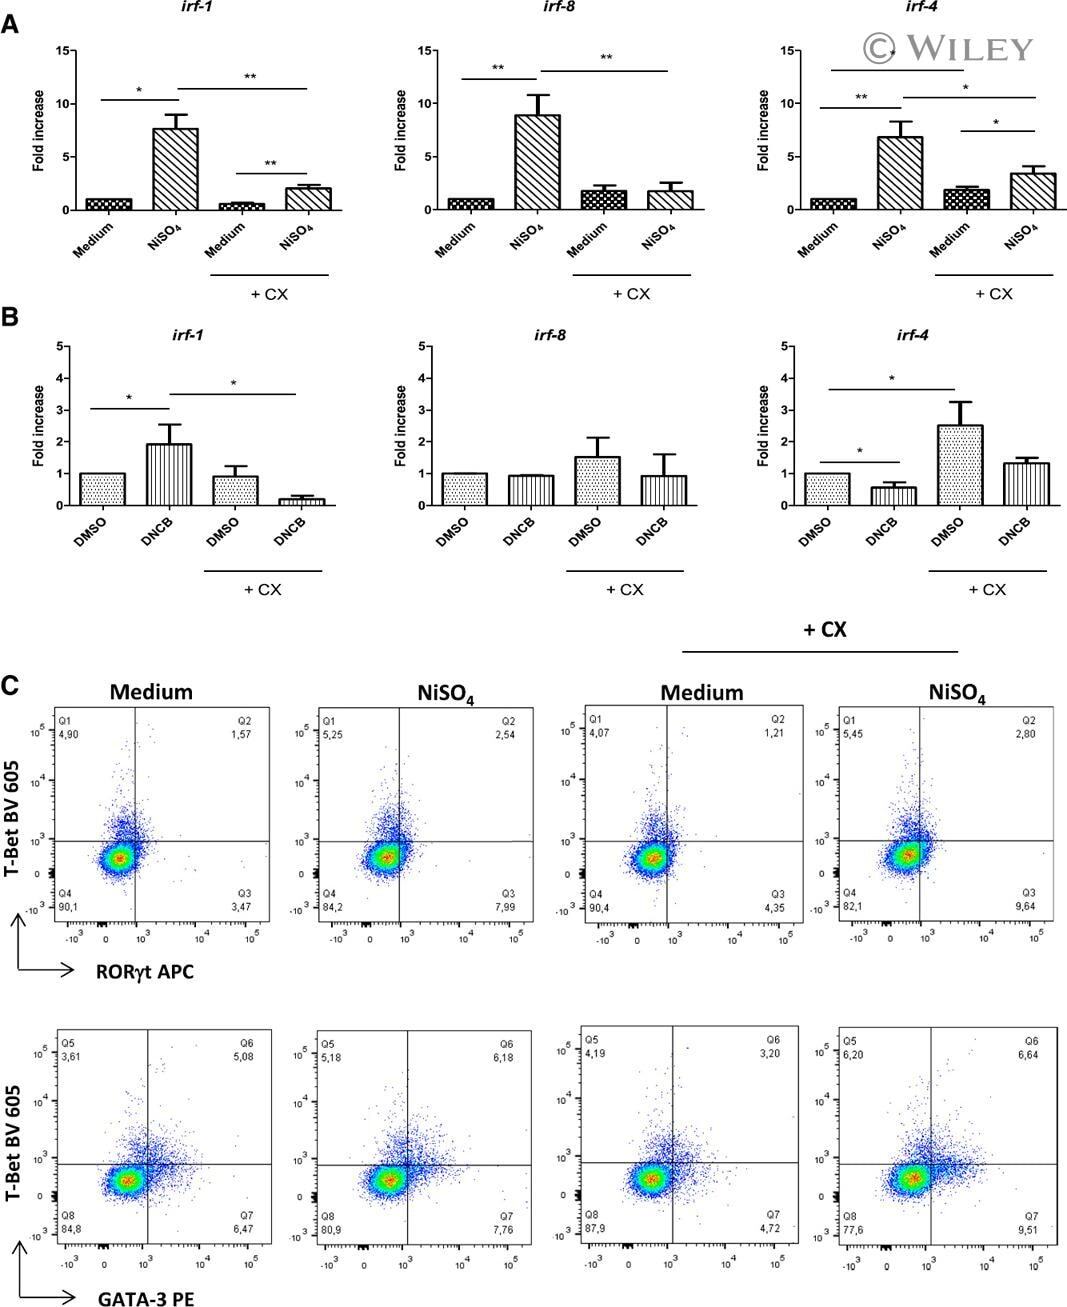
- 7 Inhibition of CK2 activity modulates mRNA expression of IRFs in MoDCs. Immature MoDCs were pretreated for 1 h with DMSO 0.1% or CX-4945 (CX, 5 uM) and then stimulated for 6 h with (A) NiSO 4 500 uM or (B) DNCB 10 uM. IRF-1, -8, and -4 mRNAs were quantified by real-time RT-PCR. Naive CD4 + T lymphocytes were coincubated with NiSO4-stimulated MoDCs (C) in the absence or presence of CX-4945 (5 uM). On day 5, cells were restimulated with anti-CD3/CD2/CD28 beads for 48 h and stained with CD4-Alexa Fluor 700, CD3-FITC, RorgammaT-APC, GATA3-PE, and T-Bet Brilliant Violet 605. Living cells (ZombieAqua negative cells) were analyzed by flow cytometry. Data represent the results of 5 independent experiments and are normalized to the control. * P < 0.05; ** P < 0.01 (Mann-Whitney test).
- Submitted by
- Invitrogen Antibodies (provider)
- Main image
- Experimental details
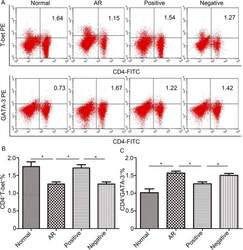
- Fig 5 Lentiviral-mmu-miR-135a treatment influences Th cell polarization. The expression of T-bet and GATA-3 protein in CD4 + T cells was measured in the spleens of normal (control), AR (AR-induced), positive (AR-induced, treated with lentiviral-mmu-miR-135a), and negative (AR-induced, treated with empty lentivirus) mice using flow cytometry. (A) Representative dot plots from each experimental group. The percentages of CD4 + T-bet + T cells (B) and CD4 + GATA-3 + T cells (C) were also calculated. Data are presented as the mean +- SEM. *P

- Submitted by
- Invitrogen Antibodies (provider)
- Main image
- Experimental details
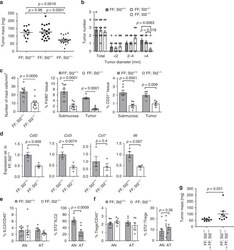
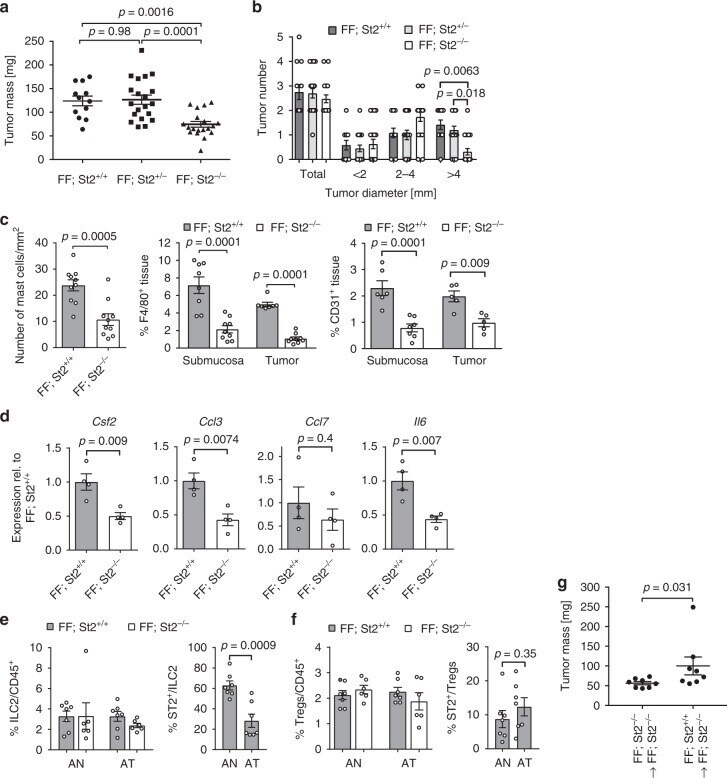
- Fig. 7 Tumor burden is reduced in St2 receptor-deficient gp130 FF mice. a Quantification of total tumor burden in 100-day-old mice of the indicated genotype. Each symbol represents an individual mouse. One-way ANOVA was performed with F (DFn, Dfd) = 11.83 (2, 48). b Enumeration of total tumor number from mice in a , and of tumors following classification according to their size. n = 12 ( FF, St2 +/+ ), n = 20 ( FF, St2 +/ - ), and n = 19 ( FF, St2 -/- ) mice. One-way ANOVA was performed with F (DFn, Dfd) = 22.79 (11, 192). c Quantification of toluidine blue (for detection of mast cells; submucosal tissue), F4/80 and CD31 stained sections of gastric tumors of mice of the indicated genotype. Mast cells: n = 10 mice, t -test t (df) = 4.25 (18); F4/80: n = 8 (FF; St2 +/+ ), n = 9 (FF; St2 - /- ), one-way ANOVA F (DFn, Dfd) = 27.52 (3,29); CD31: n = 6 (Submucosa) n = 5 (Tumor), and one-way ANOVA F (DFn, Dfd) = 13.6 (3,19). d qPCR expression analysis of chemokines expressed by FACS-purified tumor-associated mast cells from stomachs of either FF; St2 +/+ or FF; St2 -/- mice. All n = 4 from two independent experiments. Csf2 : t -test t (df) = 3.81 (6); Ccl3 : t -test t (df) = 3.97 (6); Ccl7 : t -test t (df) = 0.88(6); Il6 :: t -test t (df) = 4.02 (6); e , f Flow cytometric analysis of unaffected antrum (AN) and antrum tumors (AT) of indicated genotype for the frequency of ILC2 cells (lineage - , Cd11b - , Gata3 + ), Tregs (Foxp3 + , CD4 + ), and proportion of St2 + cells within these
- Submitted by
- Invitrogen Antibodies (provider)
- Main image
- Experimental details
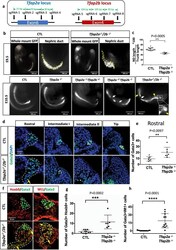
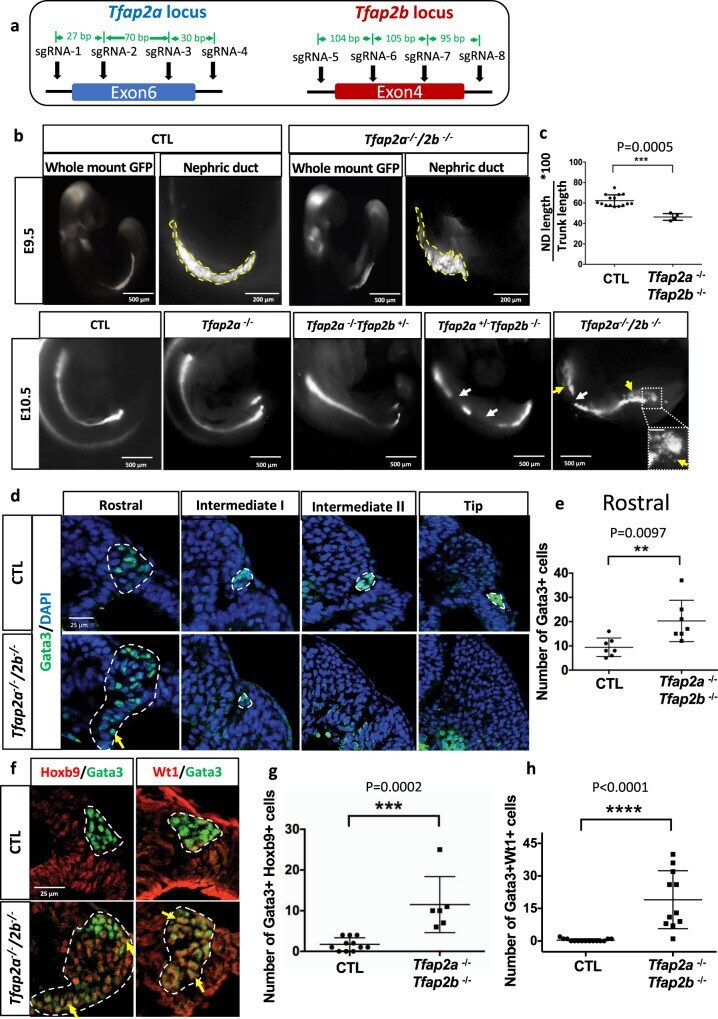
- Fig. 6 Inactivation of Tfap2a and Tfap2b by CRISPR/Cas9 leads to defects in nephric duct morphogenesis and progenitor cell identity. a Schematic representation of Tfap2a and Tfap2b exons targeted by CRISPR/Cas9 technology and the location of the sgRNAs used. b Wholemount GFP fluorescence of control ( Pax2-GFP ) and allelic series of Tfap2a/2b ; Pax2-GFP mutant embryos at E9.5 and E10.5. White arrows denote nephric duct integrity defects whereas yellow arrow and inset magnification highlight ectopic Pax2-GFP positive cells. Scale bar of the inset = 50 mum. c Quantification of nephric duct (ND) elongation in Tfap2a/2b ; Pax2-GFP double KO embryos at E9.5. n = 15 (Control) and n = 4 ( Tfap2a/2b double KO) biologically independent samples. The graphs represent mean +- SD, assessed by a two-tailed Mann-Whitney test. Source data are provided as a Source Data file . d Immunostaining for the nephric duct marker Gata3 in transverse sections of E9.5 Tfap2a/2b double mutant shows an elongation defect and the presence of ectopic Gata3 positive (nephric duct) cells (yellow arrows). Nephric duct cells are denoted by white dotted lines. Scale bar 25 mum for all pictures. e Quantification of Gata3 + cells in the rostral region of E9.5 control and Tfap2a/2b double KO embryos ( n = 7). The graph represents mean +- SD, determined by a two-tailed unpaired t -test. Source data are provided as a Source Data file . f Immunostaining for the markers Hoxb9 (NdPr1), and intermediate mesoderm (Wt1) in t
- Submitted by
- Invitrogen Antibodies (provider)
- Main image

- Experimental details
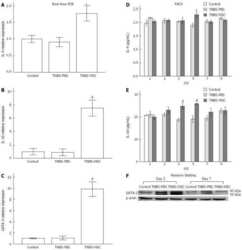
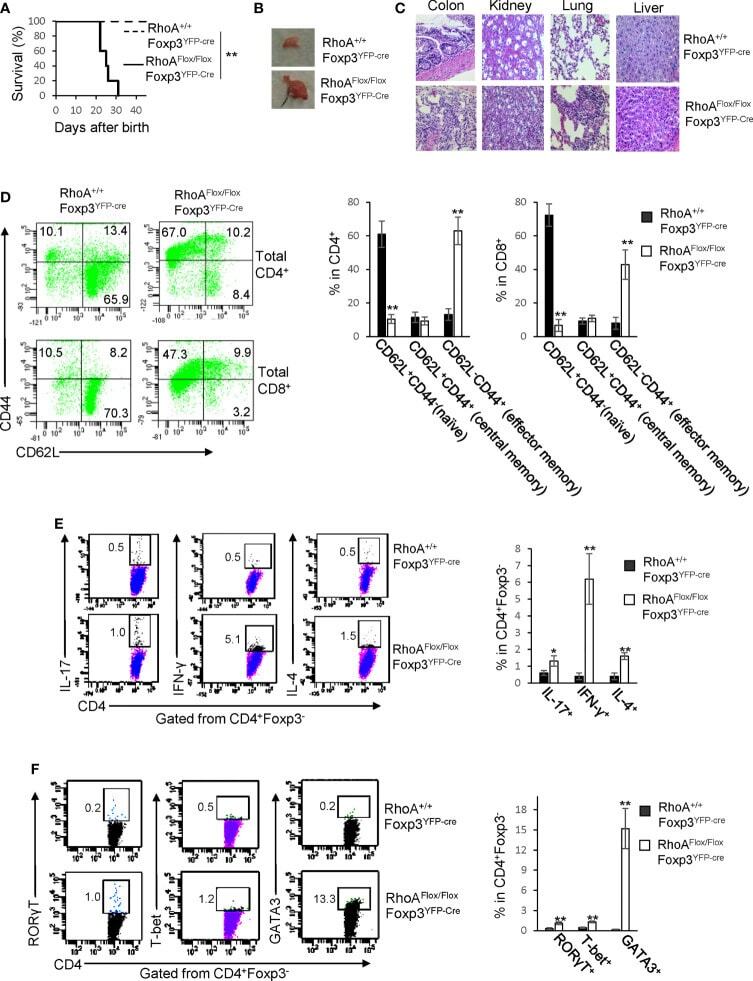
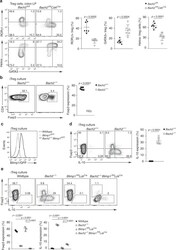
- Figure 1 Homozygous RhoA deletion in Treg cells leads to early, fatal spontaneous inflammatory disorders. (A) Survival outcome of RhoA +/+ Foxp3 YFP-Cre and RhoA Flox/Flox Foxp3 YFP-Cre mice. Results were analyzed with a log-rank (Mantel-Cox) test and expressed as Kaplan-Meier survival curves. (B) Image of lymphadenopathy in RhoA Flox/Flox Foxp3 YFP-Cre mice. Inguinal lymph nodes are shown. (C) Images of H&E staining of the indicated organs from RhoA +/+ Foxp3 YFP-Cre and RhoA Flox/Flox Foxp3 YFP-Cre mice (original magnification X 400). (D) Left, representative flow cytogram of CD44 and CD62L staining in CD4 + and CD8 + cells from the spleen of RhoA +/+ Foxp3 YFP-Cre and RhoA Flox/Flox Foxp3 YFP-Cre mice. The numbers indicate percentages of CD44 + , CD44 + CD62L + , and CD62L + cells. Right, average percentages of CD44 + , CD44 + CD62L + , and CD62L + cells. (E) Left, representative flow cytogram of IL-17, IFN-gamma, and IL-4 staining in CD4 + Foxp3 - cells from the spleen of RhoA +/+ Foxp3 YFP-Cre and RhoA Flox/Flox Foxp3 YFP-Cre mice. The numbers indicate percentages of IL-17 + , IFN-gamma + , and IL-4 + cells. Right, average percentages of IL-17 + , IFN-gamma + , and IL-4 + cells. (F) Left, representative flow cytogram of RORgammaT, T-bet and GATA3 staining in CD4 + Foxp3 - cells from the spleen of RhoA +/+ Foxp3 YFP-Cre and RhoA Flox/Flox Foxp3 YFP-Cre mice. The numbers indicate percentages of RORgammaT + , T-bet + , and GATA3 + cells. Right, average percentages of RORgam
- Submitted by
- Invitrogen Antibodies (provider)
- Main image
- Experimental details
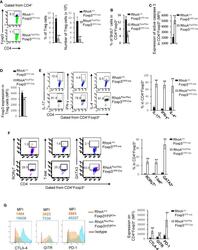
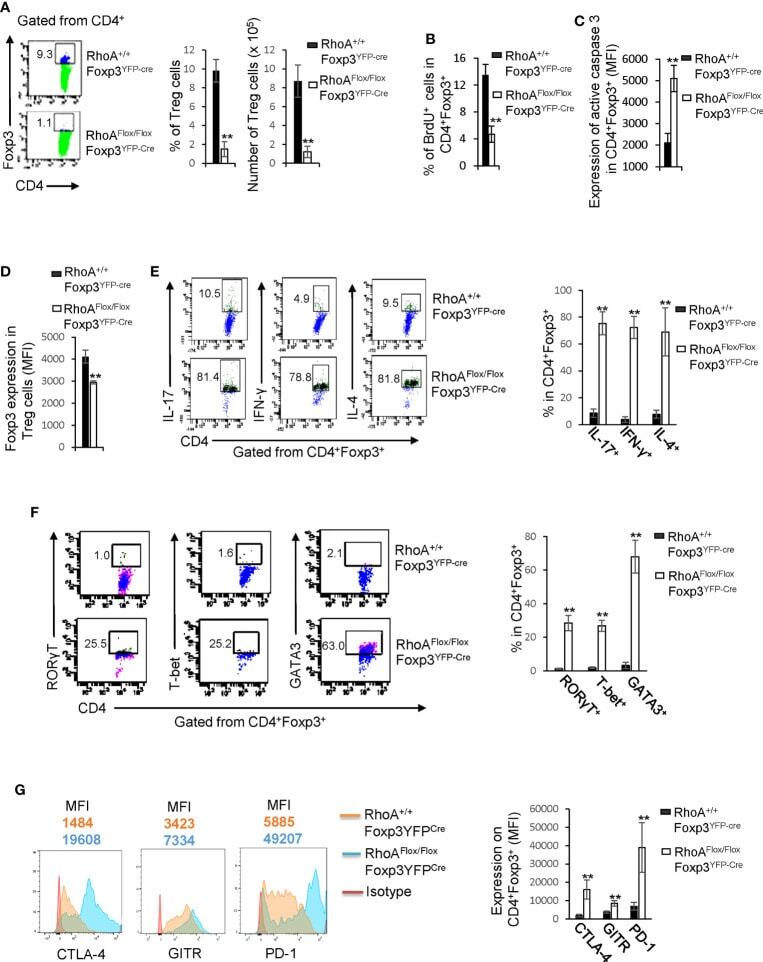
- Figure 2 Homozygous RhoA deletion in Treg cells dampens Treg cell homeostasis and induces Treg cell plasticity. (A) Left, representative flow cytogram of Foxp3 staining in CD4 + cells from the spleen of RhoA +/+ Foxp3 YFP-Cre and RhoA Flox/Flox Foxp3 YFP-Cre mice. The numbers indicate percentages of CD4 + Foxp3 + Treg cells. Middle, average percentages of CD4 + Foxp3 + Treg cells. Right, average numbers of CD4 + Foxp3 + Treg cells. (B) Treg cell proliferation. Percentages of CD4 + Foxp3 + Treg cells incorporated with BrdU are shown. (C) Treg cell apoptosis. The expression levels (MFI: Mean fluorescence intensity) of active caspase 3 in CD4 + Foxp3 + Treg cells are shown. (D) The expression levels of Foxp3 in Treg cells. (E) Left, representative flow cytogram of IL-17, IFN-gamma, and IL-4 staining in CD4 + Foxp3 + Treg cells. The numbers indicate percentages of IL-17 + , IFN-gamma + , and IL-4 + Treg cells. Right, average percentages of IL-17 + , IFN-gamma + , and IL-4 + Treg cells. (F) Left, representative flow cytogram of RORgammaT, T-bet and GATA3 staining in CD4 + Foxp3 + Treg cells. The numbers indicate percentages of RORgammaT + , T-bet + , and GATA3 + Treg cells. Right, average percentages of RORgammaT + , T-bet + , and GATA3 + Treg cells. (G) Left, representative histogram of the expression levels of CTLA-4, GITR and PD-1 in CD4 + Foxp3 + Treg cells. The numbers above the graphs indicate MFI. Right, average MFI of CTLA-4, GITR and PD-1 in CD4 + Foxp3 + Treg cells. n =
- Submitted by
- Invitrogen Antibodies (provider)
- Main image
- Experimental details
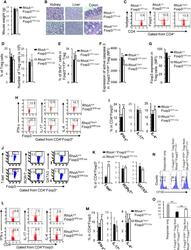
- Figure 5 Heterozygous RhoA deletion in Treg cells induces Treg cell plasticity and increases CD4 + effector T cells but does not result in autoimmunity. (A) Body weight of RhoA +/+ Foxp3 YFP-Cre and RhoA Flox/+ Foxp3 YFP-Cre mice. (B) Images of H&E staining of the indicated organs. (C) Representative flow cytogram of Foxp3 staining in CD4 + cells from the spleen of RhoA +/+ Foxp3 YFP-Cre and RhoA Flox/+ Foxp3 YFP-Cre mice. The numbers indicate percentages of CD4 + Foxp3 + Treg cells. (D) Left, average percentages of CD4 + Foxp3 + Treg cells. Right, cell numbers of CD4 + Foxp3 + Treg cells. (E) Proliferation of Foxp3 + YFP + Treg cells from RhoA +/+ Foxp3 YFP-Cre/+ and RhoA Flox/+ Foxp3 YFP-Cre/+ female mice. Percentages of Foxp3 + YFP + Treg cells incorporated with BrdU are shown. (F) Apoptosis of Foxp3 + YFP + Treg cells from RhoA +/+ Foxp3 YFP-Cre/+ and RhoA Flox/+ Foxp3 YFP-Cre/+ female mice. The expression levels (MFI: mean fluorescence intensity) of active caspase 3 in Foxp3 + YFP + Treg cells are shown. (G) The expression levels of Foxp3 in Treg cells from RhoA +/+ Foxp3 YFP-Cre and RhoA Flox/+ Foxp3 YFP-Cre mice. (H) Representative flow cytogram of IFN-gamma, IL-17 and IL-4 staining in CD4 + Foxp3 + Treg cells. The numbers indicate percentages of IFN-gamma + , IL-17 + and IL-4 + Treg cells. (I) Average percentages of IFN-gamma + , IL-17 + and IL-4 + Treg cells. (J) Representative flow cytogram of RORgammaT, T-bet and GATA3 staining in CD4 + Foxp3 + Treg cells. The numb
- Submitted by
- Invitrogen Antibodies (provider)
- Main image
- Experimental details
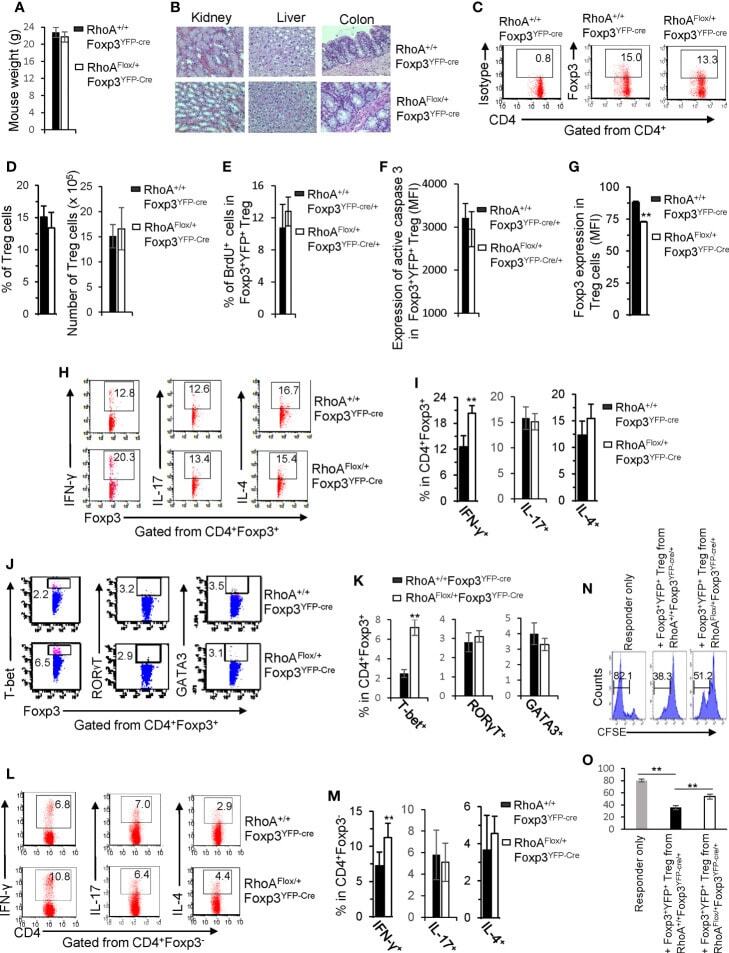
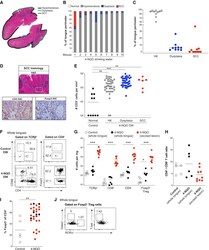
- Figure 2 Murine carcinogen-induced oral lesions are enriched for CD4 + Treg and conventional T cells 6- to 8-week-old C57BL/6 mice were exposed to drinking water containing 100 mug/mL 4-NQO or vehicle control for 20 weeks. (A) Quantification of histopathology. After 20 weeks of treatment with 4-NQO drinking water, tongues were dissected, fixed in 10% formalin, bisected longitudinally, and stained with H&E. The perimeter of each tongue is outlined and categorized base on histology grade: hyperkeratosis (black); dysplasia (blue); or SCC (green). Shown is a representative H&E stain of FFPE tongue after longitudinal bisection of 4-NQO-treated mouse, perimeter traced based on histology grades noted above. (B and C) Summary plots of 4-NQO-induced histopathology, showing the percentage of tongue perimeter defined as indicated histology grade. Each bar (B) or symbol (C) represents an individual tongue from a single mouse. Median is indicated in (C). n = 10 mice. (D) (Top) Representative H&E image of SCC region of tongue epithelium from (A). (Bottom) Representative CD3 (left) and Foxp3 (right) IHC images of adjacent sections of depicted SCC region denoted by white box in H&E image are shown. White arrows denote CD3 + or Foxp3 + cells. Scale bars represent 400 mum (H&E) or 50 mum (IHC). (E) Summary plot of pooled data from CD3 IHC density analysis, showing the number of CD3 + cells per mm 2 for each lesion. Each symbol represents an individual lesion. Median is indicated. n = 10 region
- Submitted by
- Invitrogen Antibodies (provider)
- Main image
- Experimental details
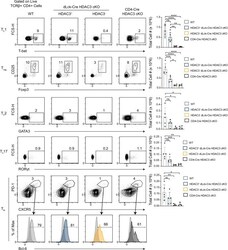
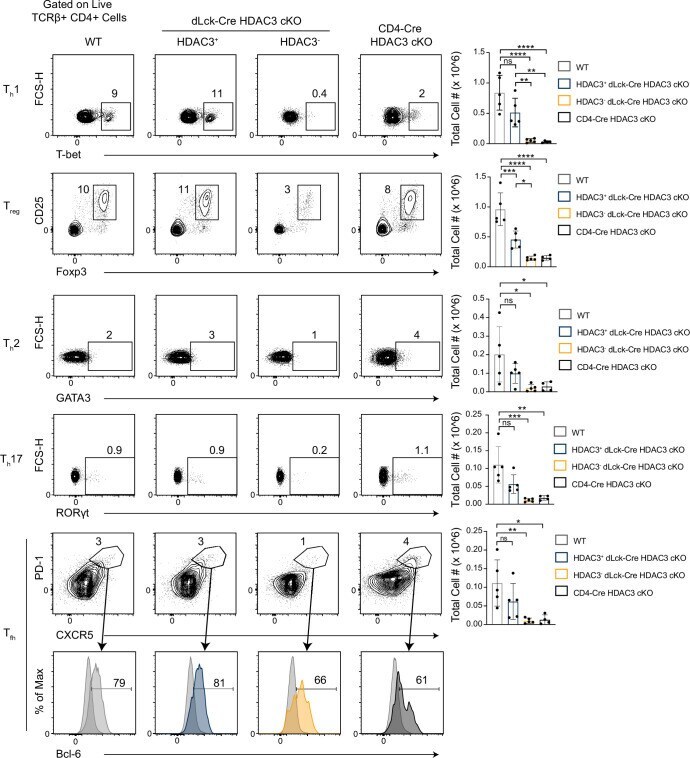
- Figure 2. Histone deacetylase 3 (HDAC3)-deficient CD4 + T cells from dLck-Cre HDAC3 cKO mice have reduced differentiated T h -cell populations. Identification of helper T-cell populations in vivo. Splenocytes were harvested from wild-type (WT) and HDAC3 cKO mice, and labeled for flow cytometry. Cells were first gated on HDAC3 + or HDAC3 - events, then gating for T h 1 (T-bet + ), T h 2 (GATA3 + ), T h 17 (RORgammat + ), T reg (Foxp3 + CD25 + ), and T fh (CXCR5 + PD-1 + Bcl-6 hi ) is shown (left). Bar plots on right represent pooled data for the total cell number +- standard deviation (SD) from three independent experiments ( n = 4-5 mice/group in total). Non-T fh CXCR5 - PD-1 - cells (dark gray histograms) were used as a negative control for Bcl-6 expression to set the gate on the Bcl-6 histograms. Statistical significance was determined for the indicated comparisons using ordinary one-way analysis of variance (ANOVA) with Tukey's multiple comparisons test (*p < 0.05, **p < 0.01, ***p < 0.001, ****p < 0.0001). Figure 2--figure supplement 1. Histone deacetylase 3 (HDAC3)-deficient T cells from dLck-Cre HDAC3 cKO mice have reduced differentiated T h -cell populations. Identification of helper T-cell populations in vivo. Lymphocytes were harvested from mesenteric lymph nodes of wild-type (WT) and dLck-Cre HDAC3 cKO mice, and labeled for flow cytometry. Cells were first gated on HDAC3 + or HDAC3 - events, then gating for T h 1 (T-bet + ), T h 2 (GATA3 + ), T h 17 (RORgammat + ),
- Submitted by
- Invitrogen Antibodies (provider)
- Main image
- Experimental details
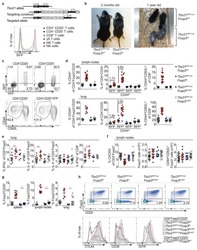
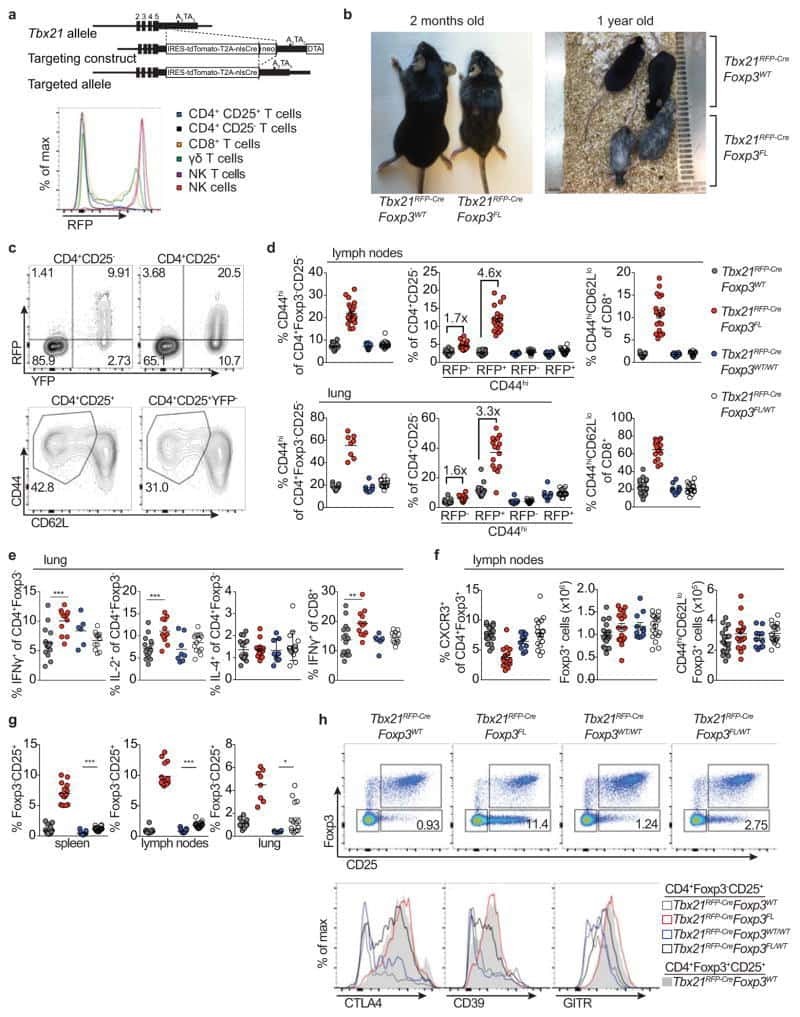
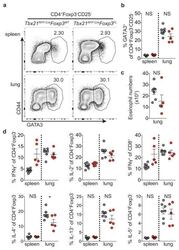
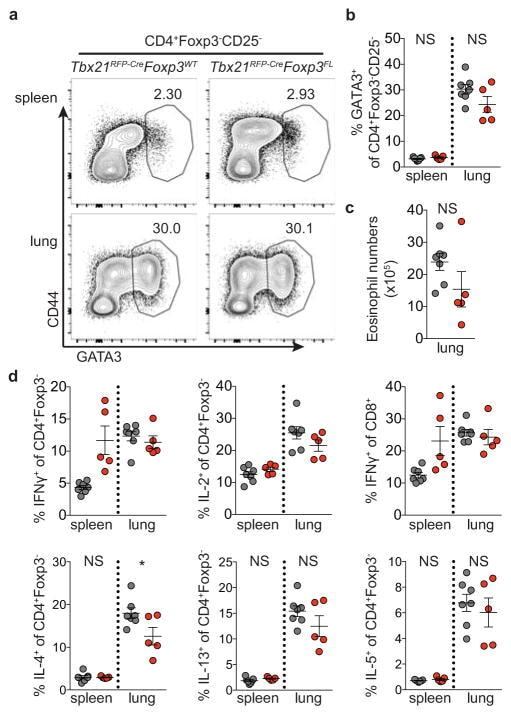
- Extended Data Figure 7 Distinguishing the drivers of autoimmunity in the absence of T-bet + Treg cells a,b , ex-Treg cells are no more pathogenic than effector CD4 T cells. a , CD4 + CD25 + (Treg) cells were sorted from lymph nodes of Tbx21 RFP-Cre Foxp3 WT mice, and CD4 + CD25 - (effector) and CD4 + CD25 lo (exTreg) cells were sorted from lymph nodes of Tbx21 RFP-Cre Foxp3 FL mice for transfer into Tcrb - / - Tcrd - / - mice. Intracellular staining for Foxp3 demonstrates purity of cell populations. b , Weights of Tcrb - / - Tcrd - / - mice receiving CD4 + CD25 + (white squares), CD4 + CD25 - (black squares), and CD4 + CD25 lo (gray squares) cells. c , Percentages and numbers of the indicated T cell populations in spleens of mice analyzed on d62 post transfer. d,e , T-bet + effector alphabetaT cells drive disease upon ablation of T-bet + Treg cells. Lethally irradiated Tcrb - / - Tcrd - / - mice were reconstituted with a 1:1 mix of CD45.2 + Tbx21 RFP-Cre/WT R26 iDTR T-cell depleted bone marrow cells with either CD45.1 + Foxp3 KO , CD45.1 + Foxp3 WT , or CD45.2 + Tcrb KO T-cell depleted bone marrow cells. Mice were injected with 0.5mug diphtheria toxin (DT) on day 0, then treated daily with 0.1mug DT for 22 days before analysis. d , Weight loss in Tbx21 RFP-Cre/WT R26 iDTR :Foxp3 KO (red line) vs. Tbx21 RFP-Cre/WT R26 iDTR :Foxp3 WT (black line) vs. Tbx21 RFP-Cre/WT R26 iDTR :Tcrb KO (blue line) reconstituted mice. e , Representative fl
- Submitted by
- Invitrogen Antibodies (provider)
- Main image
- Experimental details
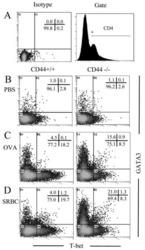
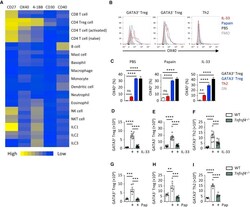
- Figure 2 OX40 Is Critical for Th2 and Treg Cell Response to IL-33 and Papain (A) TNFRSF gene expression was analyzed in the indicated immune cell populations using IMMGEN and naive lung ILC2 microarray data. (B and C) OX40 expression was analyzed on lung GATA3 + and GATA3 - Treg and Th2 cells on day 5 from WT mice treated with PBS, papain, or IL-33 (i.n., day 0 and 1). Fluorescence minus one (FMO) control was used to establish gating threshold. Percent OX40 + cells were calculated in the indicated populations and treatments and compared to Foxp3 - GATA3 - (DN) CD4 + T cells. (D-F) Lung GATA3 + and GATA3 - Treg and Th2 cells were quantified from WT and Tnfrsf4 -/- mice on day 5 after IL-33 treatment (i.n., day 0 and 1). (G-I) Lung GATA3 + and GATA3 - Treg and Th2 cells were quantified from WT and Tnfrsf4 -/- mice on day 5 after papain (Pap) treatment (i.n., day 0 and 1). Bar graphs indicate mean (+-SEM). (A), two independent datasets per group; (B) and (C), ANOVA, two repeat experiments; (D)-(F), ANOVA, two repeat experiments; (G)-(I), ANOVA, two repeat experiments. *** p

- Submitted by
- Invitrogen Antibodies (provider)
- Main image
- Experimental details
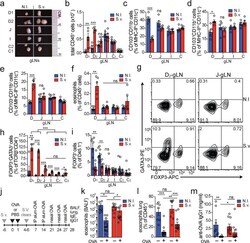
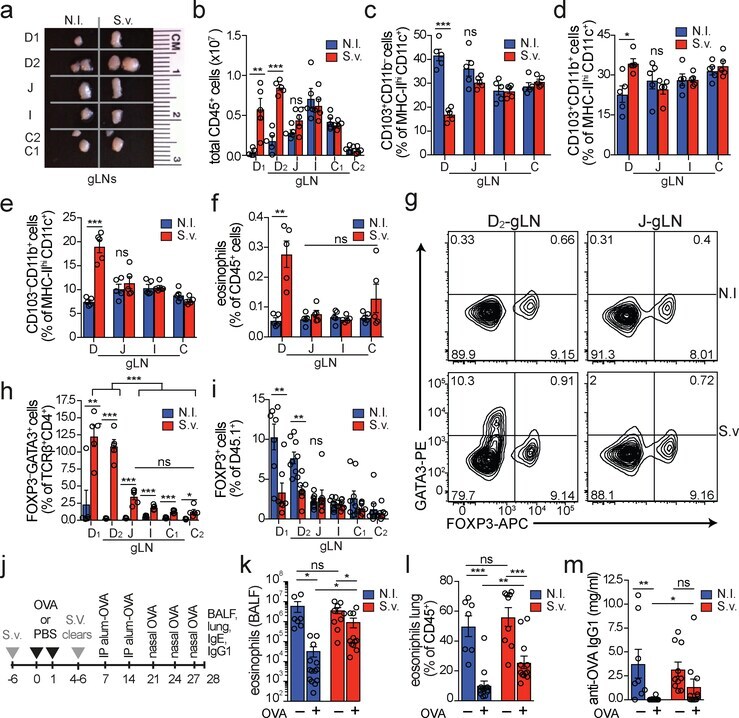
- Figure 4. Duodenal infection leads to a compartmentalized immune conflict in the duodenal gLNs and to compromised oral tolerance. a , Dissected gLNs from non-infected (N.I.) C57BL/6 mice or mice infected with 700 S. venezuelensis (S.v.) larvae 8 days prior to harvest. b , Total CD45 + cell counts ( n =5, represents 3 independent experiments). c-f , Frequency of CD103 + CD11b - ( c ), CD103 + CD11b + ( d ) and CD103 - CD11b + ( e ) among MHCII hi CD11c + cells and eosinophils among CD45 + cells ( f ) ( n =5, represents 2 independent experiments). g , Representative flow cytometry plot of GATA3 + and FOXP3 + CD4 + T cells. h , Frequency of GATA3 + CD4 + T cells ( n =5, represents 3 independent experiments). i , Frequency of total FOXP3 + among CD45.1 + cells in gLNs 64 h post adoptive transfer of 1 x 10 6 naive CD45.1 + OT-II cells into CD45.2 mice ( n =8, pool of 2 independent experiments) infected with S.v. larvae or N.I. 8 days and gavaged with OVA 48 h and 24 h prior to analysis. j , Scheme of oral tolerance experimental set-up in S.v. infected mice. k - m , Total eosinophils in bronchoalveolar lavage fluid (BALF) ( k ), frequency of eosinophils among CD45 + cells in lung tissue ( l ) and OVA-specific IgG1 levels in serum ( m ) from mice infected with S.v. or N.I. during antigen feeding (+OVA groups) or no feeding (-OVA groups), at 21 d after first immunization with OVA-alum ( j ) ( n =13 for +OVA groups, n =10 for -OVA groups, pool of 2 independent experiments). LN abbrevi
- Submitted by
- Invitrogen Antibodies (provider)
- Main image
- Experimental details
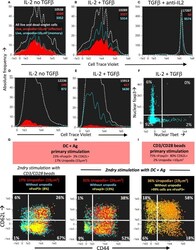
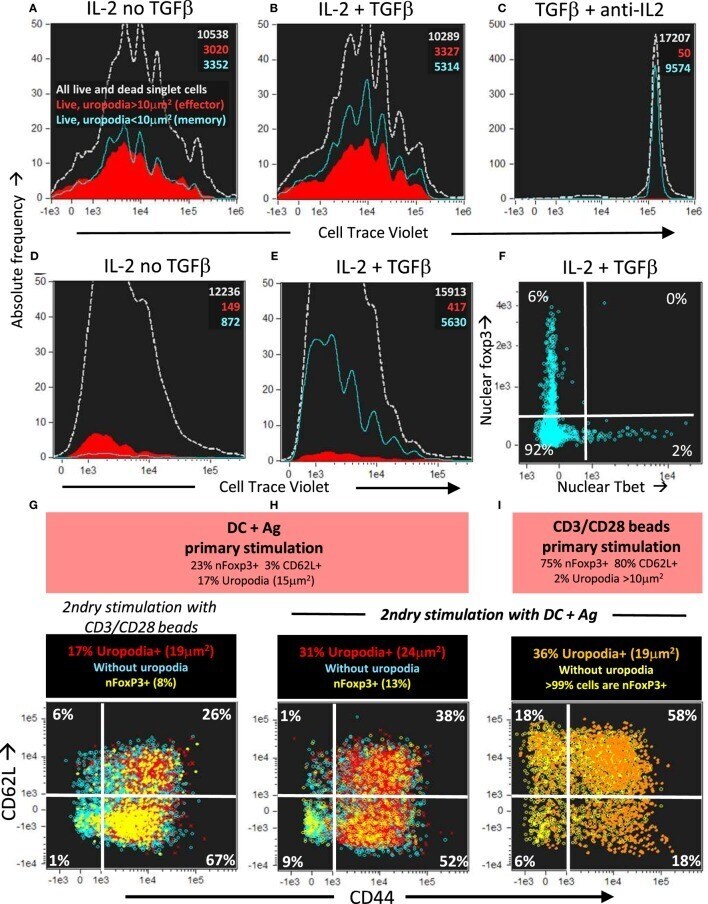
- Figure 14 Long-lived memory CD4 + T cells, without uropodia, have a lower threshold for re-stimulation, when they make further, independent fate decisions to develop uropodia or re-express CD62L. (A-C) Cell trace violet (CTV) labeled female A1RAG CD4 + T cells were stimulated with bone marrow-derived dendritic cells (bmDC) + 100 nM Dby for 3 days in the presence of IL2 (50 U/ml) without TGFbeta (A) , IL2 (50 U/ml) plus TGFbeta (2 ng/ml) (B) , or TGFbeta plus anti-IL2 (clone S4B6, 50 ug/ml) (C) . Cells were "" in situ "" labeled with live/dead aqua, fixed and permeabilized, then 7AAD. Histograms show the absolute frequencies of CTV dilution, with gray dashed lines for all images (both live and dead), while filled red (cells with uropodia >10 mm 2 ) and blue line (cells without uropodia) histograms are gated for live cells only (live/dead aqua negative, bright field contrast low). Total numbers of cells in each histogram are indicated. One of two similar experiments is shown. (D-F) CTV labeled female MARKI CD4 + T cells were stimulated with bmDC + 10 nM Dby peptide with IL2 (50 U/ml) either with (E,F) or without (D) TGFbeta (2 ng/ml) for 10 days. Cells were "" in situ "" labeled with live/dead aqua and Mitotracker DR (not shown), fixed and permeabilized, then Tbet-Alexa488, foxp3-PE-Cy7, (GATA3-PE, RORgammat-PE-CF594, CD4-APC-Cy7, all not shown), and 7AAD. Histograms of absolute frequencies of CTV dilution for total live and dead singlet cells (dashed gray), live cells with (fi
- Submitted by
- Invitrogen Antibodies (provider)
- Main image
- Experimental details
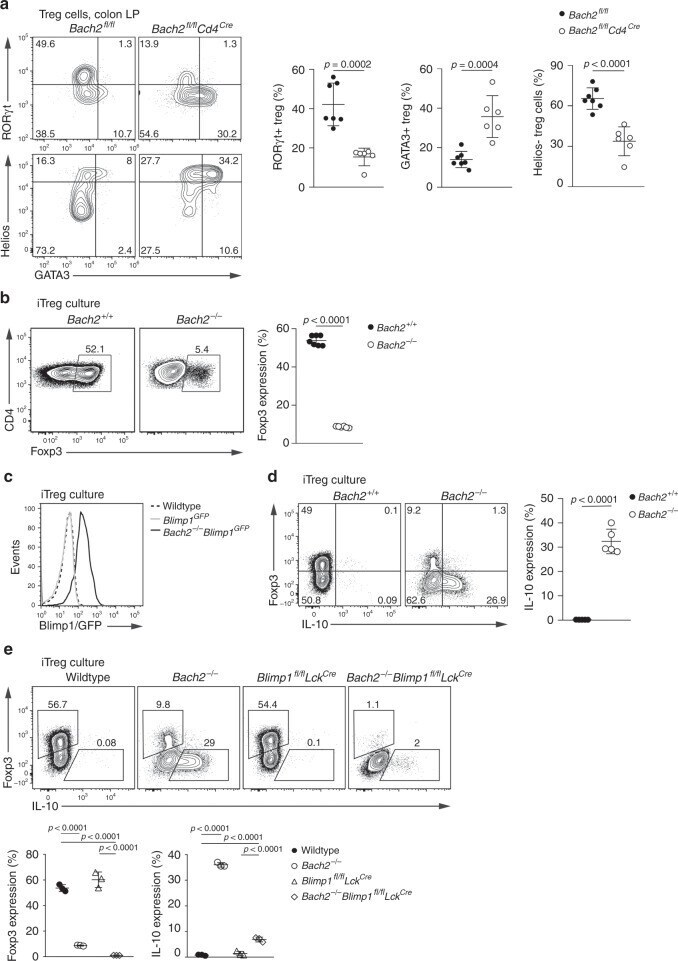
- Fig. 4 Bach2 is intrinsically required for pTreg cell differentiation. a Flow cytometry plots and quantification showing GATA3, RORgammat and Helios expression by Treg cells from the colonic lamina propria of Bach2 fl/fl Cd4 Cre and control mice. b Flow cytometry plots showing Foxp3 expression by wildtype and Bach2 -/- CD4 T cells after three days in Treg cell-inducing culture conditions, and frequency of Foxp3-expressing cells (right). c Histograms showing Blimp1-GFP expression by Blimp1 GFP and Bach2 -/- Blimp1 GFP CD4 T cells after culture in Treg cell-inducing conditions. Dashed line indicates background fluorescence levels in non-reporter cells. d Flow cytometry plots showing Foxp3 and IL-10 expression by wildtype and Bach2 -/- CD4 T cells after Treg cell-inducing culture, and quantification (right). e Flow cytometry plots showing Foxp3 expression by wildtype, Bach2 -/- , Blimp1 fl/fl Lck Cre and Bach2 -/- Blimp1 fl/fl Lck Cre after three days culture in Treg cell-inducing conditions, and frequency of Foxp3 and IL-10 expressing cells (below). Flow cytometry plots are representative, data pooled from ( a ) or representative of two ( c - e ) or six ( b ) independent experiments. Statistical significance tested using two-way ANOVA with Tukey's test ( e ). Otherwise, significance was tested using the unpaired Student's t- test. Error bars denote mean +- S.D. Source data are provided as a Source Data file.