Explore
 Validate
 Learn
Learn Western blot
 Immunohistochemistry
Antibody data
- Antibody Data
- Antigen structure
- References [3]
- Comments [0]
- Validations
- Immunohistochemistry [4]
- Chromatin Immunoprecipitation [2]
- Other assay [1]
Submit
Validation data
Reference
Comment
Report error
- Product number
- PA5-20892 - Provider product page

- Provider
- Invitrogen Antibodies
- Product name
- GATA3 Polyclonal Antibody
- Antibody type
- Polyclonal
- Antigen
- Synthetic peptide
- Description
- A suggested positive control is human brain tissue lysate. PA5-20892 can be used with blocking peptide PEP-1006.
- Reactivity
- Human, Mouse, Rat
- Host
- Rabbit
- Isotype
- IgG
- Vial size
- 100 μg
- Concentration
- 1 mg/mL
- Storage
- Maintain refrigerated at 2-8°C for up to 3 months. For long term storage store at -20°C
Submitted references VX-765 reduces neuroinflammation after spinal cord injury in mice.
TET2 directs mammary luminal cell differentiation and endocrine response.
CRID3, a blocker of apoptosis associated speck like protein containing a card, ameliorates murine spinal cord injury by improving local immune microenvironment.
Chen J, Chen YQ, Shi YJ, Ding SQ, Shen L, Wang R, Wang QY, Zha C, Ding H, Hu JG, Lü HZ
Neural regeneration research 2021 Sep;16(9):1836-1847
Neural regeneration research 2021 Sep;16(9):1836-1847
TET2 directs mammary luminal cell differentiation and endocrine response.
Kim MR, Wu MJ, Zhang Y, Yang JY, Chang CJ
Nature communications 2020 Sep 15;11(1):4642
Nature communications 2020 Sep 15;11(1):4642
CRID3, a blocker of apoptosis associated speck like protein containing a card, ameliorates murine spinal cord injury by improving local immune microenvironment.
Chen YQ, Wang SN, Shi YJ, Chen J, Ding SQ, Tang J, Shen L, Wang R, Ding H, Hu JG, Lü HZ
Journal of neuroinflammation 2020 Aug 29;17(1):255
Journal of neuroinflammation 2020 Aug 29;17(1):255
No comments: Submit comment
Supportive validation
- Submitted by
- Invitrogen Antibodies (provider)
- Main image

- Experimental details
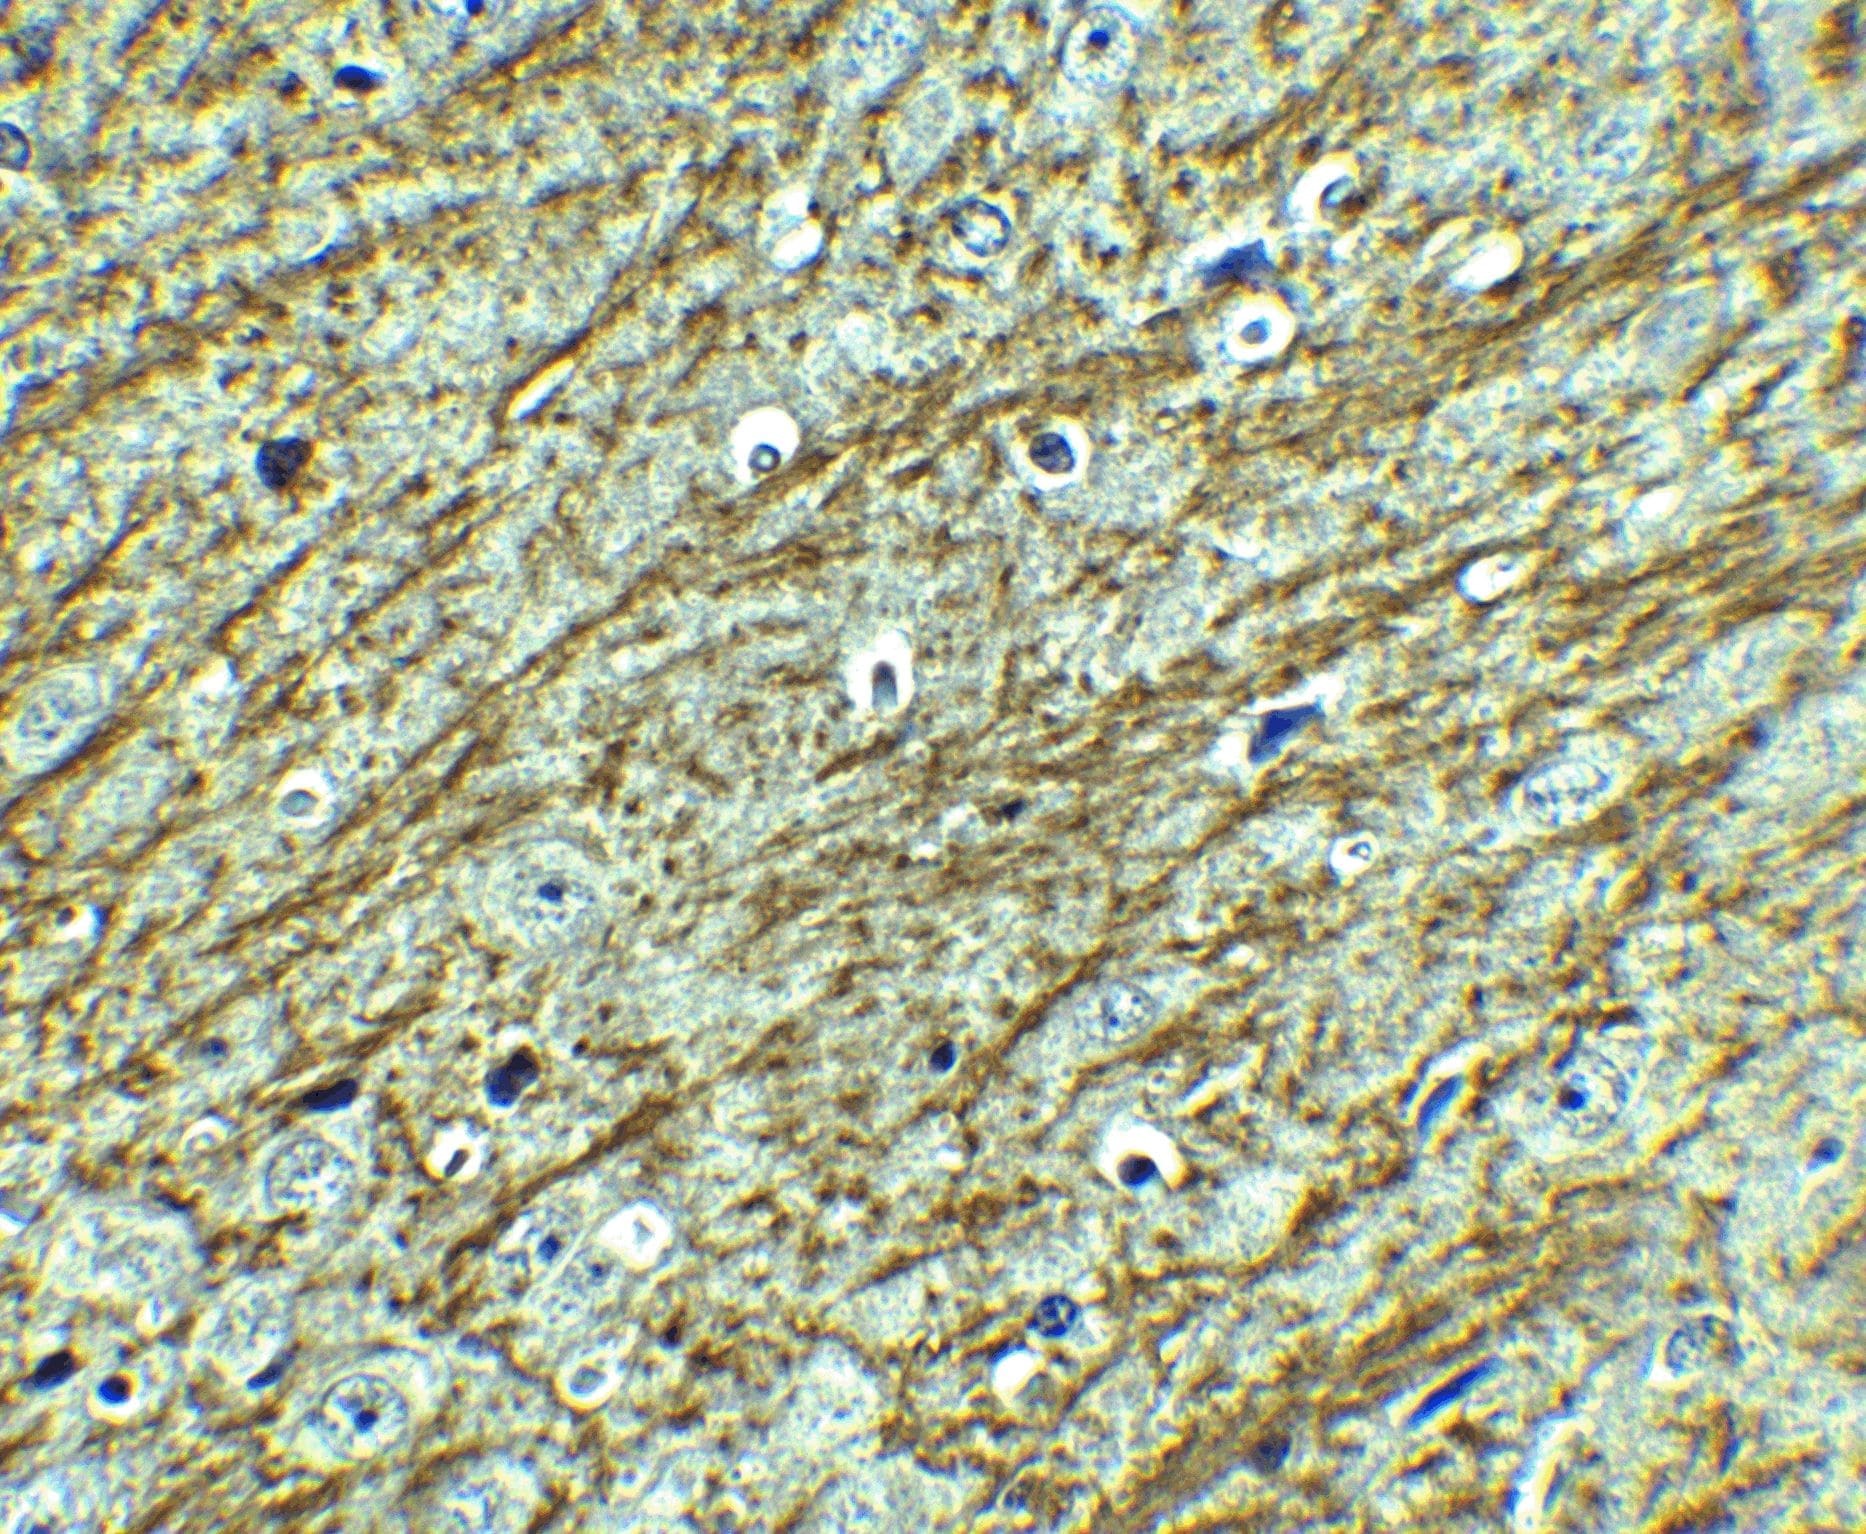
- Immunohistochemistry of GATA3 in mouse brain tissue with GATA3 Polyclonal Antibody (Product # PA5-20892) at 2.5 µg/mL.
- Submitted by
- Invitrogen Antibodies (provider)
- Main image

- Experimental details
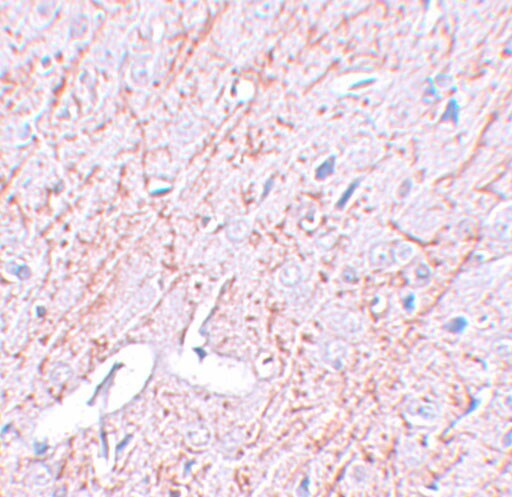
- Immunohistochemistry of GATA3 in rat brain tissue with GATA3 Polyclonal Antibody (Product # PA5-20892) at 2.5 µg/mL.
- Submitted by
- Invitrogen Antibodies (provider)
- Main image

- Experimental details
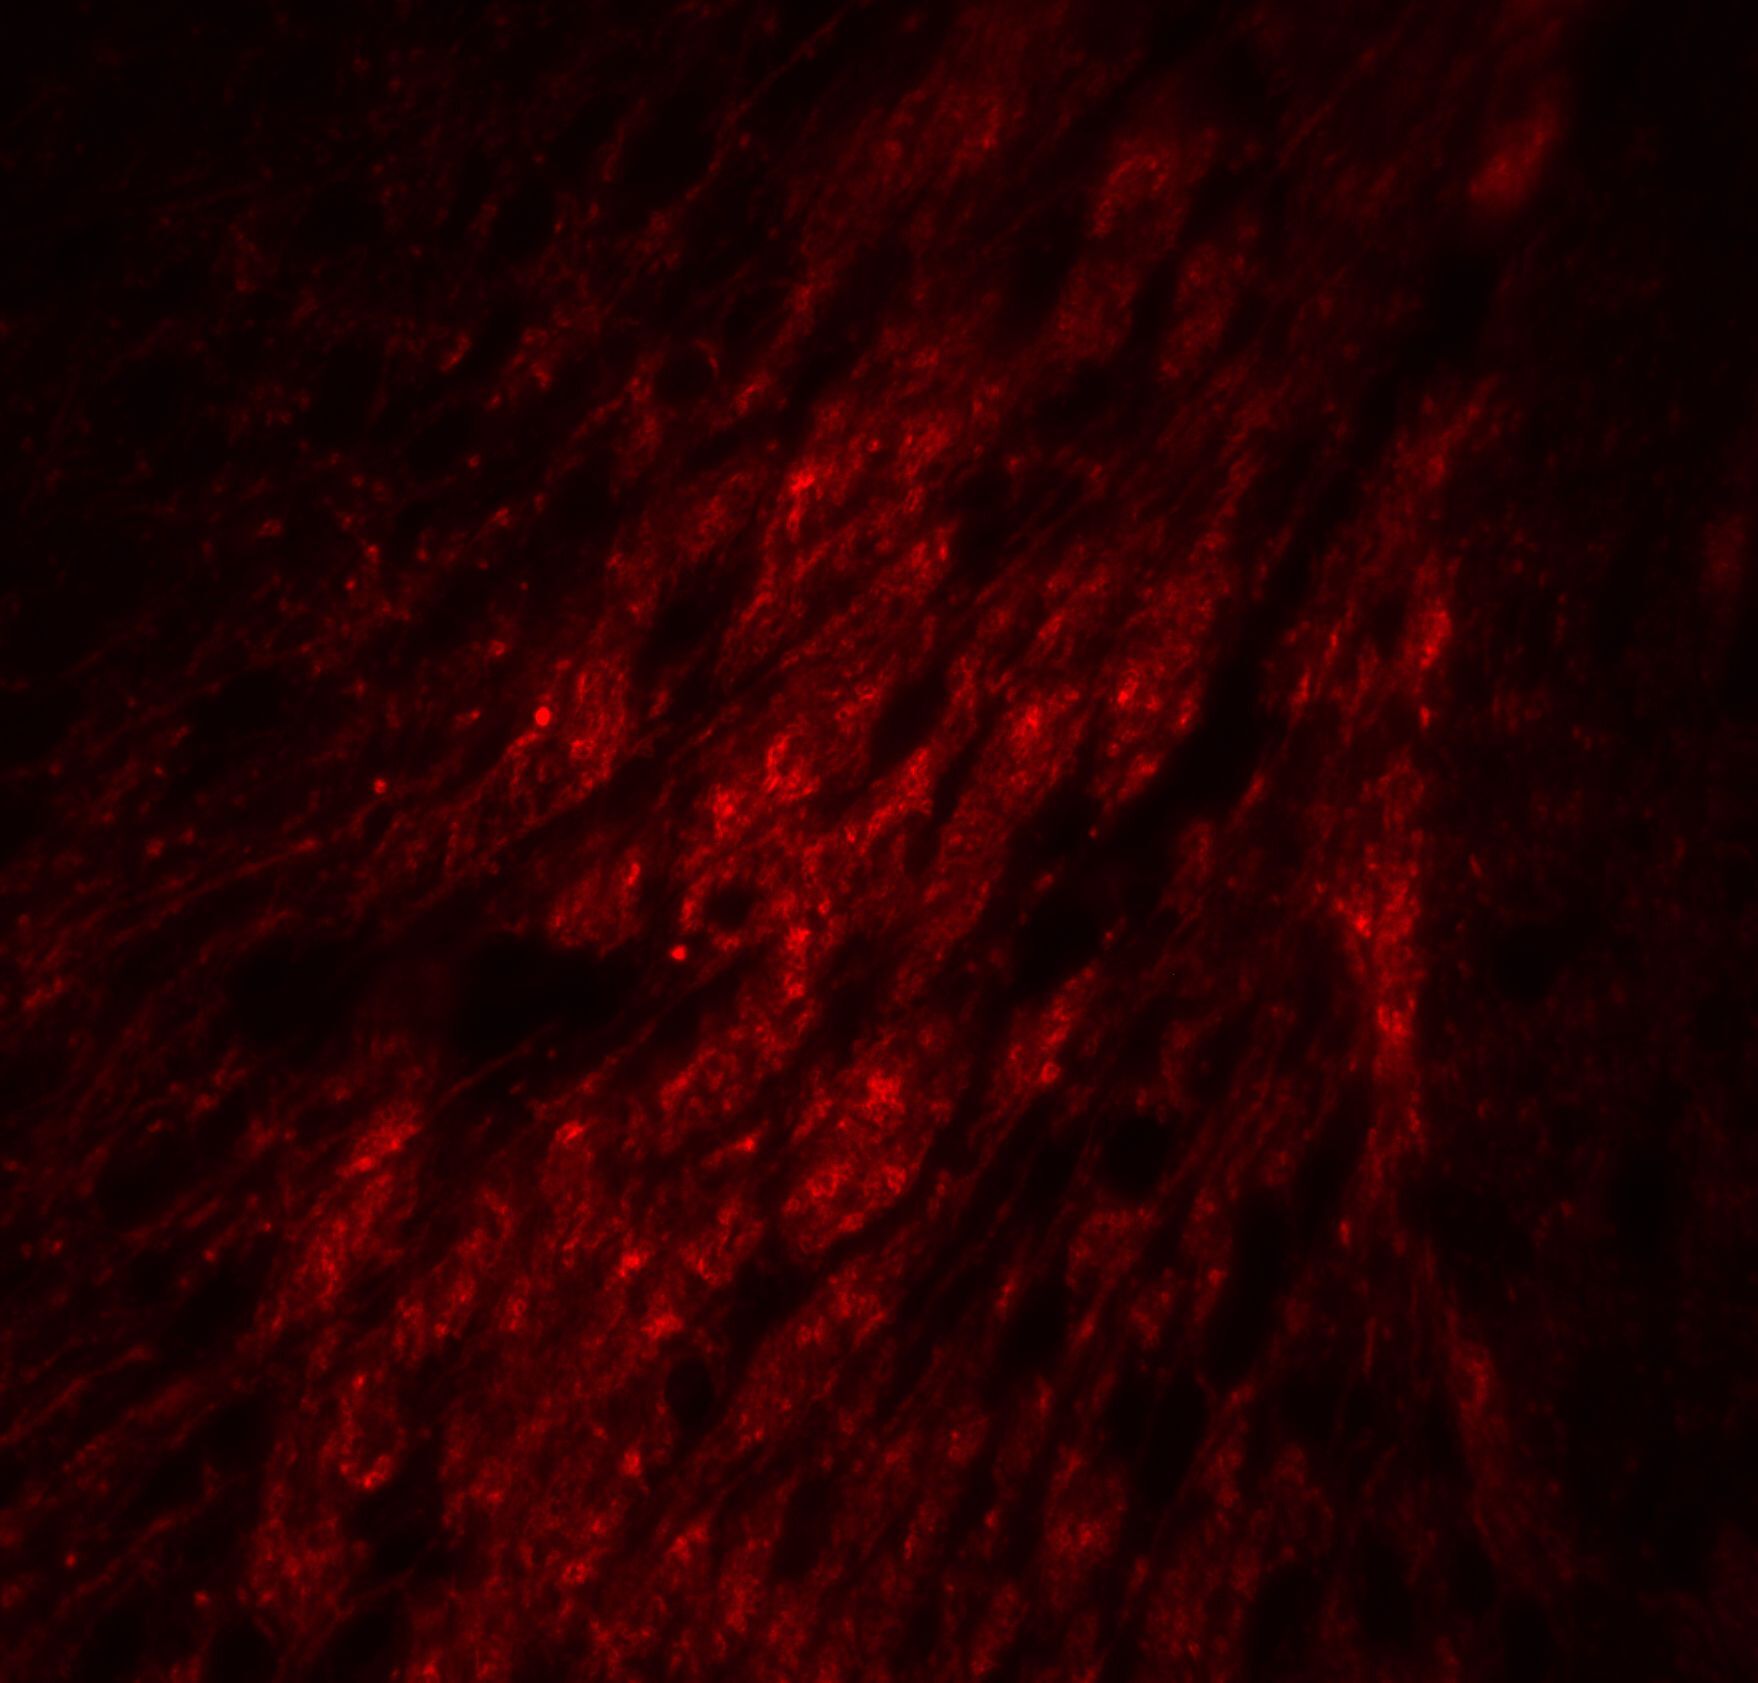
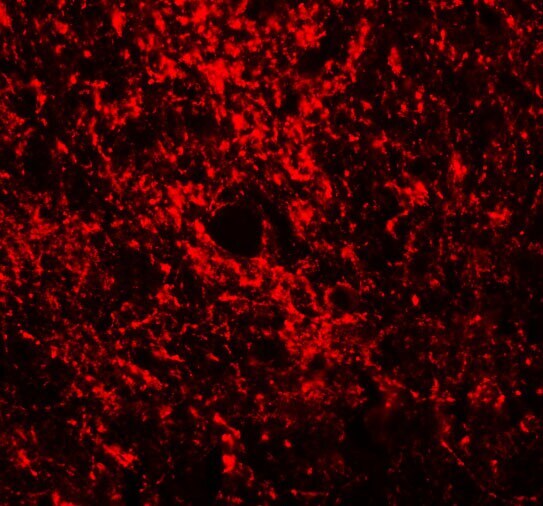
- Immunofluorescence of GATA3 in mouse brain tissue with GATA3 Polyclonal Antibody (Product # PA5-20892) at 20 µg/mL.
- Submitted by
- Invitrogen Antibodies (provider)
- Main image

- Experimental details
- Immunofluorescence of GATA3 in Rat Brain tissue with GATA3 Polyclonal Antibody (Product # PA5-20892) at 20 µg/mL.
Supportive validation
- Submitted by
- Invitrogen Antibodies (provider)
- Main image

- Experimental details
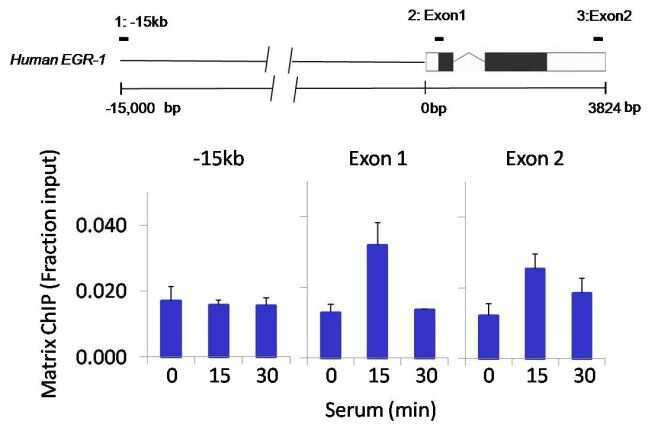
- Chromatin immunoprecipitation analysis of GATA3 was performed using cross-linked chromatin from 1x10^6 HCT116 colon carcinoma cells treated with serum for 0, 15, and 30 minutes. Immunoprecipitation was performed using a multiplex microplate Matrix ChIP assay (see reference for Matrix ChIP protocol: http://www.ncbi.nlm.nih.gov/pubmed/22098709) with 1.0 µL/100 µL well volume of a GATA3 polyclonal antibody (Product # PA5-20892). Chromatin aliquots from ~1x10^5 cells were used per ChIP pull-down. Quantitative PCR data were done in quadruplicate using 1 µL of eluted DNA in 2 µL SYBR real-time PCR reactions containing primers to amplify -15kb upstream of the Egr1 gene or exon-1 or exon-2 of Egr1. PCR calibration curves were generated for each primer pair from a dilution series of sheared total genomic DNA. Quantitation of immunoprecipitated chromatin is presented as signal relative to the total amount of input chromatin. Results represent the mean +/- SEM for three experiments. A schematic representation of the Egr-1 locus is shown above the data where boxes represent exons (black boxes = translated regions, white boxes = untranslated regions), the zigzag line represents an intron, and the straight line represents upstream sequence. Regions amplified by Egr-1 primers are represented by black bars. Data courtesy of the Innovators Program.
- Submitted by
- Invitrogen Antibodies (provider)
- Main image

- Experimental details
- Chromatin immunoprecipitation analysis of GATA3 was performed using cross-linked chromatin from 1x10^6 HCT116 colon carcinoma cells treated with serum for 0, 15, and 30 minutes. Immunoprecipitation was performed using a multiplex microplate Matrix ChIP assay (see reference for Matrix ChIP protocol: http://www.ncbi.nlm.nih.gov/pubmed/22098709) with 1.0 µL/100 µL well volume of a GATA3 polyclonal antibody (Product # PA5-20892). Chromatin aliquots from ~1x10^5 cells were used per ChIP pull-down. Quantitative PCR data were done in quadruplicate using 1 µL of eluted DNA in 2 µL SYBR real-time PCR reactions containing primers to amplify -15kb upstream of the Egr1 gene or exon-1 or exon-2 of Egr1. PCR calibration curves were generated for each primer pair from a dilution series of sheared total genomic DNA. Quantitation of immunoprecipitated chromatin is presented as signal relative to the total amount of input chromatin. Results represent the mean +/- SEM for three experiments. A schematic representation of the Egr-1 locus is shown above the data where boxes represent exons (black boxes = translated regions, white boxes = untranslated regions), the zigzag line represents an intron, and the straight line represents upstream sequence. Regions amplified by Egr-1 primers are represented by black bars. Data courtesy of the Innovators Program.

Supportive validation
- Submitted by
- Invitrogen Antibodies (provider)
- Main image
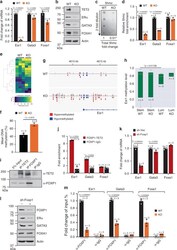
- Experimental details
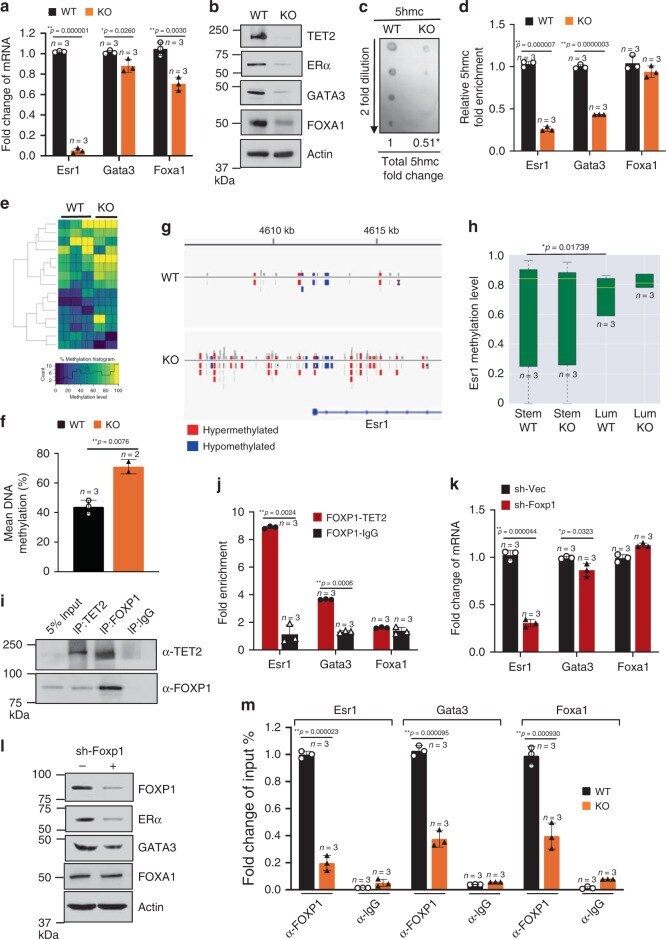
- Fig. 2 TET2-FOXP1 transcription complex mediates gene expression associated with luminal cell differentiation. a , b Expression levels of the indicated genes and proteins (ERalpha, GATA3, FOXA1, n = 3 animals/group), c dot blot showing total 5hmc levels and fold change of 5hmc (KO vs. WT), d fold enrichment of 5hmc in Esr1 , Gata3 , and Foxa1 genes of mammary epithelial cells from 7-week-old WT and KO female mice ( n = 3 animals/group). e Heat map showing visualization and grouping of the samples based on differential DNA methylation, and f bar graph showing mean DNA methylation levels across genome from biologically independent mammary epithelial DNA samples of 7-week-old WT and KO female mice (WT n = 3, KO n = 2 animals). g Representative methylation track providing visualization of DNA methylation status surrounding Esr1 gene of mammary epithelial cells from 7-week-old WT and KO female mice (WT n = 3, KO n = 2 animals). h Distribution of targeted bisulfite methylation level of Esr1 of sorted MaSC-enriched cells (Stem, Lin - CD24 + CD29 hi ) and Luminal cells (Lum, Lin - CD24 + CD29 lo ) from 7-week-old WT and KO female mice ( n = 3 animals/group). Boxplot showing the 2nd quartile (median) as a yellow line, and 1st quartile and 3rd quartile as the bottom and upper bounds of the box, respectively. The upper whisker extends from the upper edge of the box to the largest value no further than 1.5*IQR (interquartile range) from the edge. The lower whisker extends from the lower