 Explore
 Validate
 Learn
LearnPA5-54098
antibody from Invitrogen Antibodies
Targeting: WIPI2
ATG18B, ATG21, CGI-50, DKFZP434J154, DKFZp686P02188, FLJ12979, FLJ14217, FLJ42984
 Western blot
 Immunocytochemistry
Antibody data
- Antibody Data
- Antigen structure
- References [1]
- Comments [0]
- Validations
- Immunocytochemistry [2]
- Immunohistochemistry [1]
- Other assay [1]
Submit
Validation data
Reference
Comment
Report error
- Product number
- PA5-54098 - Provider product page

- Provider
- Invitrogen Antibodies
- Product name
- WIPI2 Polyclonal Antibody
- Antibody type
- Polyclonal
- Antigen
- Recombinant protein fragment
- Description
- Immunogen sequence: ECALMKQHRL DGSLETTNEI LDSASHDCPL VTQTYGAAAG KGTYVPSSPT RLAYTDDLGA VGGACLEDEA SALRLDEDSE HPPMILRTD Highest antigen sequence identity to the following orthologs: Mouse - 83%, Rat - 84%.
- Reactivity
- Human, Mouse, Rat
- Host
- Rabbit
- Isotype
- IgG
- Vial size
- 100 μL
- Concentration
- 0.4 mg/mL
- Storage
- Store at 4°C short term. For long term storage, store at -20°C, avoiding freeze/thaw cycles.
Submitted references Mitochondrial Complex I Activity Is Required for Maximal Autophagy.
Thomas HE, Zhang Y, Stefely JA, Veiga SR, Thomas G, Kozma SC, Mercer CA
Cell reports 2018 Aug 28;24(9):2404-2417.e8
Cell reports 2018 Aug 28;24(9):2404-2417.e8
No comments: Submit comment
Supportive validation
- Submitted by
- Invitrogen Antibodies (provider)
- Main image

- Experimental details
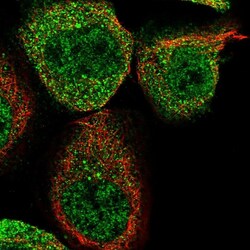
- Immunofluorescent staining of WIPI2 in human cell line A-431 shows positivity in cytoplasm & nucleus but excluded from the nucleoli. Samples were probed using a WIPI2 Polyclonal Antibody (Product # PA5-54098).

- Submitted by
- Invitrogen Antibodies (provider)
- Main image
- Experimental details
- Immunofluorecent analysis of WIPI2 in human cell line A-431 using WIPI2 Polyclonal Antibody (Product # PA5-54098). Staining shows localization to nucleoplasm and cytosol.

Supportive validation
- Submitted by
- Invitrogen Antibodies (provider)
- Main image
- Experimental details
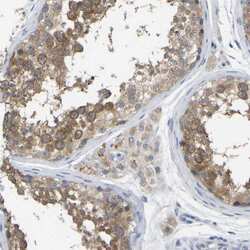
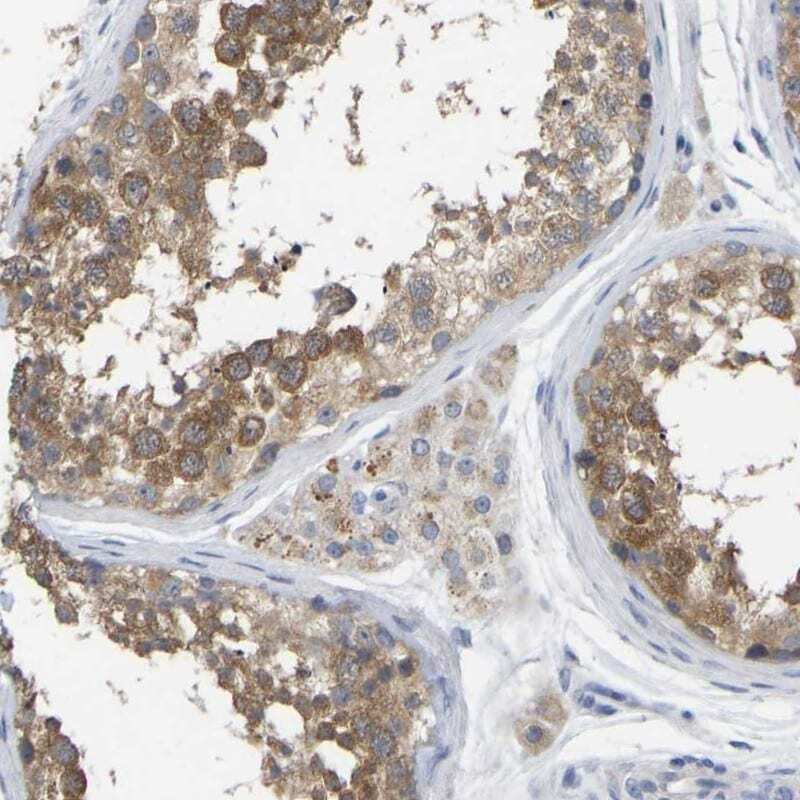
- Immunohistochemical staining of WIPI2 in human testis using a WIPI2 Polyclonal Antibody (Product # PA5-54098) shows cytoplasmic positivity in cells in seminiferous ducts and Leydig cells.
Supportive validation
- Submitted by
- Invitrogen Antibodies (provider)
- Main image
- Experimental details
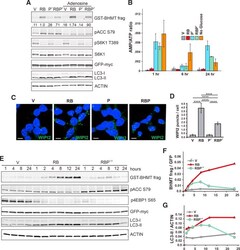
- Figure 4. Phenformin Suppresses the Initiation, Amplitude, and Duration ofAutophagy (A) GST-BHMT assay in cells treated for 6 hr with V, RB, P 1 ,RBP 1 , with or without 1 mM adenosine. (B) Bar graph of AMP/ATP ratios in HEK293 cells treated with V, RB,P 1 , RBP 1 , or starved of glucose. (C and D) Immunofluorescence of WIPI2 in HEK293T cells treated for 2hr. Representative confocal images (C) and quantification of WIPI2 puncta (D).Scale bar is 10 mum. (E-G) GST-BHMT time course assay in cells treated with V, RB, orRBP 1.5 , as shown by western blotting (E) and graphs of BHMTfrag/GFP ratios (F) and LC3-II/ACTIN ratios (G).
