Explore
 Validate
 Learn
LearnMA5-14904
antibody from Invitrogen Antibodies
Targeting: AURKA
AIK, ARK1, AurA, BTAK, PPP1R47, STK15, STK6, STK7
 Western blot
 Immunocytochemistry
Antibody data
- Antibody Data
- Antigen structure
- References [3]
- Comments [0]
- Validations
- Immunocytochemistry [6]
- Other assay [6]
Submit
Validation data
Reference
Comment
Report error
- Product number
- MA5-14904 - Provider product page

- Provider
- Invitrogen Antibodies
- Product name
- Phospho-Aurora A (Thr288) Monoclonal Antibody (F.131.2)
- Antibody type
- Monoclonal
- Antigen
- Synthetic peptide
- Description
- It is not recommended to aliquot this antibody.
- Reactivity
- Human
- Host
- Rabbit
- Isotype
- IgG
- Antibody clone number
- F.131.2
- Vial size
- 100 μL
- Concentration
- 334 μg/mL
- Storage
- -20°C
Submitted references LPA signaling acts as a cell-extrinsic mechanism to initiate cilia disassembly and promote neurogenesis.
CoA synthase regulates mitotic fidelity via CBP-mediated acetylation.
A FRET biosensor reveals spatiotemporal activation and functions of aurora kinase A in living cells.
Hu HB, Song ZQ, Song GP, Li S, Tu HQ, Wu M, Zhang YC, Yuan JF, Li TT, Li PY, Xu YL, Shen XL, Han QY, Li AL, Zhou T, Chun J, Zhang XM, Li HY
Nature communications 2021 Jan 28;12(1):662
Nature communications 2021 Jan 28;12(1):662
CoA synthase regulates mitotic fidelity via CBP-mediated acetylation.
Lin CC, Kitagawa M, Tang X, Hou MH, Wu J, Qu DC, Srinivas V, Liu X, Thompson JW, Mathey-Prevot B, Yao TP, Lee SH, Chi JT
Nature communications 2018 Mar 12;9(1):1039
Nature communications 2018 Mar 12;9(1):1039
A FRET biosensor reveals spatiotemporal activation and functions of aurora kinase A in living cells.
Bertolin G, Sizaire F, Herbomel G, Reboutier D, Prigent C, Tramier M
Nature communications 2016 Sep 14;7:12674
Nature communications 2016 Sep 14;7:12674
No comments: Submit comment
Supportive validation
- Submitted by
- Invitrogen Antibodies (provider)
- Main image

- Experimental details
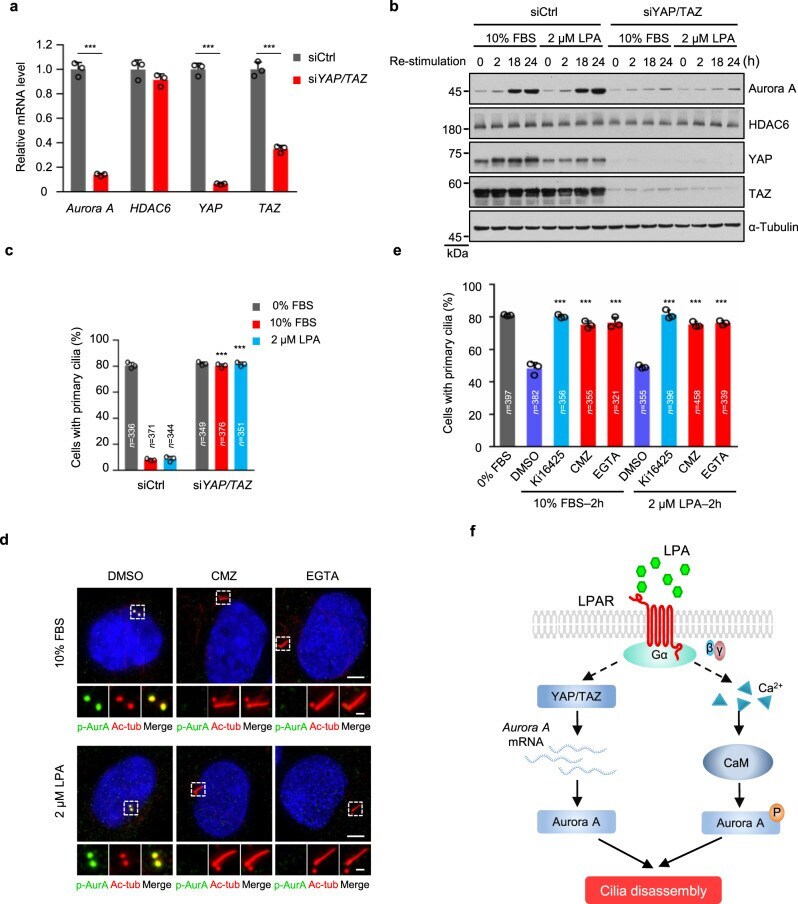
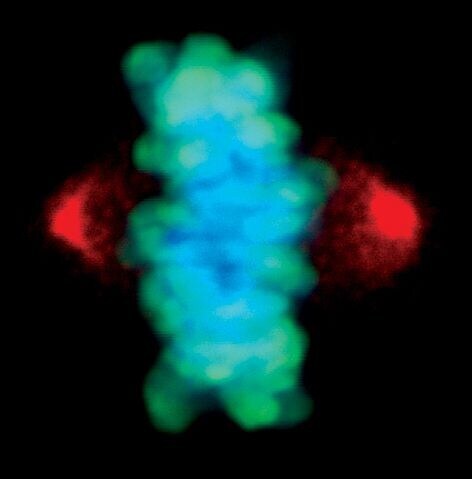
- Immunofluorescent analysis of Phospho-Aurora A pThr288 in mitotic HeLa cells during metaphase using a Phospho-Aurora A pThr288 monoclonal antibody (Product # MA5-14904) (red) and a Phospho-Histone H3 (Ser10) monoclonal antibody (green). DNA is labeled using a fluorescent blue dye.

- Submitted by
- Invitrogen Antibodies (provider)
- Main image
- Experimental details
- Immunofluorescent analysis of Phospho-Aurora A pThr288 in mitotic HeLa cells during metaphase anaphase using a Phospho-Aurora A pThr288 monoclonal antibody (Product # MA5-14904) (red) and a Phospho-Histone H3 (Ser10) monoclonal antibody (green). DNA is labeled using a fluorescent blue dye.

- Submitted by
- Invitrogen Antibodies (provider)
- Main image

- Experimental details
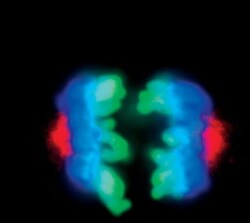
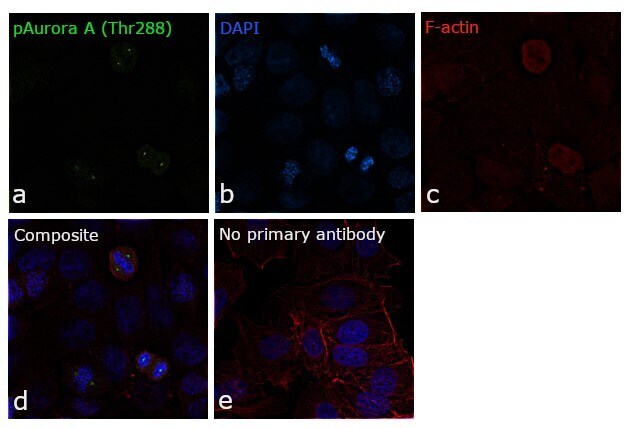
- Immunofluorescence analysis of Phospho-Aurora A (Thr288) was performed using 70% confluent log phase MCF7 cells. The cells were fixed with 4% paraformaldehyde for 10 minutes, permeabilized with 0.1% Triton™ X-100 for 15 minutes, and blocked with 1% BSA for 1 hour at room temperature. The cells were labeled with Phospho-Aurora A (Thr288) Monoclonal Antibody (F.131.2) (Product # MA5-14904) at 1:250 dilution in 0.1% BSA, incubated at 4 degree Celsius overnight and then labeled with Goat anti-Mouse IgG (H+L) Superclonal™ Secondary Antibody, Alexa Fluor® 488 conjugate (Product # A28175) for 45 minutes at room temperature (Panel a: green). Nuclei (Panel b: blue) were stained with ProLong™ Diamond Antifade Mountant with DAPI (Product # P36962). F-actin (Panel c: red) was stained with Rhodamine Phalloidin (Product # R415, 1:300). Panel d represents the merged image showing localization to spindle poles in dividing cells. Panel e represents control cells with no primary antibody to assess background. The images were captured at 60X magnification.

- Submitted by
- Invitrogen Antibodies (provider)
- Main image

- Experimental details
- Immunofluorescent analysis of Phospho-Aurora A pThr288 in mitotic HeLa cells during metaphase using a Phospho-Aurora A pThr288 monoclonal antibody (Product # MA5-14904) (red) and a Phospho-Histone H3 (Ser10) monoclonal antibody (green). DNA is labeled using a fluorescent blue dye.
- Submitted by
- Invitrogen Antibodies (provider)
- Main image
- Experimental details
- Immunofluorescent analysis of Phospho-Aurora A pThr288 in mitotic HeLa cells during metaphase anaphase using a Phospho-Aurora A pThr288 monoclonal antibody (Product # MA5-14904) (red) and a Phospho-Histone H3 (Ser10) monoclonal antibody (green). DNA is labeled using a fluorescent blue dye.

- Submitted by
- Invitrogen Antibodies (provider)
- Main image

- Experimental details
- Immunofluorescence analysis of Phospho-Aurora A (Thr288) was performed using 70% confluent log phase MCF7 cells. The cells were fixed with 4% paraformaldehyde for 10 minutes, permeabilized with 0.1% Triton™ X-100 for 15 minutes, and blocked with 1% BSA for 1 hour at room temperature. The cells were labeled with Phospho-Aurora A (Thr288) Monoclonal Antibody (F.131.2) (Product # MA5-14904) at 1:250 dilution in 0.1% BSA, incubated at 4 degree Celsius overnight and then labeled with Goat anti-Mouse IgG (H+L) Superclonal™ Secondary Antibody, Alexa Fluor® 488 conjugate (Product # A28175) for 45 minutes at room temperature (Panel a: green). Nuclei (Panel b: blue) were stained with ProLong™ Diamond Antifade Mountant with DAPI (Product # P36962). F-actin (Panel c: red) was stained with Rhodamine Phalloidin (Product # R415, 1:300). Panel d represents the merged image showing localization to spindle poles in dividing cells. Panel e represents control cells with no primary antibody to assess background. The images were captured at 60X magnification.
Supportive validation
- Submitted by
- Invitrogen Antibodies (provider)
- Main image

- Experimental details
- NULL
- Submitted by
- Invitrogen Antibodies (provider)
- Main image
- Experimental details
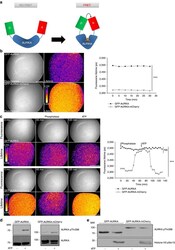
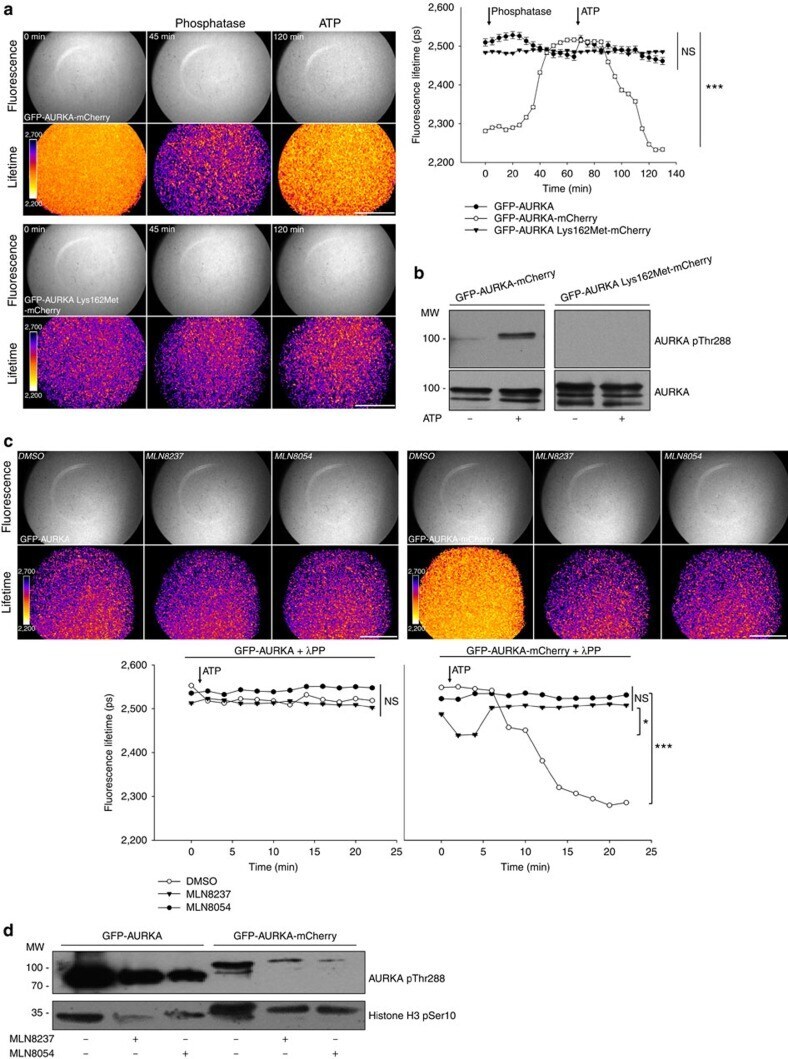
- Figure 1 The AURKA biosensor detects the autophosphorylation of AURKA on Thr288 in vitro . ( a ) Model illustrating the mode of action of the AURKA biosensor. The complete sequence of AURKA is located between the donor (D, EGFP) and the acceptor (A, mCherry) fluorophores. When AURKA is autophosphorylated on Thr288, the kinase undergoes a conformational change bringing the donor and the acceptor in proximity and allowing FRET detection. Of note, the real three-dimensional orientations of the two fluorescent proteins are not known. ( b ) (Left panels) Representative fluorescence (GFP channel) and lifetime images from in vitro FLIM analysis of purified GFP-AURKA and GFP-AURKA-mCherry proteins. (Right panel) The graph illustrates a time-lapse analysis of the fluorescence lifetime of EGFP for both proteins. Images were acquired every 5 min. Data represent means+-s.e.m. of three independent experiments. ( c ) (Left panels) Representative fluorescence (GFP channel) and lifetime images taken at selected time points, and (right panel) corresponding quantification of the in vitro FLIM analysis of GFP-AURKA and GFP-AURKA-mCherry following lamdaPP and ATP treatments. All treatments were performed at 30 degC and images were acquired every 5 min. The addition of lamdaPP and ATP is indicated by an arrow on the graph. Data represent means+-s.e.m. of three independent experiments. The pseudocolour scale in b , c represents pixel-by-pixel lifetimes; conditions and/or time points are indicated
- Submitted by
- Invitrogen Antibodies (provider)
- Main image

- Experimental details
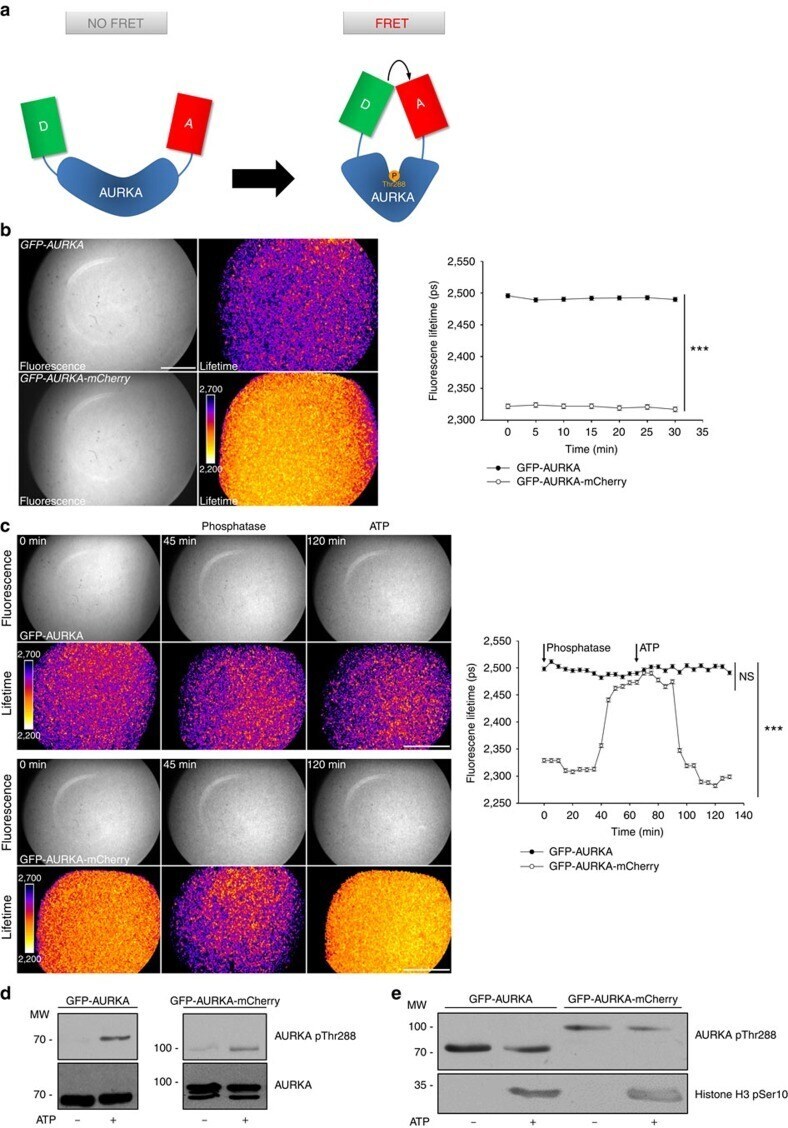
- Figure 2 Autophosphorylation on Thr288 is sufficient for a catalytically active AURKA biosensor in the presence of ATP. ( a ) (Left panels) Representative fluorescence (GFP channel) and lifetime images taken at the indicated time points and (right panel) corresponding quantification of EGFP lifetime images taken every 5 min from GFP-AURKA, GFP-AURKA-mCherry or GFP-AURKA Lys162Met-mCherry samples treated lamdaPP for 1 h at 30 degC, and then incubated with ATP for 1 h at 30 degC. Data represent means+-s.e.m. of three independent experiments. ( b ) In vitro kinase assay and western blot analysis showing the abundance of AURKA pThr288 in samples containing GFP-AURKA-mCherry or the Lys162Met variant following treatment with lamdaPP for 1 h at 30 degC and then incubated or not with ATP for 1 h at the same temperature. ( c ) (Upper panels) Representative fluorescence (GFP channel) and lifetime images, and (lower panels) corresponding quantification of EGFP lifetime from GFP-AURKA or GFP-AURKA-mCherry samples treated with lamdaPP for 1 h at 30 degC, and imaged following the addition of ATP together with dimethylsulfoxide (DMSO), MLN8237 or MLN8054 for 20 min at 37 degC. Images were acquired every 2 min. Data represent means+-s.e.m. of three independent experiments. ( d ) In vitro kinase assay and corresponding western blot illustrating the abundance of a Ser10-positive band on histone H3 and of autophosphorylated AURKA after the incubation of GFP-AURKA and GFP-AURKA-mCherry wi
- Submitted by
- Invitrogen Antibodies (provider)
- Main image
- Experimental details
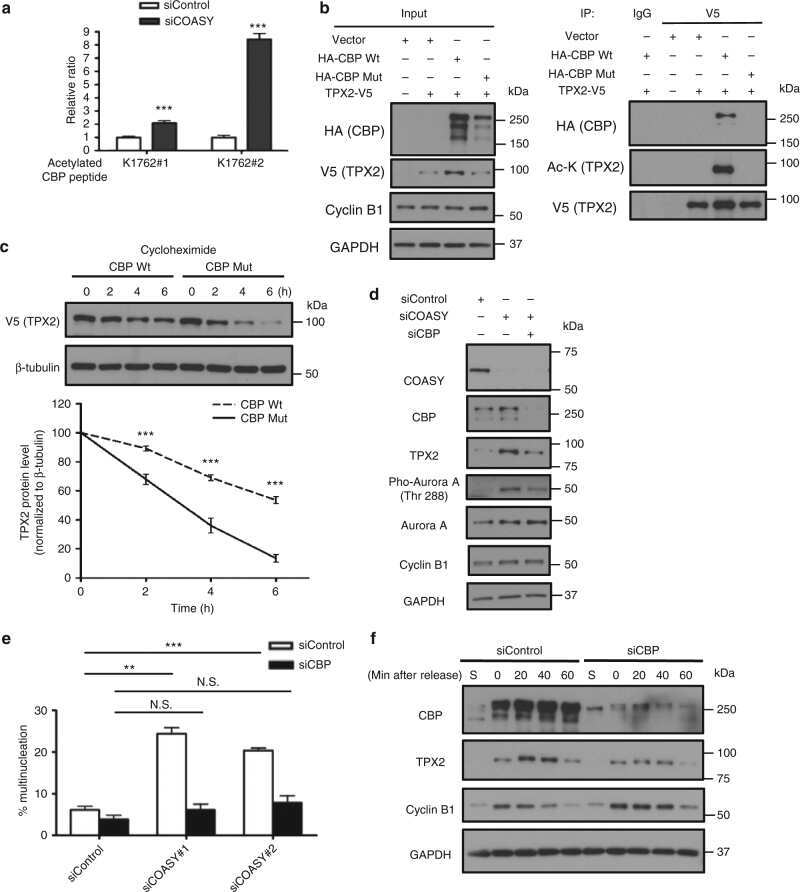
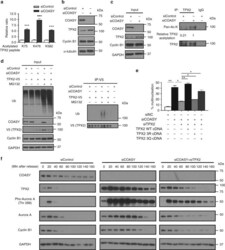
- Fig. 3 TPX2 is the downstream effector of COASY leading to multinucleation and extended mitosis. a COASY knockdown increased three acetylated peptides (K75, K476, and K582) of TPX2 as determined by acetylome analysis. b COASY knockdown increased TPX2 protein level in A549 cells. c COASY knockdown increased the TPX2 acetylation in A549 cells. A549 cells enriched in early mitosis by thymidine-nocodazole block were transfected with control or COASY siRNA and probed with indicated antibodies The TPX2 in the cell lysates were then immunoprecipitated and blotted for pan-acetylated lysine antibody. d COASY knockdown decreased TPX2 ubiquitination in HEK-293T cells. HEK-293T cells were transfected with COASY siRNA and TPX2 cDNA. After MG132 treatment, TPX2 were immunoprecipitated and blotted for pan-ubiquitination antibody. e TPX2 protein expression level and acetylation on TPX2 regulated the percentage of COASY-dependent multinucleation. TPX2 knockdown rescued the multinucleation induced by COASY knockdown. Reintroducing wild type (WT) or acetylation-mimetic mutant (3Q), but not acetylation-deficient (3R), of siRNA-resistant TPX2 cDNA recapitulated multinucleation phenotype. Multinucleation was determined as described in the legend to Fig. 1 . f COASY knockdown triggered increased Aurora A Thr 288 phosphorylation and extended mitosis by the elevation of TPX2. A549 cells were synchronized by thymidine-nocodazole block and released in fresh media for the indicated time (in min). COASY

- Submitted by
- Invitrogen Antibodies (provider)
- Main image
- Experimental details
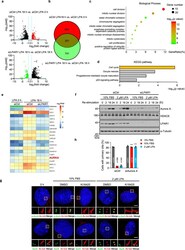
- Fig. 3 LPA signaling initiates cilia disassembly through Aurora A. a Scatter plot analysis of transcriptome expression profiles of siCtrl LPA 18 h versus siCtrl LPA 0 h, and si LPAR1 LPA 18 h versus siCtrl LPA 18 h samples in RPE-1 cells. Red dots and green dots highlight the significantly upregulated or downregulated expressed genes, respectively. b The Venn diagram shows the overlap of upregulated and downregulated genes in a . c Statistics of enriched GO terms display 251 overlapped genes in ( b , the brown part). The size of the point indicates the number of differentially expressed genes in this pathway, and the color of the points corresponds to a different p-value range. d Histogram of the enriched of KEGG pathway of 251 overlapped genes in ( b , the brown part). e Heatmaps showing TOP20 enriched genes in ( b , the brown part). f Immunoblot analysis was carried out using indicated antibodies. RPE-1 cells were starved for 12 h and then transfected with control siRNA or LPAR1 siRNA. Following serum starvation for another 48 h, cells were treated with 10% FBS or 2 muM LPA for indicated time points. g LPA activates Aurora A through phosphorylation in RPE-1. Ciliated RPE-1 cells were pretreated with Ki16425 (40 muM) or DMSO control for 30 min, and then cells were stimulated with 10% FBS or 2 muM LPA for 2 h. Cells were stained with anti-p-AurA (Aurora A, green) and anti-Ac-tub (Ac-tubulin, red) antibodies or anti-AurA (Aurora A, green) and anti-Ac-tub (Ac-tubulin, red) anti

- Submitted by
- Invitrogen Antibodies (provider)
- Main image

- Experimental details
- Fig. 4 LPA signaling modulates Aurora A through YAP/TAZ and calcium/CaM pathway. a YAP/TAZ is required for the LPA-induced the transcription of Aurora A . RPE-1 cells were starved for 12 h and then transfected with control siRNA or YAP/TAZ siRNAs. Following serum starvation for another 48 h, cells were treated with 2 muM LPA for 18 h, and the mRNA levels were measured by qPCR. b Immunoblot analysis in control or YAP/TAZ knockdown cells using indicating antibodies. RPE-1 cells were transfected and treated as described in Fig. 3f . c The effect of serum- or LPA-induced cilia disassembly in control or YAP/TAZ knockdown cells. RPE-1 cells were transfected and treated as described in Fig. 2 b, c . d CMZ or EGTA blocks serum- and LPA- induced Aurora A activation. Ciliated RPE-1 cells were pretreated with CMZ (5 muM), EGTA (0.5 mM) or DMSO control for 30 min, and then cells were stimulated with 10% FBS or 2 muM LPA for 2 h. Cells were stained with anti-p-AurA (Aurora A, green), anti-Ac-tub (Ac-tubulin, red) antibodies. Scale bar: 5 mum (main image) and 1 mum (magnified region). e CMZ or EGTA blocks serum- and LPA- induced cilia disassembly. Ciliated RPE-1 cells were pretreated with Ki16425 (40 muM), CMZ (5 muM), EGTA (0.5 mM) or DMSO control for 30 min, and then cells were stimulated with 10% FBS or 2 muM LPA for 2 h. f A proposed model for LPA signaling in the regulation of cilia disassembly. Source data are provided as a Source Data file. Three experiments were repeated independen