 Explore
 Validate
 Learn
Learn Western blot
 ELISA
ELISA Immunocytochemistry
Antibody data
- Antibody Data
- Antigen structure
- References [9]
- Comments [0]
- Validations
- Immunocytochemistry [2]
- Flow cytometry [1]
- Other assay [7]
Submit
Validation data
Reference
Comment
Report error
- Product number
- 71-9300 - Provider product page

- Provider
- Invitrogen Antibodies
- Product name
- PAK1 Polyclonal Antibody
- Antibody type
- Polyclonal
- Antigen
- Synthetic peptide
- Reactivity
- Human, Mouse, Rat
- Host
- Rabbit
- Isotype
- IgG
- Vial size
- 100 μg
- Concentration
- 0.25 mg/mL
- Storage
- -20°C
Submitted references PAK1 protein expression in the auditory cortex of schizophrenia subjects.
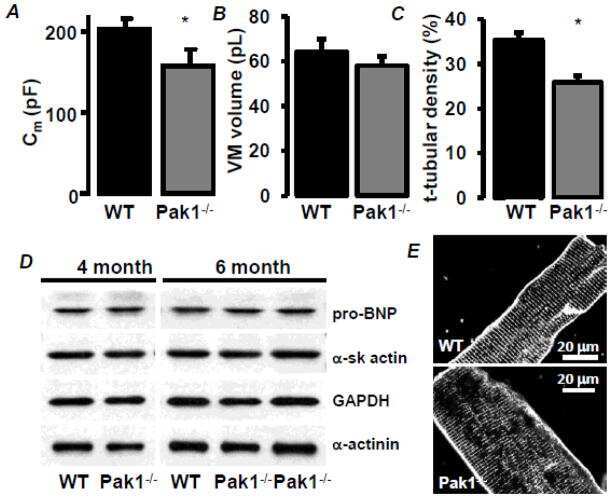
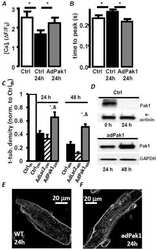
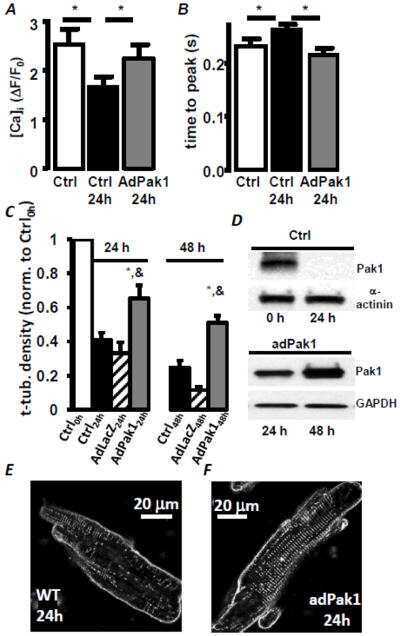
Functional integrity of the T-tubular system in cardiomyocytes depends on p21-activated kinase 1.
Role of group A p21-activated kinases in activation of extracellular-regulated kinase by growth factors.
p21-activated kinase 1 regulates microtubule dynamics by phosphorylating tubulin cofactor B.
Dynein light chain 1 phosphorylation controls macropinocytosis.
Regulation of phosphoglucomutase 1 phosphorylation and activity by a signaling kinase.
TGFbeta1 activates c-Jun and Erk1 via alphaVbeta6 integrin.
Functional inactivation of a transcriptional corepressor by a signaling kinase.
Filamin is essential in actin cytoskeletal assembly mediated by p21-activated kinase 1.
Deo AJ, Goldszer IM, Li S, DiBitetto JV, Henteleff R, Sampson A, Lewis DA, Penzes P, Sweet RA
PloS one 2013;8(4):e59458
PloS one 2013;8(4):e59458
Functional integrity of the T-tubular system in cardiomyocytes depends on p21-activated kinase 1.
DeSantiago J, Bare DJ, Ke Y, Sheehan KA, Solaro RJ, Banach K
Journal of molecular and cellular cardiology 2013 Jul;60:121-8
Journal of molecular and cellular cardiology 2013 Jul;60:121-8
Role of group A p21-activated kinases in activation of extracellular-regulated kinase by growth factors.
Beeser A, Jaffer ZM, Hofmann C, Chernoff J
The Journal of biological chemistry 2005 Nov 4;280(44):36609-15
The Journal of biological chemistry 2005 Nov 4;280(44):36609-15
p21-activated kinase 1 regulates microtubule dynamics by phosphorylating tubulin cofactor B.
Vadlamudi RK, Barnes CJ, Rayala S, Li F, Balasenthil S, Marcus S, Goodson HV, Sahin AA, Kumar R
Molecular and cellular biology 2005 May;25(9):3726-36
Molecular and cellular biology 2005 May;25(9):3726-36
Dynein light chain 1 phosphorylation controls macropinocytosis.
Yang Z, Vadlamudi RK, Kumar R
The Journal of biological chemistry 2005 Jan 7;280(1):654-9
The Journal of biological chemistry 2005 Jan 7;280(1):654-9
Regulation of phosphoglucomutase 1 phosphorylation and activity by a signaling kinase.
Gururaj A, Barnes CJ, Vadlamudi RK, Kumar R
Oncogene 2004 Oct 21;23(49):8118-27
Oncogene 2004 Oct 21;23(49):8118-27
TGFbeta1 activates c-Jun and Erk1 via alphaVbeta6 integrin.
Luettich K, Schmidt C
Molecular cancer 2003 Sep 23;2:33
Molecular cancer 2003 Sep 23;2:33
Functional inactivation of a transcriptional corepressor by a signaling kinase.
Barnes CJ, Vadlamudi RK, Mishra SK, Jacobson RH, Li F, Kumar R
Nature structural biology 2003 Aug;10(8):622-8
Nature structural biology 2003 Aug;10(8):622-8
Filamin is essential in actin cytoskeletal assembly mediated by p21-activated kinase 1.
Vadlamudi RK, Li F, Adam L, Nguyen D, Ohta Y, Stossel TP, Kumar R
Nature cell biology 2002 Sep;4(9):681-90
Nature cell biology 2002 Sep;4(9):681-90
No comments: Submit comment
Supportive validation
- Submitted by
- Invitrogen Antibodies (provider)
- Main image
- Experimental details
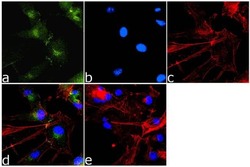
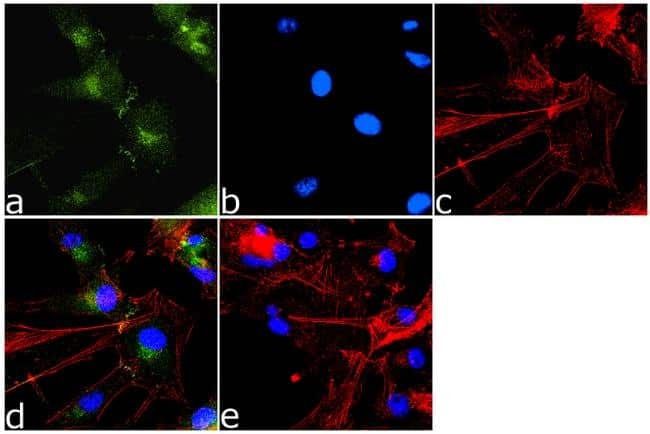
- Immunofluorescence analysis of PAK-1 was done on 70% confluent log phase U87MG cells. The cells were fixed with 4% paraformaldehyde for 10 minutes, permeabilized with 0.1% Triton™ X-100 for 10 minutes, and blocked with 5% BSA for 1 hour at room temperature. The cells were labeled with PAK-1 Rabbit Polyclonal Antibody (Product # 71-9300) at 2 µg/mL in 1% BSA and incubated for 3 hours at room temperature and then labeled with Goat anti-Rabbit IgG (H+L) Superclonal™ Secondary Antibody, Alexa Fluor® 488 conjugate (Product # A27034) at a dilution of 1:2000 for 45 minutes at room temperature (Panel a: green). Nuclei (Panel b: blue) were stained with SlowFade® Gold Antifade Mountant with DAPI (Product # S36938). F-actin (Panel c: red) was stained with Alexa Fluor® 555 Rhodamine Phalloidin (Product # R415, 1:300). Panel d is a merged image showing cytoplasmic localization. Panel e is a no primary antibody control. The images were captured at 60X magnification.
- Submitted by
- Invitrogen Antibodies (provider)
- Main image
- Experimental details
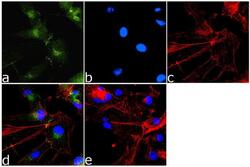
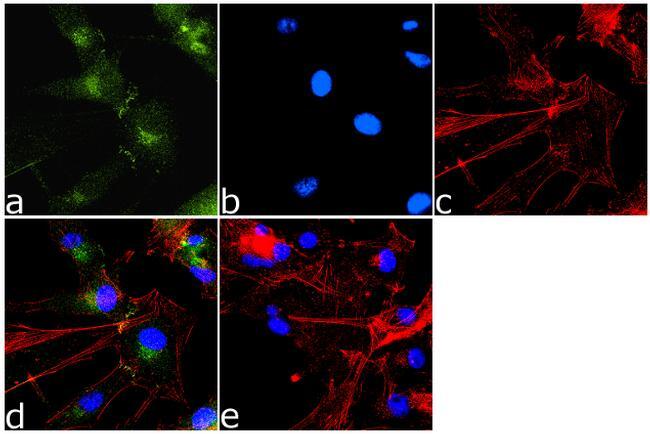
- Immunofluorescence analysis of PAK-1 was done on 70% confluent log phase U87MG cells. The cells were fixed with 4% paraformaldehyde for 10 minutes, permeabilized with 0.1% Triton™ X-100 for 10 minutes, and blocked with 5% BSA for 1 hour at room temperature. The cells were labeled with PAK-1 Rabbit Polyclonal Antibody (Product # 71-9300) at 2 µg/mL in 1% BSA and incubated for 3 hours at room temperature and then labeled with Goat anti-Rabbit IgG (Heavy Chain) Superclonal™ Secondary Antibody, Alexa Fluor® 488 conjugate (Product # A27034) at a dilution of 1:2000 for 45 minutes at room temperature (Panel a: green). Nuclei (Panel b: blue) were stained with SlowFade® Gold Antifade Mountant with DAPI (Product # S36938). F-actin (Panel c: red) was stained with Alexa Fluor® 555 Rhodamine Phalloidin (Product # R415, 1:300). Panel d is a merged image showing cytoplasmic localization. Panel e is a no primary antibody control. The images were captured at 60X magnification.
Supportive validation
- Submitted by
- Invitrogen Antibodies (provider)
- Main image

- Experimental details
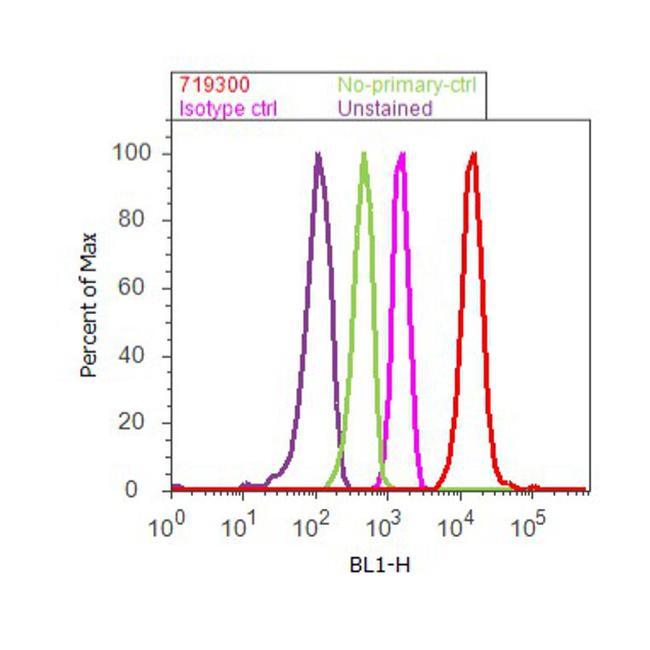
- Flow cytometry analysis of PAK1 was done on Jurkat cells. Cells were fixed with 70% ethanol for 10 minutes, permeabilized with 0.25% Triton™ X-100 for 20 minutes, and blocked with 5% BSA for 30 minutes at room temperature. Cells were labeled with PAK1 Rabbit Polyclonal Antibody (719300, red histogram) or with rabbit isotype control (pink histogram) at 3-5 ug/million cells in 2.5% BSA. After incubation at room temperature for 2 hours, the cells were labeled with Alexa Fluor® 488 Goat Anti-Rabbit Secondary Antibody (A11008) at a dilution of 1:400 for 30 minutes at room temperature. The representative 10,000 cells were acquired and analyzed for each sample using an Attune® Acoustic Focusing Cytometer. The purple histogram represents unstained control cells and the green histogram represents no-primary-antibody control.
Supportive validation
- Submitted by
- Invitrogen Antibodies (provider)
- Main image
- Experimental details
- NULL
- Submitted by
- Invitrogen Antibodies (provider)
- Main image
- Experimental details
- NULL
- Submitted by
- Invitrogen Antibodies (provider)
- Main image
- Experimental details
- NULL
- Submitted by
- Invitrogen Antibodies (provider)
- Main image

- Experimental details
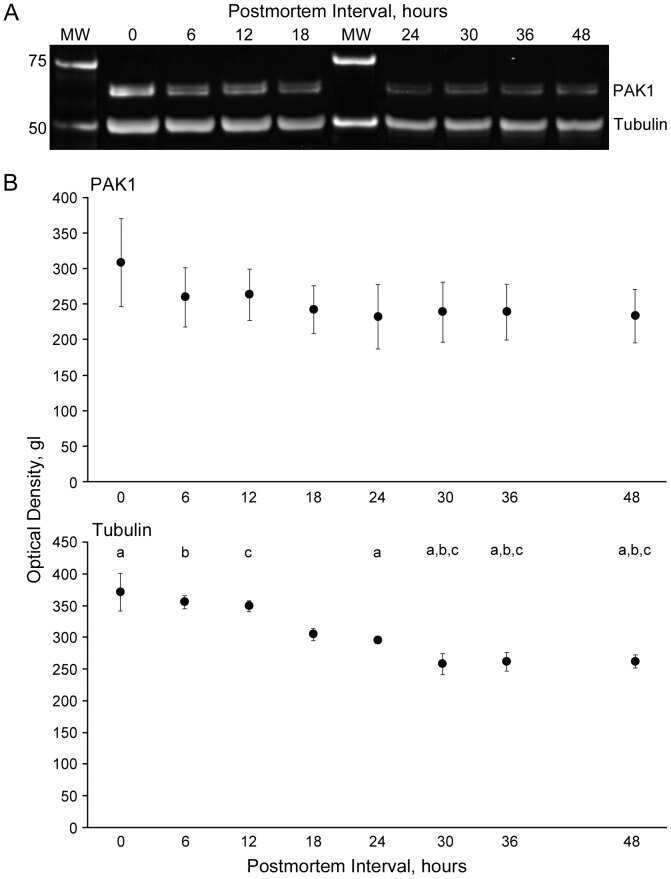
- Figure 3 Effects of postmortem interval on PAK1 expression. A ) Example western blot of PAK1 and Tubulin in mice in which the interval from sacrifice to brain harvesting was experimentally varied between 0 and 48 hours. MW, Molecular Weight Markers. B ) Optical densities for PAK1 and Tubulin in mice in which the interval from sacrifice to brain harvesting was experimentally varied between 0 and 48 hours. Two sets of mice (each set containing one mouse for each PMI) were tested. Sets were run concurrently on separate gels, and the run was repeated. Mean (SEM) values for the four observations at each time point are shown. Time points sharing the same superscript letter differ significantly.
- Submitted by
- Invitrogen Antibodies (provider)
- Main image
- Experimental details
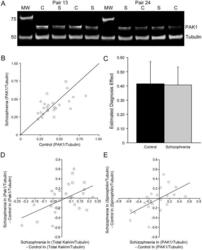
- Figure 1 PAK1 Expression in schizophrenia. A ) Detection of PAK1 in human gray matter extracts. Bands corresponding to the predicted molecular weights of PAK1 and Tubulin are readily detected in human gray matter extracts from subjects with schizophrenia (S) and matched control subjects (C). MW, Molecular Weight Markers. B ) Comparison of PAK1 expression (normalized to tubulin expression) for the 25 pairs of subjects. Each point represents a pair of subjects. The diagonal reference line represents a control: schizophrenia ratio of one. Points above the line indicate increased expression in schizophrenia subjects, points below the line indicate decreased expression in schizophrenia subjects. C ) Mean (SD) expression PAK1:tubulin in schizophrenia and control subjects. D ) Correlation of within pair differences in log PAK1 expression with the corresponding measure of log total kalirin protein expression (r = 0.55, p = 0.004). E ) Correlation of within pair differences in PAK1 expression with the corresponding measure of spinophilin protein expression (r = 0.61, p = 0.004).

- Submitted by
- Invitrogen Antibodies (provider)
- Main image
- Experimental details
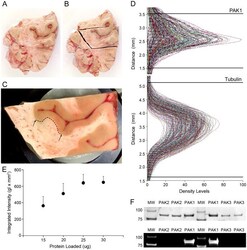
- Figure 5 Processing of human tissue for PAK1. A - C ) show an example of a frozen coronal slab through the right temporal lobe from which a block containing the STG and Heschl's gyrus (located between the arrows in C ) has been excised and mounted for cryostat sectioning. The boundary between the gray and white matter of Heschl's gyrus (dotted line) was undercut so that only gray matter was collected for protein extraction. D ) Demonstrates our approach to quantification of PAK1 and tubulin. Lanes from all blots were simultaneously imported into the analysis software, and for quantification of each protein the peaks were aligned, and then a single band definition applied to all blots concurrently, indicated by the black horizontal lines. E ) PAK1 optical density as a function of micrograms of protein loaded per lane. The mean (SD) of 3 human subjects, assayed together in duplicate runs is shown. It can be seen that the protein loading used in the comparison of schizophrenia and control subjects (20 ug) sits within the linear detection range. F ) Western blot demonstrating isoform specificity of anti-PAK1 antibody. Lanes were loaded with 0.5 ug of each full length GST-tagged recombinant protein (ProQinase # 0357-0000-1, 0304-0000-1, 0422-0000-1, Freiburg, Germany), and detected with Coomassie Blue (top) or with anti-PAK1 antibody (bottom) as described for human and mouse studies.

- Submitted by
- Invitrogen Antibodies (provider)
- Main image

- Experimental details
- Figure 3 Effects of postmortem interval on PAK1 expression. A ) Example western blot of PAK1 and Tubulin in mice in which the interval from sacrifice to brain harvesting was experimentally varied between 0 and 48 hours. MW, Molecular Weight Markers. B ) Optical densities for PAK1 and Tubulin in mice in which the interval from sacrifice to brain harvesting was experimentally varied between 0 and 48 hours. Two sets of mice (each set containing one mouse for each PMI) were tested. Sets were run concurrently on separate gels, and the run was repeated. Mean (SEM) values for the four observations at each time point are shown. Time points sharing the same superscript letter differ significantly.
