Explore
 Validate
 Learn
Learn Western blot
 Immunocytochemistry
Antibody data
- Antibody Data
- Antigen structure
- References [2]
- Comments [0]
- Validations
- Immunocytochemistry [3]
- Immunoprecipitation [1]
- Immunohistochemistry [1]
- Other assay [2]
Submit
Validation data
Reference
Comment
Report error
- Product number
- PA5-28185 - Provider product page

- Provider
- Invitrogen Antibodies
- Product name
- MAD1 Polyclonal Antibody
- Antibody type
- Polyclonal
- Antigen
- Recombinant full-length protein
- Description
- Recommended positive controls: 293T, A431, HeLa, HepG2, A375. Predicted reactivity: Mouse (81%), Rat (81%). Store product as a concentrated solution. Centrifuge briefly prior to opening the vial.
- Reactivity
- Human
- Host
- Rabbit
- Isotype
- IgG
- Vial size
- 100 μL
- Concentration
- 1 mg/mL
- Storage
- Store at 4°C short term. For long term storage, store at -20°C, avoiding freeze/thaw cycles.
Submitted references Phosphorylation and Pin1 binding to the LIC1 subunit selectively regulate mitotic dynein functions.
The dynein adaptor Hook2 plays essential roles in mitotic progression and cytokinesis.
Kumari A, Kumar C, Pergu R, Kumar M, Mahale SP, Wasnik N, Mylavarapu SVS
The Journal of cell biology 2021 Dec 6;220(12)
The Journal of cell biology 2021 Dec 6;220(12)
The dynein adaptor Hook2 plays essential roles in mitotic progression and cytokinesis.
Dwivedi D, Kumari A, Rathi S, Mylavarapu SVS, Sharma M
The Journal of cell biology 2019 Mar 4;218(3):871-894
The Journal of cell biology 2019 Mar 4;218(3):871-894
No comments: Submit comment
Supportive validation
- Submitted by
- Invitrogen Antibodies (provider)
- Main image
- Experimental details
- Immunofluorescent analysis of MAD1 in paraformaldehyde-fixed MCF-7 cells using a MAD1 polyclonal antibody (Product # PA5-28185) at a 1:500 dilution.

- Submitted by
- Invitrogen Antibodies (provider)
- Main image

- Experimental details
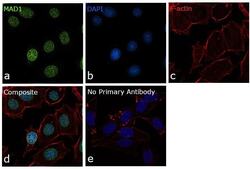
- Immunofluorescence analysis of MAD1 was performed using 70% confluent log phase MCF-7 cells. The cells were fixed with 4% paraformaldehyde for 10 minutes, permeabilized with 0.1% Triton™ X-100 for 15 minutes, and blocked with 1% BSA for 1 hour at room temperature. The cells were labeled with MAD1 Polyclonal Antibody (Product # PA5-28185) at 5 µg/mL concentration in 0.1% BSA, incubated at 4 degree Celsius overnight and then labeled with Goat anti-Rabbit IgG (H+L) Superclonal™ Secondary Antibody, Alexa Fluor® 488 conjugate (Product # A27034) for 45 minutes at room temperature (Panel a: green). Nuclei (Panel b: blue) were stained with ProLong™ Diamond Antifade Mountant with DAPI (Product # P36962). F-actin (Panel c: red) was stained with Rhodamine Phalloidin (Product # R415, 1:300). Panel d represents the merged image showing nuclear localization. Panel e represents control cells with no primary antibody to assess background. The images were captured at 60X magnification.

- Submitted by
- Invitrogen Antibodies (provider)
- Main image
- Experimental details
- Immunofluorescence analysis of MAD1 was performed using 70% confluent log phase MCF-7 cells. The cells were fixed with 4% paraformaldehyde for 10 minutes, permeabilized with 0.1% Triton™ X-100 for 15 minutes, and blocked with 1% BSA for 1 hour at room temperature. The cells were labeled with MAD1 Polyclonal Antibody (Product # PA5-28185) at 5 µg/mL concentration in 0.1% BSA, incubated at 4 degree Celsius overnight and then labeled with Goat anti-Rabbit IgG (Heavy Chain) Superclonal™ Secondary Antibody, Alexa Fluor® 488 conjugate (Product # A27034) for 45 minutes at room temperature (Panel a: green). Nuclei (Panel b: blue) were stained with ProLong™ Diamond Antifade Mountant with DAPI (Product # P36962). F-actin (Panel c: red) was stained with Rhodamine Phalloidin (Product # R415, 1:300). Panel d represents the merged image showing nuclear localization. Panel e represents control cells with no primary antibody to assess background. The images were captured at 60X magnification.

Supportive validation
- Submitted by
- Invitrogen Antibodies (provider)
- Main image
- Experimental details
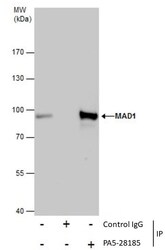
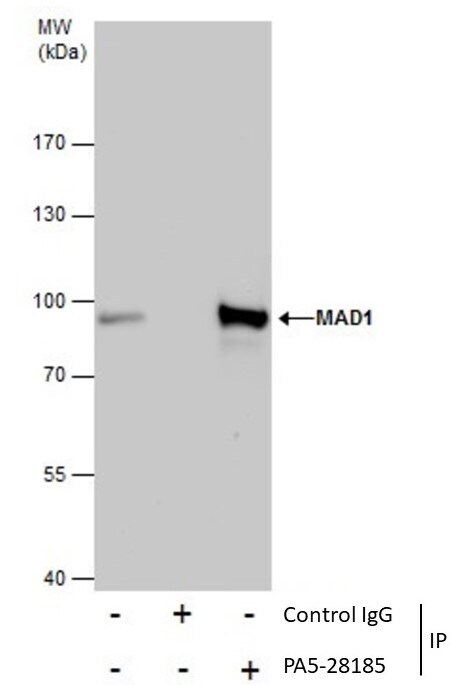
- Immunoprecipitation of MAD1 was performed in HeLa whole cell extracts using 5 µg of MAD1 Polyclonal Antibody (Product # PA5-28185). Samples were transferred to a membrane and probed with MAD1 Polyclonal Antibody as a primary antibody and an HRP-conjugated anti-Rabbit IgG was used as a secondary antibody.
Supportive validation
- Submitted by
- Invitrogen Antibodies (provider)
- Main image
- Experimental details
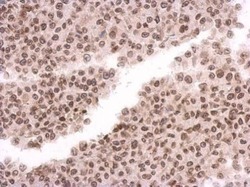
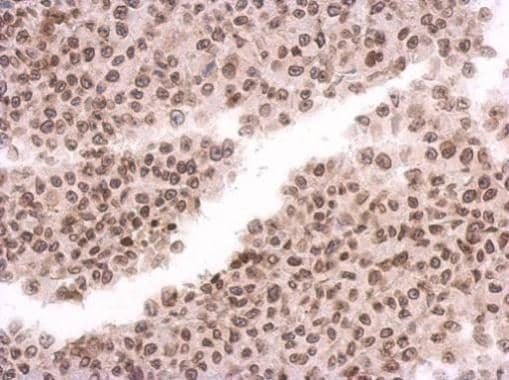
- Immunohistochemical analysis of paraffin-embedded HBL435 xenograft, using MAD1 (Product # PA5-28185) antibody at 1:500 dilution. Antigen Retrieval: EDTA based buffer, pH 8.0, 15 min.
Supportive validation
- Submitted by
- Invitrogen Antibodies (provider)
- Main image

- Experimental details
- Immunoprecipitation of MAD1 was performed in HeLa whole cell extracts using 5 µg of MAD1 Polyclonal Antibody (Product # PA5-28185). Samples were transferred to a membrane and probed with MAD1 Polyclonal Antibody as a primary antibody and an HRP-conjugated anti-Rabbit IgG was used as a secondary antibody.

- Submitted by
- Invitrogen Antibodies (provider)
- Main image
- Experimental details
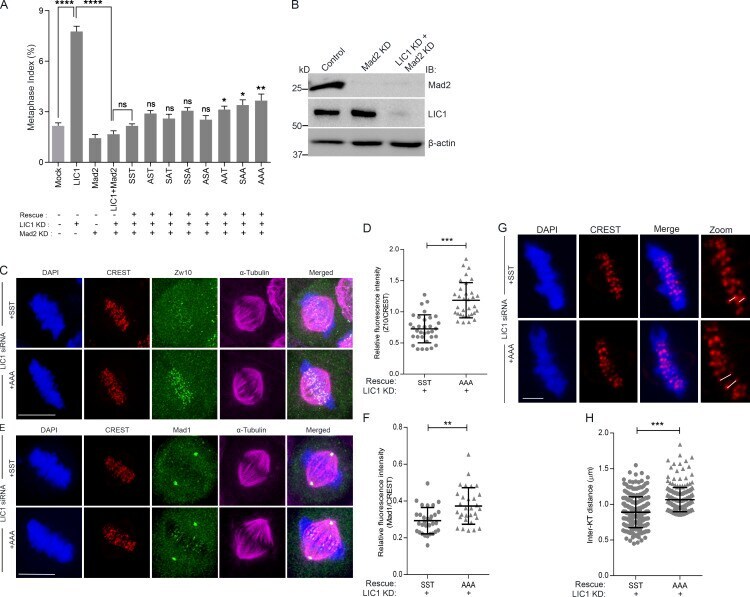
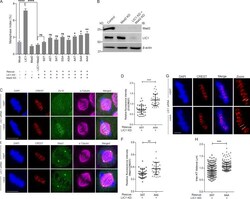
- Figure S4. LIC1-CTD phosphorylation is required for metaphase inactivation of the SAC in HeLa cells. (A) Graph depicting quantification of the metaphase index upon rescue of siRNA-mediated hLIC1 depletion by the various phosphomutant rLIC1 constructs, in the presence (no Mad2 siRNA) and absence (Mad2 siRNA) of a functional SAC. Mock and LIC1 bars are the same data as shown in Fig. S2 C . P values for each of the phosphomutant constructs (sixth bar from the left and beyond) have been calculated with respect to SST. n = 3, >=500 cells per experiment. (B) Immunoblots (IB) depicting the siRNA-mediated depletion of Mad2 and LIC1 in HeLa cells under the indicated conditions. (C and E) Representative confocal micrographs of congressed metaphase HeLa cells (released from nocodazole into MG132) immunostained to visualize the chromosomes (DAPI, blue), kinetochores (CREST, red), and the indicated SAC proteins, Zw10 or Mad1 (green). All cells were treated with anti-hLIC1 siRNA and rescued by the expression of the indicated rLIC1-CTD constructs. n = 3 independent experiments, >=30 metaphase cells per condition. Scale bar = 10 um. (D and F) Scatterplots depicting the quantification of the immunofluorescence signals of SAC proteins Zw10 (D) and Mad1 (F) normalized to the respective kinetochore (CREST) intensities under the indicated conditions. Kinetochore intensities from >=10 perfectly aligned metaphase cells per experiment over 3 independent experiments were quantified. (G) Representativ