Explore
 Validate
 Learn
Learn Western blot
 Immunocytochemistry
Antibody data
- Antibody Data
- Antigen structure
- References [0]
- Comments [0]
- Validations
- Immunocytochemistry [1]
- Immunohistochemistry [1]
- Chromatin Immunoprecipitation [2]
Submit
Validation data
Reference
Comment
Report error
- Product number
- PA5-29041 - Provider product page

- Provider
- Invitrogen Antibodies
- Product name
- PPM1A Polyclonal Antibody
- Antibody type
- Polyclonal
- Antigen
- Recombinant protein fragment
- Description
- Recommended positive controls: Raji, mouse brain, PC-12, Rat2. Predicted reactivity: Mouse (98%), Rat (99%), Xenopus laevis (87%), Rabbit (99%), Bovine (98%). Store product as a concentrated solution. Centrifuge briefly prior to opening the vial.
- Reactivity
- Human, Mouse, Rat
- Host
- Rabbit
- Isotype
- IgG
- Vial size
- 100 µL
- Concentration
- 1 mg/mL
- Storage
- Store at 4°C short term. For long term storage, store at -20°C, avoiding freeze/thaw cycles.
No comments: Submit comment
Supportive validation
- Submitted by
- Invitrogen Antibodies (provider)
- Main image
- Experimental details
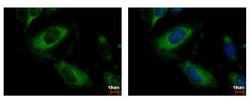
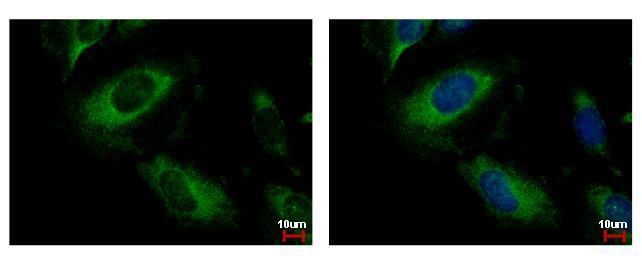
- PPM1A Polyclonal Antibody detects PPM1A protein at cytoplasm by immunofluorescent analysis. Sample: HeLa cells were fixed in 4% paraformaldehyde at RT for 15 min. Green: PPM1A protein stained by PPM1A Polyclonal Antibody (Product # PA5-29041) diluted at 1:500. Blue: Hoechst 33342 staining.
Supportive validation
- Submitted by
- Invitrogen Antibodies (provider)
- Main image
- Experimental details
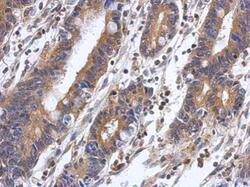
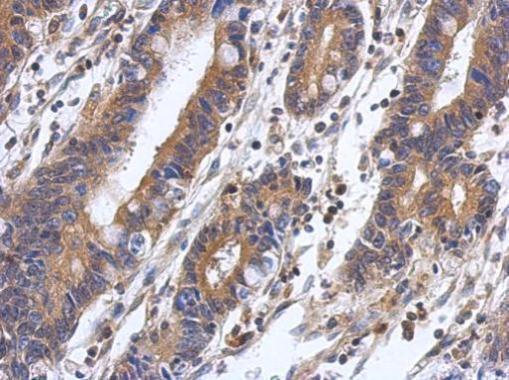
- Immunohistochemical analysis of paraffin-embedded human colon carcinoma, using PPM1A (Product # PA5-29041) antibody at 1:500 dilution. Antigen Retrieval: EDTA based buffer, pH 8.0, 15 min.
Supportive validation
- Submitted by
- Invitrogen Antibodies (provider)
- Main image
- Experimental details
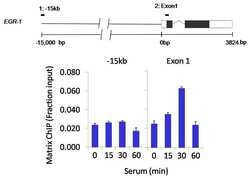
- Chromatin immunoprecipitation analysis of PPM1A was performed using cross-linked chromatin from 1x10^6 HCT116 colon carcinoma cells treated with serum for 0, 15, 30, and 60 minutes. Immunoprecipitation was performed using a multiplex microplate Matrix ChIP assay (see reference for Matrix ChIP protocol: http://www.ncbi.nlm.nih.gov/pubmed/22098709) with 1.0 µL/100 µL well volume of a PPM1A polyclonal antibody (Product # PA5-29041). Chromatin aliquots from ~1 x 10⁵ cells were used per ChIP pull-down. Quantitative PCR data were done in quadruplicate using 1 µL of eluted DNA in 2 µL SYBR real-time PCR reactions containing primers to amplify -15kb upstream of the Egr1 gene or exon-1 of Egr1. PCR calibration curves were generated for each primer pair from a dilution series of sheared total genomic DNA. Quantitation of immunoprecipitated chromatin is presented as signal relative to the total amount of input chromatin. Results represent the mean +/- SEM for three experiments. A schematic representation of the Egr-1 locus is shown above the data where boxes represent exons (black boxes = translated regions, white boxes = untranslated regions), the zigzag line represents an intron, and the straight line represents upstream sequence. Regions amplified by Egr-1 primers are represented by black bars. Data courtesy of the Innovators Program.

- Submitted by
- Invitrogen Antibodies (provider)
- Main image
- Experimental details
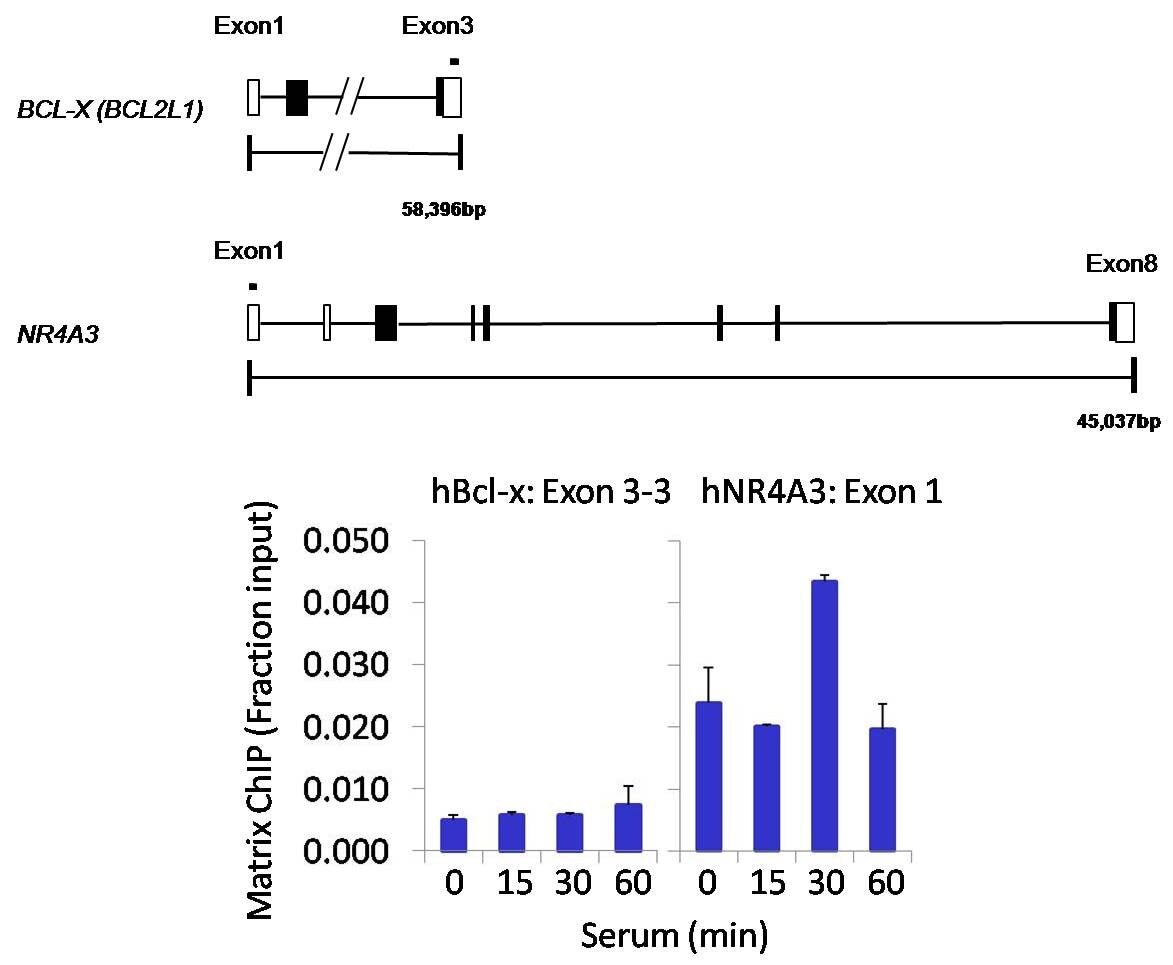
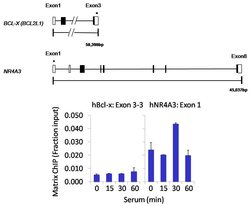
- Chromatin immunoprecipitation analysis of PPM1A was performed using cross-linked chromatin from 1x10^6 HCT116 colon carcinoma cells treated with serum for 0, 15, 30, and 60 minutes. Immunoprecipitation was performed using a multiplex microplate Matrix ChIP assay (see reference for Matrix ChIP protocol: http://www.ncbi.nlm.nih.gov/pubmed/22098709) with 1.0 µL/100 µL well volume of a PPM1A polyclonal antibody (Product # PA5-29041). Chromatin aliquots from ~1 x 10⁵ cells were used per ChIP pull-down. Quantitative PCR data were done in quadruplicate using 1 µL of eluted DNA in 2 µL SYBR real-time PCR reactions containing primers to amplify exon 3-3 of human Bcl-x (hBcl-x) or exon 1 of human NR4A3 (hNR4A3). PCR calibration curves were generated for each primer pair from a dilution series of sheared total genomic DNA. Quantitation of immunoprecipitated chromatin is presented as signal relative to the total amount of input chromatin. Results represent the mean +/- SEM for three experiments. Schematic representations of the Bcl-x and NR4A3 loci are shown above the data where boxes represent exons (black boxes = translated regions, white boxes = untranslated regions). Regions amplified by Bcl-x and NR4A3 primers are represented by black bars. Data courtesy of the Innovators Program.