Explore
 Validate
 Learn
Learn Western blot
Antibody data
- Antibody Data
- Antigen structure
- References [1]
- Comments [0]
- Validations
- Western blot [1]
- Other assay [1]
Submit
Validation data
Reference
Comment
Report error
- Product number
- PA5-75510 - Provider product page

- Provider
- Invitrogen Antibodies
- Product name
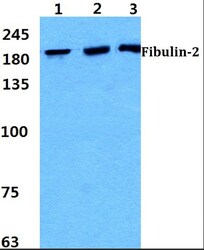
- Fibulin 2 Polyclonal Antibody
- Antibody type
- Polyclonal
- Antigen
- Synthetic peptide
- Description
- The antibody was affinity-purified from rabbit antiserum by affinity-chromatography using epitope-specific immunogen and the purity is > 95% (by SDS-PAGE).
- Reactivity
- Human, Mouse, Rat
- Host
- Rabbit
- Isotype
- IgG
- Vial size
- 100 µL
- Concentration
- 1 mg/mL
- Storage
- Store at 4°C short term. For long term storage, store at -20°C, avoiding freeze/thaw cycles.
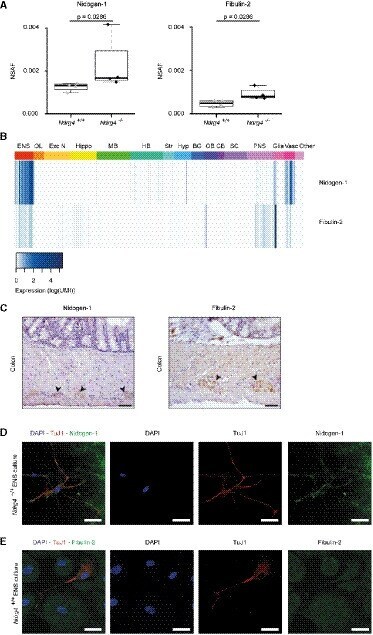
Submitted references Loss of enteric neuronal Ndrg4 promotes colorectal cancer via increased release of Nid1 and Fbln2.
Vaes N, Schonkeren SL, Rademakers G, Holland AM, Koch A, Gijbels MJ, Keulers TG, de Wit M, Moonen L, Van der Meer JRM, van den Boezem E, Wolfs TGAM, Threadgill DW, Demmers J, Fijneman RJA, Jimenez CR, Vanden Berghe P, Smits KM, Rouschop KMA, Boesmans W, Hofstra RMW, Melotte V
EMBO reports 2021 Jun 4;22(6):e51913
EMBO reports 2021 Jun 4;22(6):e51913
No comments: Submit comment
Supportive validation
- Submitted by
- Invitrogen Antibodies (provider)
- Main image
- Experimental details
- Western blot analysis of Fibulin 2 in Lane 1: HeLa cell lysate, Lane 2: sp2/0 cell lysate, Lane 3: H9C2 cell lysate. Samples were incubated with Fibulin 2 polyclonal antibody (Product # PA5-75510) at a dilution of 1:500.

Supportive validation
- Submitted by
- Invitrogen Antibodies (provider)
- Main image

- Experimental details
- Figure 4 Nidogen-1 (Nid1) and Fibulin-2 (Fbln2) are highly present in the Ndrg4 -/- ENS cell secretome and expressed within the ENS A Box plot showing the quantitative protein expression results of nanoLC-MS/MS analysis reveals the significantly higher presence of Nid1 and Fbln2 in the Ndrg4 -/- compared to the Ndrg4 +/+ ENS cell secretome ( n = 4; NSAF, normalized spectral abundance factor). Data are analyzed with R version 3.5.2 and the ibb R package. Each dot within the box plot represents the NSAF of an individual sample; the inside band reflects the median, and the bottom and top of the box the first and third quartile, respectively. The whiskers reflect the minimum and maximal values within 1.5x the interquartile range. NSAF values were compared using the Mann-Whitney U -test. B Data derived from the Linnarsson mouse database (http://mousebrain.org/) display the expression of Nid1 and Fbln2 within cells of the central, peripheral, and enteric nervous system. Unit color scale: Expression (log(UMI)); UMI, unique molecular identifier. Abbreviations: ENS, enteric nervous system (i.e., enteric neurons and glial cells); OL, oligodendrocytes; Exc N, excitatory neurons in CNS; Hippo, hippocampus; MB, midbrain; HB, hindbrain; Str, striatum; Hyp, hypothalamus; BG, basal ganglia; OB, olfactory bulb; CB, cerebellum; SC, spinal cord; PNS, peripheral nervous system; Glia, glial cells; and Vasc, vasculature. C-E Representative immunohistochemistry (C) and more detailed immunofluoresce