Explore
 Validate
 Learn
Learn Western blot
Antibody data
- Antibody Data
- Antigen structure
- References [1]
- Comments [0]
- Validations
- Western blot [2]
- Immunohistochemistry [1]
- Other assay [4]
Submit
Validation data
Reference
Comment
Report error
- Product number
- PA5-77511 - Provider product page

- Provider
- Invitrogen Antibodies
- Product name
- CHRNA9 Polyclonal Antibody
- Antibody type
- Polyclonal
- Antigen
- Synthetic peptide
- Description
- For reconstitution, we recommend adding 100 µL distilled water to a final antibody concentration of about 1 mg/mL. To use this carrier-free antibody for conjugation experiments, we strongly recommend performing another round of desalting. (Zeba Spin Desalting Columns, 7KMWCO, 0.5 mL, Product # 89882)
- Reactivity
- Human, Mouse, Rat
- Host
- Rabbit
- Isotype
- IgG
- Vial size
- 50 µL
- Concentration
- 0.8 mg/mL
- Storage
- -20°C
Submitted references The α9 Nicotinic Acetylcholine Receptor Mediates Nicotine-Induced PD-L1 Expression and Regulates Melanoma Cell Proliferation and Migration.
Nguyen HD, Liao YC, Ho YS, Chen LC, Chang HW, Cheng TC, Liu D, Lee WR, Shen SC, Wu CH, Tu SH
Cancers 2019 Dec 11;11(12)
Cancers 2019 Dec 11;11(12)
No comments: Submit comment
Supportive validation
- Submitted by
- Invitrogen Antibodies (provider)
- Main image

- Experimental details
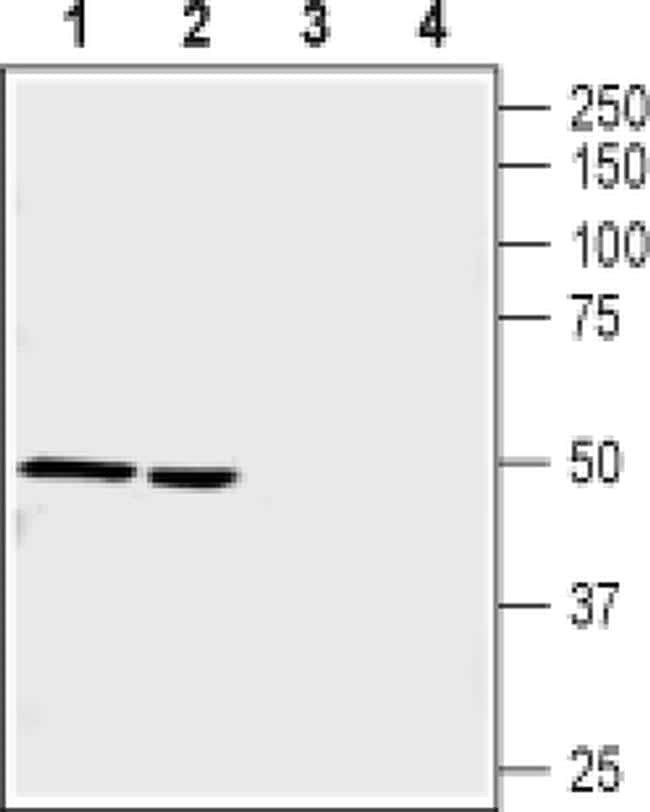
- Western blot analysis of mouse (lanes 1 and 3) and rat (lanes 2 and 4) brain lysates with CHRNA9 polyclonal antibody (Product # PA5-77511) using a dilution of 1:400.

- Submitted by
- Invitrogen Antibodies (provider)
- Main image

- Experimental details
- Western blot analysis of mouse (lanes 1 and 3) and rat (lanes 2 and 4) brain lysates with CHRNA9 polyclonal antibody (Product # PA5-77511) using a dilution of 1:400.
Supportive validation
- Submitted by
- Invitrogen Antibodies (provider)
- Main image

- Experimental details
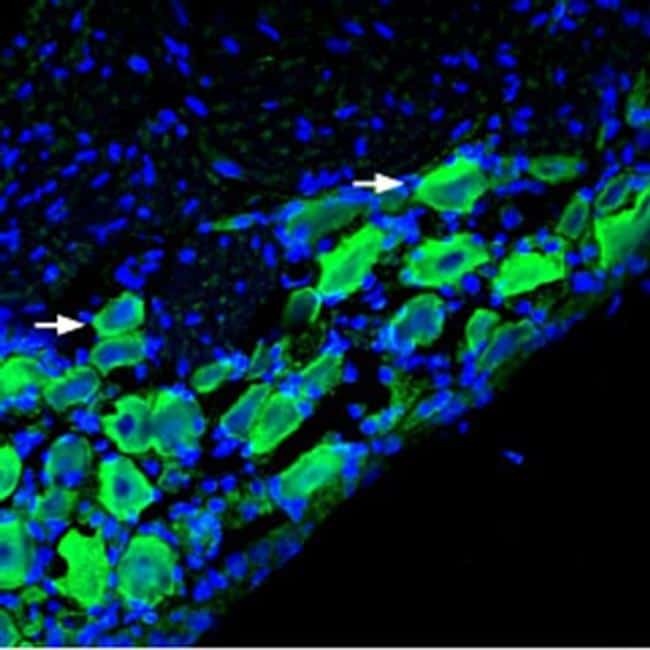
- Immunohistochemistry analysis of CHRNA9 in frozen rat dorsal root ganglion. Samples were probed with CHRNA9 polyclonal antibody (Product # PA5-77511) using a dilution of 1:400, and incubated with goat anti-rabbit Alexa Fluor 488 and DAPI.
Supportive validation
- Submitted by
- Invitrogen Antibodies (provider)
- Main image
- Experimental details
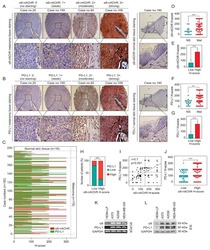
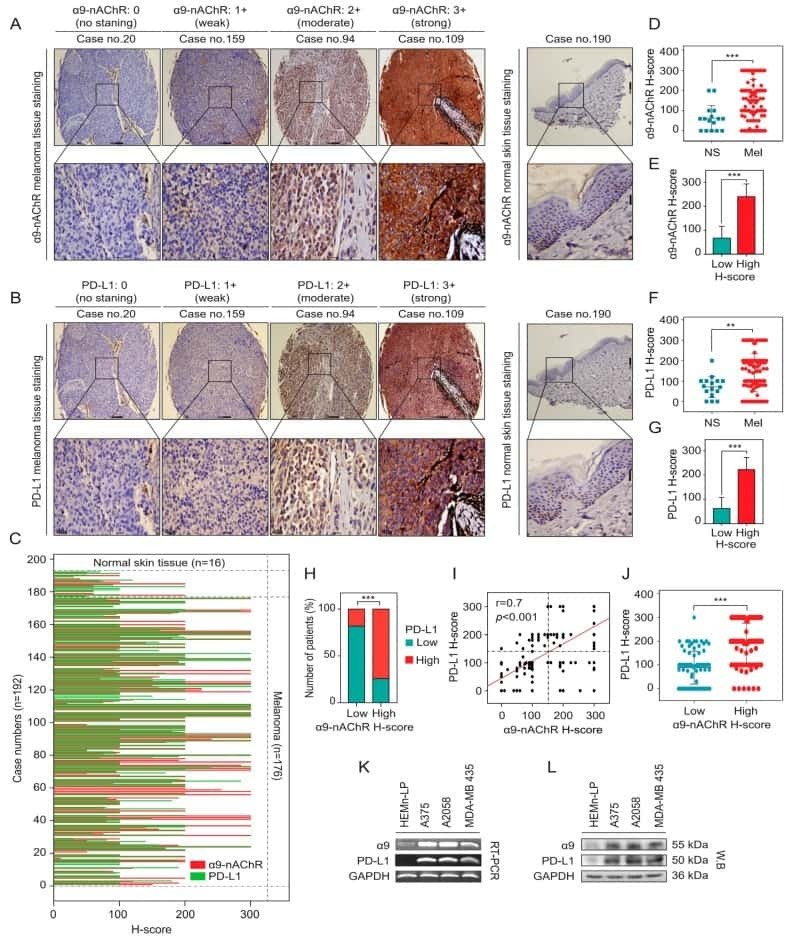
- Figure 2 Correlations between alpha9-nAChR and PD-L1 in melanoma. ( A , B ) Representative images for alpha9-nAChR and PD-L1 immunohistochemistry (IHC) scoring system in the melanoma tissues and normal skin tissues. The scoring system was determined as no staining (0), weak (1+), moderate (2+), and strong (3+) based on alpha9-nAChR and PD-L1 intensity. ( C ) The alpha9-nAChR (red lines) and PD-L1 (green lines) expression profiles of melanoma tissues ( n = 176) and normal skin tissues ( n = 16) were detected by IHC staining based on H-score value. ( D , F ) Histological analysis of alpha9-nAChR and PD-L1 expression in melanoma tissues (Mel, n = 176) compared with normal skin tissues (NS, n = 16). ( E , G ) Histological analysis of alpha9-nAChR and PD-L1 expression in the tissue microarrays ( n = 192) based on H-score value. The tissues were divided into two groups based on the mean value of alpha9-nAChR or PD-L1 H-score, low alpha9-nAChR ( n = 97) or high alpha9-nAChR ( n = 95) and low PD-L1 ( n = 104) or high PD-L1 ( n = 88). ( H ) The association between alpha9-nAChR and PD-L1 expression in the tissue microarrays ( n = 192) as categorical variables. The chi 2 test was employed to assess the correlation between a9-nAChR and PD-L1 expression in samples. *** p < 0.001. ( I ) Correlation between alpha9-nAChR and PD-L1 expression in the melanoma tissue microarrays ( n = 192). Pearson's rank correlation measured the strength of the association between alpha9-nACh
- Submitted by
- Invitrogen Antibodies (provider)
- Main image
- Experimental details
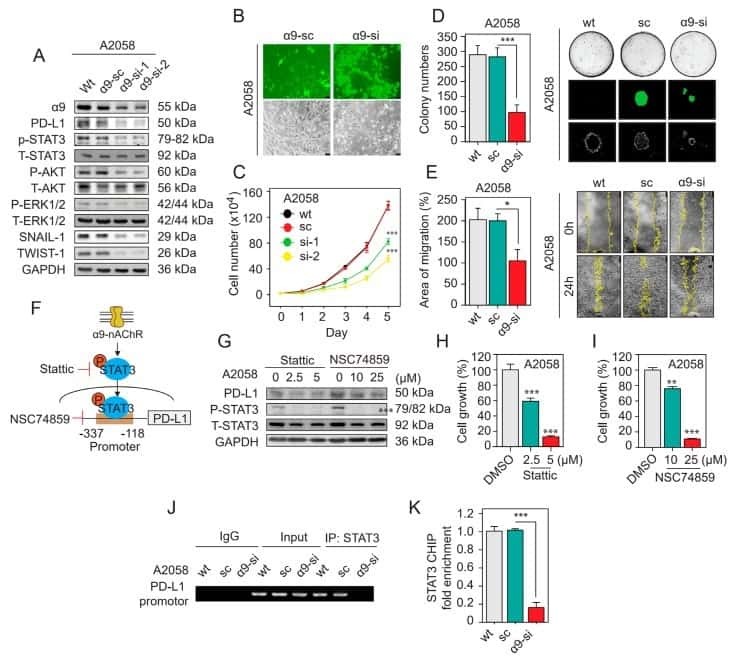
- Figure 4 Knocking down alpha9-nAChR expression inhibits melanoma cell proliferation and migration and affects the protein level of PD-L1. ( A ) Western blotting results showing the protein level changes in alpha9-nAChR, PD-L1, P-STAT3, P-AKT, P-ERK, Snail-1 and Twist-1 after knocking down alpha9-nAChR expression in A2058 cells. GAPDH served as a control. ( B ) Fluorescence micrographs showing GFP expression (bottom panels) of alpha9-nAChR-siRNA-expressing or scrambled siRNA-A2058 cells at 48 h after pSUPER-alpha9-nAChR-si or pSUPER-alpha9-nAChR-scramble vector transfection, and corresponding phase-contrast microscopy images showing cell morphology (top panels). ( C ) Cell proliferation of alpha9-nAChR-siRNA-expressing A2058 cells monitored by a cell count assay. ( D ) Cell proliferation of alpha9-siRNA-expressing A2058 cells assessed by a soft-agar growth assay. The colonies formed in the low density seeding assay were counted after 21 days (left panels). The amounts, sizes, and fluorescence microscopy images of colonies are shown (right panels). ( E ) Migratory capacity measured at 24 h using a wound-healing assay with A2058 cells stably expressing alpha9-nAChR-siRNA (si), scrambled siRNA (sc) or wild-type (wt) (left panels). Quantification of the migratory areas (right panels) were measured using ImageJ software. ( F ) The STAT3 binding site of the PD-L1 promoter and targets of STAT3 phosphorylation inhibitor Stattic and STAT3 DNA-binding inhibitor NSC74859. ( G ) Effects
- Submitted by
- Invitrogen Antibodies (provider)
- Main image
- Experimental details
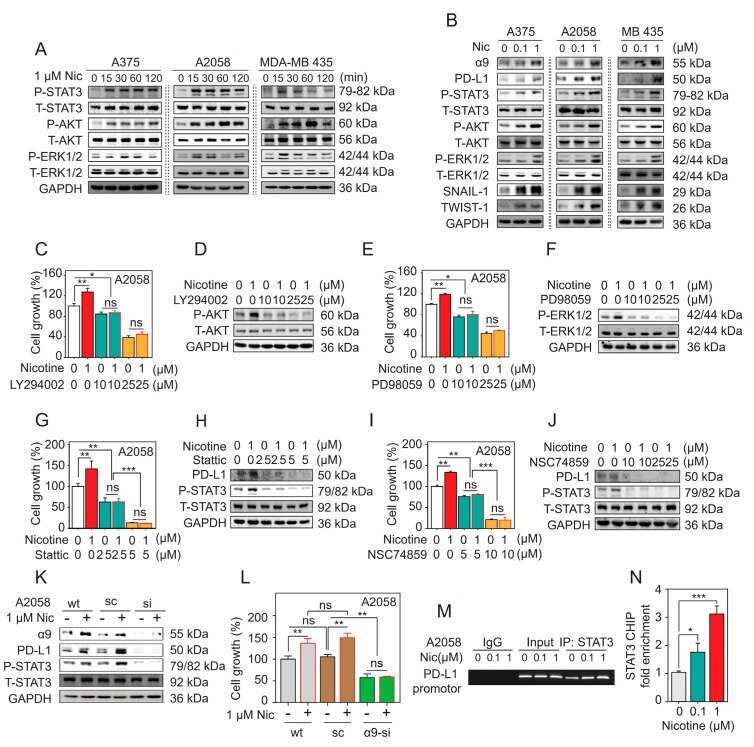
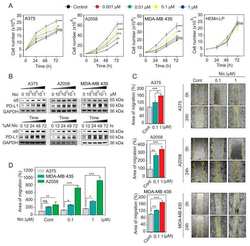
- Figure 5 Nicotine-induced alpha9-nAChR activity promotes melanoma cell proliferation, migration, and PD-L1 upregulation. ( A ) Nicotine induced melanoma cell proliferation. Cell count assays were performed with the A375, A2058, and MDA-MB 435 melanoma cells and HEMn-LP melanocytes, and the cells were treated with nicotine at the final concentrations of 0.001-1 mum for 24-72 h. ( B ) Melanoma cells were exposed to nicotine at the indicated concentrations for indicated time periods. alpha9-nAChR and PD-L1 protein levels were determined by western blotting. ( C ) Nicotine promoted melanoma cell migration. Cell migration capabilities were evaluated using a wound-healing assay. Cells were scratched using 10 or 100 muL tips and treated with nicotine at the indicated concentrations for 24 h. ( D ) Comparing migration area among the A375, A2058, and MDA-MB 435 melanoma cells. The data are presented as the mean +- SD of three independent experiments. ns, not significant; * p < 0.05; ** p < 0.01; *** p < 0.001; Student's t-test.

- Submitted by
- Invitrogen Antibodies (provider)
- Main image

- Experimental details
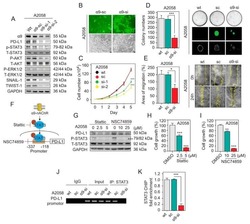
- Figure 6 alpha9-nAChR mediates nicotine-induced PD-L1 expression and regulates melanoma cell proliferation. ( A ) Nicotine increased STAT3, AKT, and ERK phosphorylation in a time-dependent manner in the A375, A2058, and MDA-MB-435 cells, as assessed by western blotting. ( B ) Nicotine induced the phosphorylation of STAT3, AKT, and ERK and upregulated the protein levels of alpha9-nAChR, PD-L1, Snail-1 and Twist-1 in a dose-dependent manner. The results were determined by western blotting. ( C - J ) A2058 cells were pretreated with the inhibitor LY294002 (10 mum or 25 mum), PD98059 (10 mum or 25 mum), Stattic (2.5 mum or 5 mum) or NSC74859 (10 mum or 25 mum) for 3-24 h and subsequently treated with or without nicotine (1 mum) for additional 24-48 h. Western blot analysis was used to detect protein levels. Cell proliferation was assessed by an MTT assay. ( K , L ) Wild-type, scrambled siRNA, and alpha9-nAChR-si-expressing A2058 cells were treated with or without 1 mum nicotine. Western blot analysis was used to assess protein levels. Cell growth was assessed by an MTT assay. ( M , N ) After A2058 cells were exposed to 0.1 mum or 1 mum nicotine for 24 h, a ChIP assay was performed using an anti-STAT3 antibody. The protein-chromatin immunoprecipitates were subjected to RT-PCR and qPCR. In RT-PCR, a rabbit IgG antibody was used as a negative control, and total genomic DNA was used as a positive control. In qPCR, relative enrichments of PD-L1 promoter region were calculated after