Explore
 Validate
 Learn
Learn Western blot
 Other assay
Antibody data
- Antibody Data
- Antigen structure
- References [1]
- Comments [0]
- Validations
- Other assay [4]
Submit
Validation data
Reference
Comment
Report error
- Product number
- PA5-46826 - Provider product page

- Provider
- Invitrogen Antibodies
- Product name
- CHRNA9 Polyclonal Antibody
- Antibody type
- Polyclonal
- Antigen
- Synthetic peptide
- Description
- Peptide sequence: MNWSHSCISF CWIYFAASRL RAAETADGKY AQKLFNDLFE DYSNALRPVE Sequence homology: Cow: 100%; Dog: 100%; Guinea Pig: 100%; Horse: 100%; Mouse: 93%; Rabbit: 100%; Zebrafish: 80%
- Reactivity
- Human
- Host
- Rabbit
- Isotype
- IgG
- Vial size
- 100 μL
- Concentration
- 0.5 mg/mL
- Storage
- -20°C, Avoid Freeze/Thaw Cycles
Submitted references The α9 Nicotinic Acetylcholine Receptor Mediates Nicotine-Induced PD-L1 Expression and Regulates Melanoma Cell Proliferation and Migration.
Nguyen HD, Liao YC, Ho YS, Chen LC, Chang HW, Cheng TC, Liu D, Lee WR, Shen SC, Wu CH, Tu SH
Cancers 2019 Dec 11;11(12)
Cancers 2019 Dec 11;11(12)
No comments: Submit comment
Supportive validation
- Submitted by
- Invitrogen Antibodies (provider)
- Main image

- Experimental details
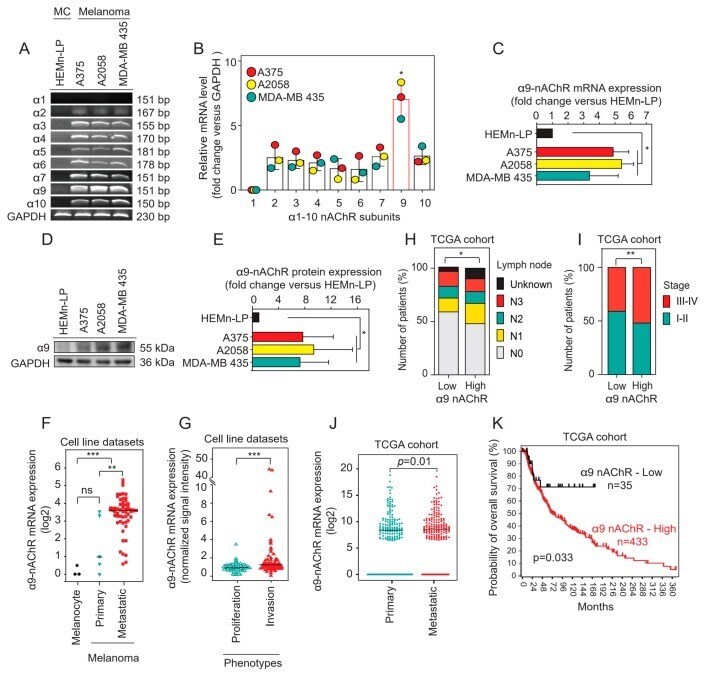
- Figure 1 alpha9-nAChR expression levels and their correlations with clinicopathological parameters in multiple melanoma databases. ( A ) Detection of nAChR subunits in the primary epidermal melanocyte cell line HEMn-LP and the melanoma cell lines A375, A2058, and MDA-MB 435 by RT-PCR. ( B ) Relative mRNA expression of alpha1-10 nAChR subunits in the A375, A2058, and MDA-MB 435 melanoma cell lines. ( C ) Relative alpha9-nAChR mRNA expression in the HEMn-LP, A375, A2058, and MDA-MB 435 cell lines. ( D , E ) Determination of alpha9-nAChR mRNA levels using western blotting and statistical analysis of alpha9-nAChR protein levels. ( F ) The mRNA expression of alpha9-nAChR in two datasets from the public R2 MegaSampler platform ( http://hgserver1.amc.nl/cgi-bin/r2/main.cgi ) comprising melanocyte cell lines ( n = 3) and primary ( n = 5), and metastatic ( n = 58) melanoma cell lines. ( G ) Screening of melanoma cell line datasets ( http://www.jurno.ch/php/genehunter.html ) for the mRNA expression of alpha9-nAChR. These cell lines were further subdivided into proliferative ( n = 101) and invasive ( n = 90) phenotypes. ( H ) alpha9-nAChR gene expression level in the TCGA-SKCM cohort ( n = 472) downloaded from the UCSC Xena browser ( https://xenabrowser.net/heatmap/ ). Melanoma patients were further divided into two groups based on the mean value of alpha9-nAChR mRNA expression, low alpha9-nAChR expression ( n = 169) and high alpha9-nAChR expression ( n = 291). Bar plots show the propor
- Submitted by
- Invitrogen Antibodies (provider)
- Main image
- Experimental details
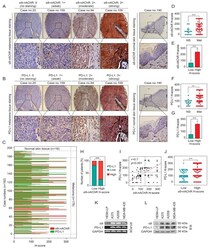
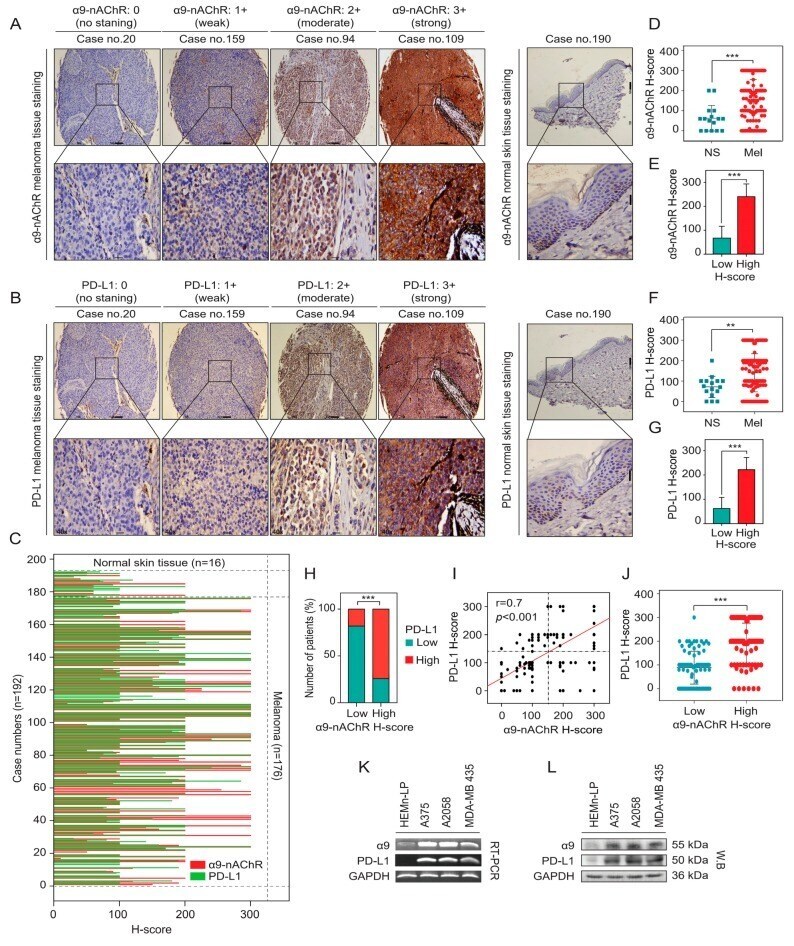
- Figure 2 Correlations between alpha9-nAChR and PD-L1 in melanoma. ( A , B ) Representative images for alpha9-nAChR and PD-L1 immunohistochemistry (IHC) scoring system in the melanoma tissues and normal skin tissues. The scoring system was determined as no staining (0), weak (1+), moderate (2+), and strong (3+) based on alpha9-nAChR and PD-L1 intensity. ( C ) The alpha9-nAChR (red lines) and PD-L1 (green lines) expression profiles of melanoma tissues ( n = 176) and normal skin tissues ( n = 16) were detected by IHC staining based on H-score value. ( D , F ) Histological analysis of alpha9-nAChR and PD-L1 expression in melanoma tissues (Mel, n = 176) compared with normal skin tissues (NS, n = 16). ( E , G ) Histological analysis of alpha9-nAChR and PD-L1 expression in the tissue microarrays ( n = 192) based on H-score value. The tissues were divided into two groups based on the mean value of alpha9-nAChR or PD-L1 H-score, low alpha9-nAChR ( n = 97) or high alpha9-nAChR ( n = 95) and low PD-L1 ( n = 104) or high PD-L1 ( n = 88). ( H ) The association between alpha9-nAChR and PD-L1 expression in the tissue microarrays ( n = 192) as categorical variables. The chi 2 test was employed to assess the correlation between a9-nAChR and PD-L1 expression in samples. *** p < 0.001. ( I ) Correlation between alpha9-nAChR and PD-L1 expression in the melanoma tissue microarrays ( n = 192). Pearson's rank correlation measured the strength of the association between alpha9-nAChR and PD-L1 expres
- Submitted by
- Invitrogen Antibodies (provider)
- Main image
- Experimental details
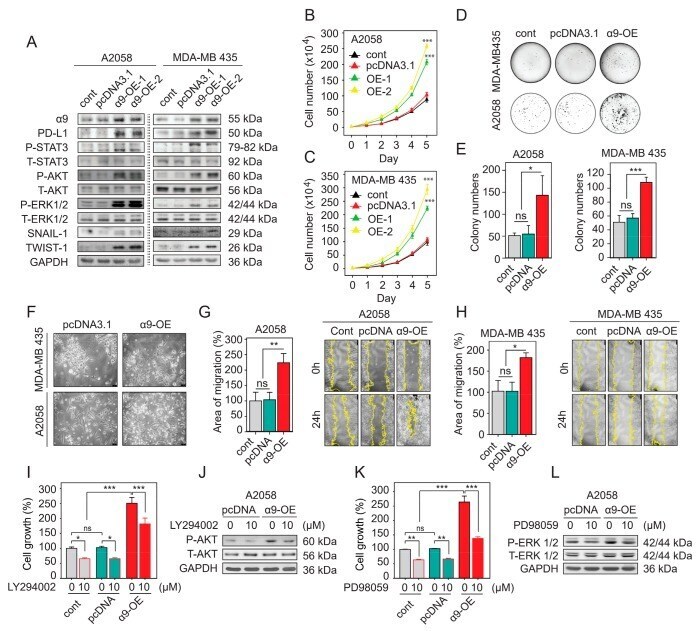
- Figure 3 alpha9-nAChR overexpression induces PD-L1 upregulation and promotes melanoma cell proliferation and migration. ( A ) Overexpression of alpha9-nAChR activated the phosphorylation of AKT, ERK, and STAT3 and induced PD-L1, Snail-1, and Twist-1 protein levels in A2058 and MDA-MB-435 cells, which were evaluated by western blotting. ( B , C ) alpha9-nAChR overexpression significantly increased the proliferation of A2058 and MDA-MB435 cells compared to control cells, as determined by a cell count assay. ( D ) Soft-agar growth assays were performed with A2058 and MDA-MB-435 cells transfected with pcDNA3.1 or pcDNA3.1-alpha9-nAChR overexpression vectors. ( E ) Colony numbers were quantified and presented in the histogram. ( F ) Cell morphology of A2058 and MDA-MD-435 cells transfected with pcDNA3.1 or pcDNA3.1-alpha9-nAChR overexpression vector. ( G , H ) Representative micrographs and statistical analysis demonstrated that alpha9-nAChR overexpression increased the migration areas of A2058 and MDA-MB 435 cells at 24 h after scratching. ( I , K ) Percentages of cell proliferation for the A2058 cells, pcDNA3.1-A2058 cells, and alpha9-nAChR-overexpressing A2058 cells were treated with or without the PI3K inhibitor LY294002 (10 um) or MEK inhibitor PD98059 (10 um) for 48 h determined by an MTT assay. ( J , L ) Western blotting to detect the protein levels of P-AKT and P-ERK in pcDNA3.1-A2058 cells and alpha9-nAChR-overexpressing A2058 cells with or without LY294002 or PD98059 tre
- Submitted by
- Invitrogen Antibodies (provider)
- Main image

- Experimental details
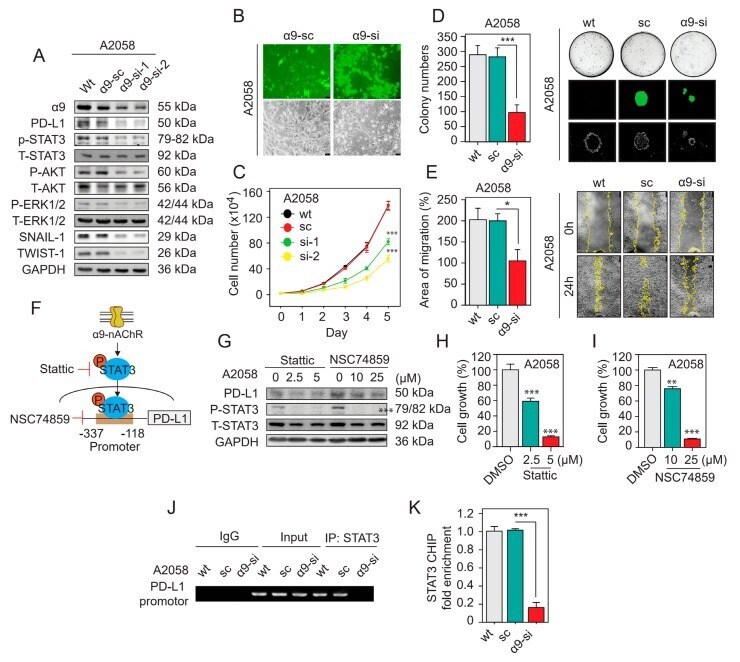
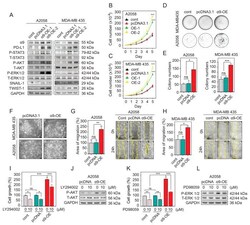
- Figure 4 Knocking down alpha9-nAChR expression inhibits melanoma cell proliferation and migration and affects the protein level of PD-L1. ( A ) Western blotting results showing the protein level changes in alpha9-nAChR, PD-L1, P-STAT3, P-AKT, P-ERK, Snail-1 and Twist-1 after knocking down alpha9-nAChR expression in A2058 cells. GAPDH served as a control. ( B ) Fluorescence micrographs showing GFP expression (bottom panels) of alpha9-nAChR-siRNA-expressing or scrambled siRNA-A2058 cells at 48 h after pSUPER-alpha9-nAChR-si or pSUPER-alpha9-nAChR-scramble vector transfection, and corresponding phase-contrast microscopy images showing cell morphology (top panels). ( C ) Cell proliferation of alpha9-nAChR-siRNA-expressing A2058 cells monitored by a cell count assay. ( D ) Cell proliferation of alpha9-siRNA-expressing A2058 cells assessed by a soft-agar growth assay. The colonies formed in the low density seeding assay were counted after 21 days (left panels). The amounts, sizes, and fluorescence microscopy images of colonies are shown (right panels). ( E ) Migratory capacity measured at 24 h using a wound-healing assay with A2058 cells stably expressing alpha9-nAChR-siRNA (si), scrambled siRNA (sc) or wild-type (wt) (left panels). Quantification of the migratory areas (right panels) were measured using ImageJ software. ( F ) The STAT3 binding site of the PD-L1 promoter and targets of STAT3 phosphorylation inhibitor Stattic and STAT3 DNA-binding inhibitor NSC74859. ( G ) Effects o