Explore
 Validate
 Learn
Learn Western blot
 Immunocytochemistry
 Flow cytometry
Antibody data
- Antibody Data
- Antigen structure
- References [1]
- Comments [0]
- Validations
- Immunocytochemistry [1]
- Immunohistochemistry [2]
- Other assay [2]
Submit
Validation data
Reference
Comment
Report error
- Product number
- MA5-25521 - Provider product page

- Provider
- Invitrogen Antibodies
- Product name
- LNK Monoclonal Antibody (OTI2D8)
- Antibody type
- Monoclonal
- Antigen
- Recombinant full-length protein
- Reactivity
- Human
- Host
- Mouse
- Isotype
- IgG
- Antibody clone number
- OTI2D8
- Vial size
- 100 μL
- Concentration
- 1 mg/mL
- Storage
- -20°C, Avoid Freeze/Thaw Cycles
Submitted references TGF-β1/SH2B3 axis regulates anoikis resistance and EMT of lung cancer cells by modulating JAK2/STAT3 and SHP2/Grb2 signaling pathways.
Wang LN, Zhang ZT, Wang L, Wei HX, Zhang T, Zhang LM, Lin H, Zhang H, Wang SQ
Cell death & disease 2022 May 19;13(5):472
Cell death & disease 2022 May 19;13(5):472
No comments: Submit comment
Supportive validation
- Submitted by
- Invitrogen Antibodies (provider)
- Main image
- Experimental details
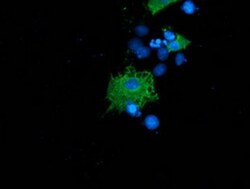
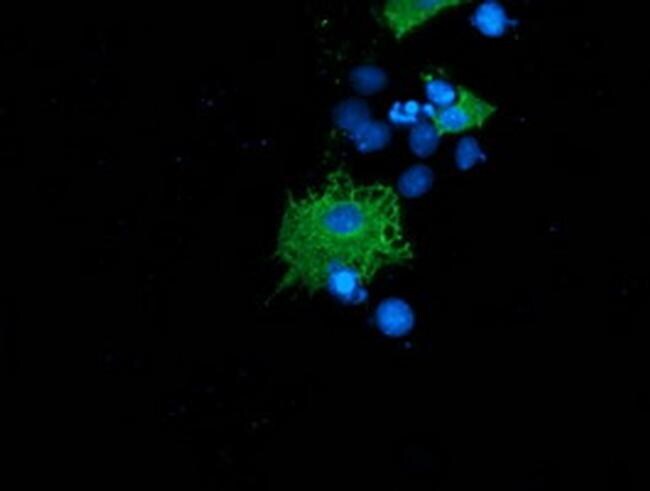
- Immunofluorescent analysis of SH2B3 in COS7 cells. Cells were transfected with a plasmid overexpressing SH2B3 and probed with a SH2B3 monoclonal antibody (Product # MA5-25521).
Supportive validation
- Submitted by
- Invitrogen Antibodies (provider)
- Main image

- Experimental details
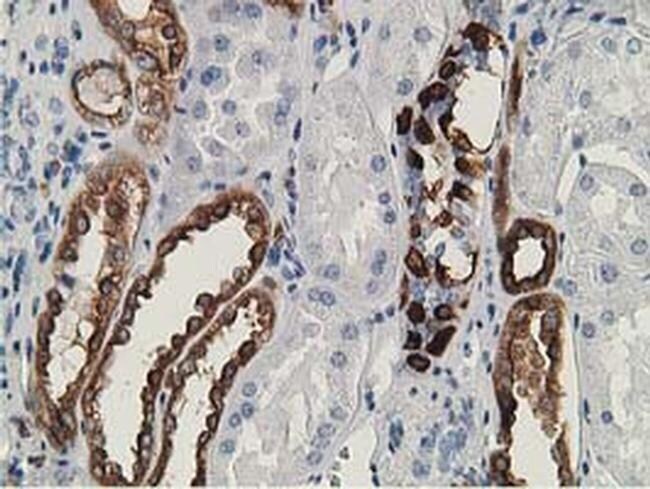
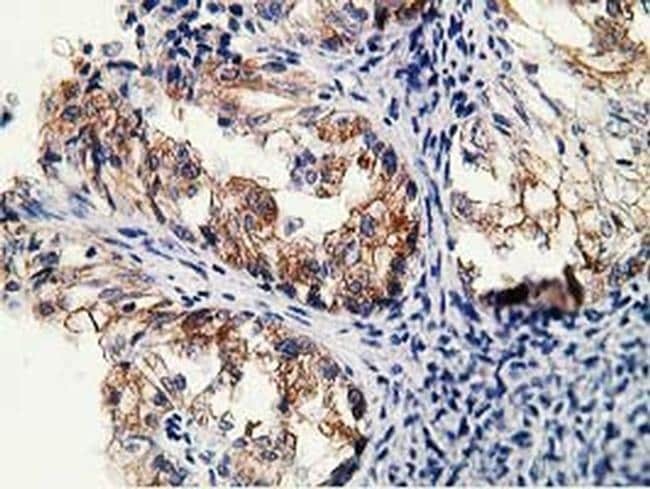
- Immunohistochemistry was performed on paraffin-embedded human kidney tissue. To expose target proteins, 10mM citric buffer, pH6.0, 100°C for 10min was used. Following antigen retrieval, tissues were probed with a SH2B3 monoclonal antibody (Product # MA5-25521).
- Submitted by
- Invitrogen Antibodies (provider)
- Main image
- Experimental details
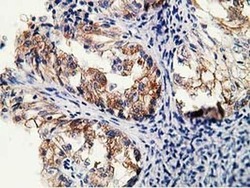
- Immunohistochemistry was performed on paraffin-embedded human pancreas tissue. To expose target proteins, 10mM citric buffer, pH6.0, 100°C for 10min was used. Following antigen retrieval, tissues were probed with a SH2B3 monoclonal antibody (Product # MA5-25521).
Supportive validation
- Submitted by
- Invitrogen Antibodies (provider)
- Main image
- Experimental details
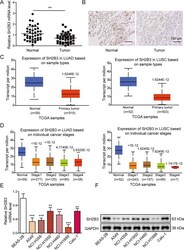
- Fig. 1 SH2B3 was diminished in lung cancer tissues and cells. A qRT-PCR analysis of SH2B3 mRNA levels in human lung cancer tissues ( n = 40). B IHC assay to examine SH2B3 protein levels in human lung cancer tissues. C Bioinformatic analysis of SH2B3 mRNA level in human lung cancer tissues from UALCAN database. D Bioinformatic analysis of SH2B3 mRNA level in lung cancer tissues from patients at different stages from UALCAN database. E qRT-PCR analysis of SH2B3 mRNA levels in cultured lung cancer cell lines. F Western blotting to examine SH2B3 protein levels in cultured lung cancer cell lines. *** P < 0.001 and ** P < 0.01.
- Submitted by
- Invitrogen Antibodies (provider)
- Main image
- Experimental details
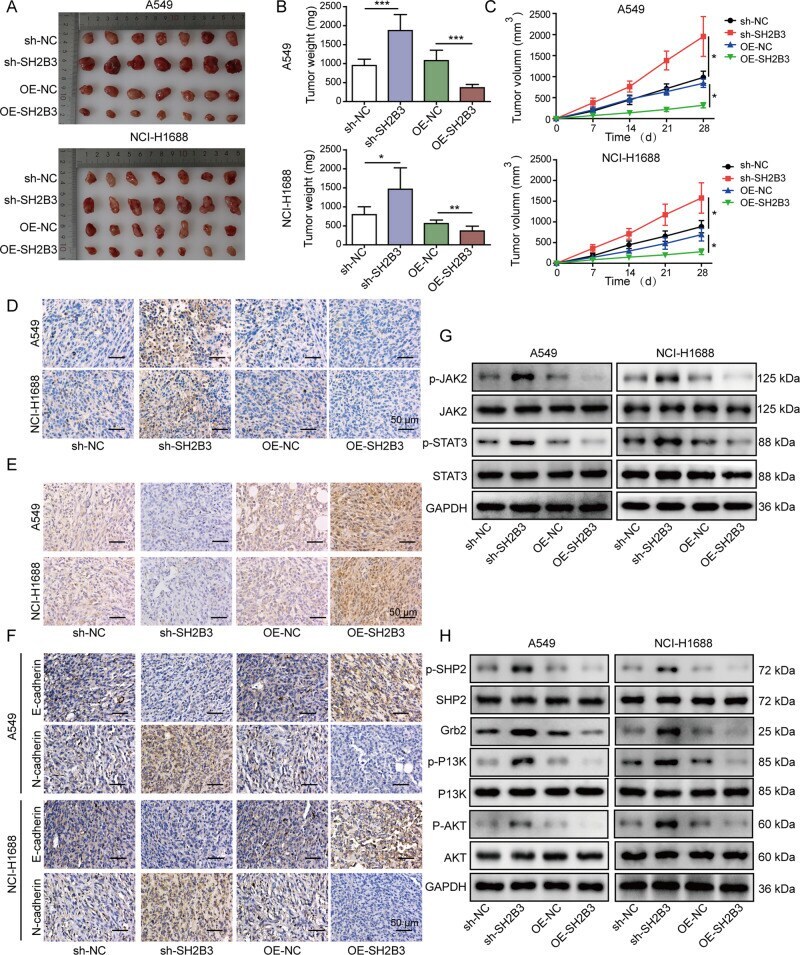
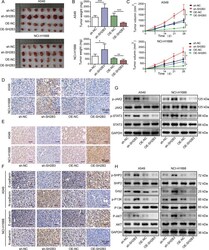
- Fig. 6 SH2B3 restrained lung cancer growth in vivo. A Representative tumor images from each group of mice. B , C Quantification of tumor weight ( B ) and size ( C ) in each group of mice after 28 days of implantation. D IHC to examine Ki-67 level in tumor samples from each group of mice. E IHC to test SH2B3 level in tumor samples from each group of mice. F IHC to evaluate N-cadherin and E-cadherin expression levels in tumor samples from each group of mice. G Western blotting to determine p-JAK2, JAK2, p-STAT3, and STAT3 in tumor samples from each group of mice. H Western blotting to determine p-SHP2, SHP2, Grb2, p-PI3K, PI3K, p-AKT, and AKT in tumor samples from each group of mice. *** P < 0.001, ** P < 0.01, and * P < 0.05.