 Explore
 Validate
 Learn
Learn Western blot
 Immunocytochemistry
Antibody data
- Antibody Data
- Antigen structure
- References [2]
- Comments [0]
- Validations
- Immunocytochemistry [1]
- Other assay [1]
Submit
Validation data
Reference
Comment
Report error
- Product number
- PA5-76870 - Provider product page

- Provider
- Invitrogen Antibodies
- Product name
- PHLDA2 Polyclonal Antibody
- Antibody type
- Polyclonal
- Antigen
- Recombinant full-length protein
- Description
- The antibody was affinity-purified from rabbit antiserum by affinity-chromatography using epitope-specific immunogen and the purity is > 95% (by SDS-PAGE).
- Reactivity
- Human
- Host
- Rabbit
- Isotype
- IgG
- Vial size
- 100 μL
- Concentration
- 1 mg/mL
- Storage
- Store at 4°C short term. For long term storage, store at -20°C, avoiding freeze/thaw cycles.
Submitted references Chaperone mediated detection of small molecule target binding in cells.
Abundances of placental imprinted genes CDKN1C, PHLDA2 and IGF-2 are related to low birth weight and early catch-up growth in full-term infants born small for gestational age.
Cho KF, Ma TP, Rose CM, Kirkpatrick DS, Yu K, Blake RA
Nature communications 2020 Jan 23;11(1):465
Nature communications 2020 Jan 23;11(1):465
Abundances of placental imprinted genes CDKN1C, PHLDA2 and IGF-2 are related to low birth weight and early catch-up growth in full-term infants born small for gestational age.
Xing Y, Liu H, Cui Y, Wang X, Tong X
PloS one 2019;14(6):e0218278
PloS one 2019;14(6):e0218278
No comments: Submit comment
Supportive validation
- Submitted by
- Invitrogen Antibodies (provider)
- Main image
- Experimental details
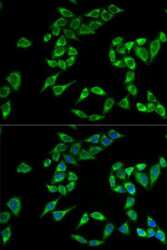
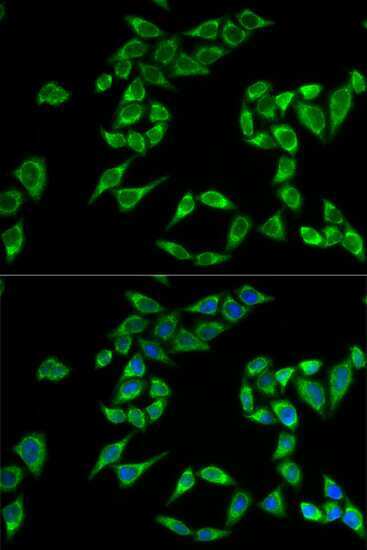
- Immunofluorescence analysis of PHLDA2 in HeLa cells. Samples were incubated with PHLDA2 polyclonal antibody (Product # PA5-76870).
Supportive validation
- Submitted by
- Invitrogen Antibodies (provider)
- Main image
- Experimental details
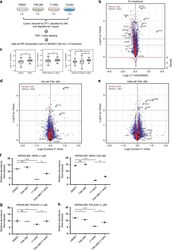
- Fig. 4 Mass spectrometry-based proteomics identifies TAK-285 cellular protein targets. a Schematic illustration of experimental design for global proteomics profiling. MCF-7 neoHER2 cells were treated with DMSO, TAK-285 (100 nM or 1 uM), 17-AAG (1 µM), or pretreated with TAK-285 (100 nM or 1 uM), followed by 17-AAG (1 µM). 17-AAG treatment time is 8 h (for the 100 nM set) and 6 h (for the 1 uM set). b Volcano plot depicting the fold-change in protein abundance in MCF-7 neoHER2 cells treated with 17-AAG (8 h) relative to DMSO samples. Each circle represents an individual protein with the color representing protein class (kinase: red; others: blue). X-axis: log2 transformed ratio of the protein levels in the 17-AAG treated samples and the DMSO treated samples. Y-axis: -log10 transformed p-value (dotted lines indicate p = 0.05 and p = 0.01; two-tailed student's t -test). Density curves for the two protein groups are shown at the bottom. c Distribution of ratio changes between 17-AAG (8 h) and DMSO in protein groups: by protein function, HSP90-interaction, or HSP90 dependency ( p < 0.00001 (***)) by Welch two-sample t-test (box plots show minimum, first quartile, median, third quartile, and maximum). d , e Volcano plot showing the fold change in protein abundance in MCF-7 neoHER2 cells treated with a combination of 17-AAG and TAK-285, 100 nM d or 1 uM e relative to 17-AAG only samples. Annotated proteins (and alternative gene names) include: ERBB2 (H
