Explore
 Validate
 Learn
Learn700012
antibody from Invitrogen Antibodies
Targeting: MAPK3
ERK1, p44erk1, p44mapk, PRKM3
 Western blot
 ELISA
ELISA Immunocytochemistry Immunohistochemistry Flow cytometry Chromatin Immunoprecipitation Other assay
Antibody data
- Antibody Data
- Antigen structure
- References [0]
- Comments [0]
- Validations
- Immunocytochemistry [4]
- Immunohistochemistry [1]
- Flow cytometry [1]
- Other assay [4]
Submit
Validation data
Reference
Comment
Report error
- Product number
- 700012 - Provider product page

- Provider
- Invitrogen Antibodies
- Product name
- Phospho-ERK1/ERK2 (Thr185, Tyr187) Recombinant Rabbit Monoclonal Antibody (15H10L7)
- Antibody type
- Monoclonal
- Antigen
- Synthetic peptide
- Description
- 700012 has successfully been used in western blot to detect phospho-ERK1/2 in TPA-treated HeLa, NRK and MDCK cell lysates. This antibody is predicted to react with bovine, chicken, chimpanzee, mouse, rat, Xenopus and zebrafish based on sequence homology. Intact IgG appears on a non-reducing gel as ~150 kDa band and upon reduction generating a ~25 kDa light chain band and a ~50 kDa heavy chain. Recombinant rabbit monoclonal antibodies are produced using in vitro expression systems. The expression systems are developed by cloning in the specific antibody DNA sequences from immunoreactive rabbits. Then, individual clones are screened to select the best candidates for production. The advantages of using recombinant rabbit monoclonal antibodies include: better specificity and sensitivity, lot-to-lot consistency, animal origin-free formulations, and broader immunoreactivity to diverse targets due to larger rabbit immune repertoire.
- Reactivity
- Human, Rat, Canine
- Host
- Rabbit
- Isotype
- IgG
- Antibody clone number
- 15H10L7
- Vial size
- 100 μg
- Concentration
- 0.5 mg/mL
- Storage
- Store at 4°C short term. For long term storage, store at -20°C, avoiding freeze/thaw cycles.
No comments: Submit comment
Supportive validation
- Submitted by
- Invitrogen Antibodies (provider)
- Main image

- Experimental details
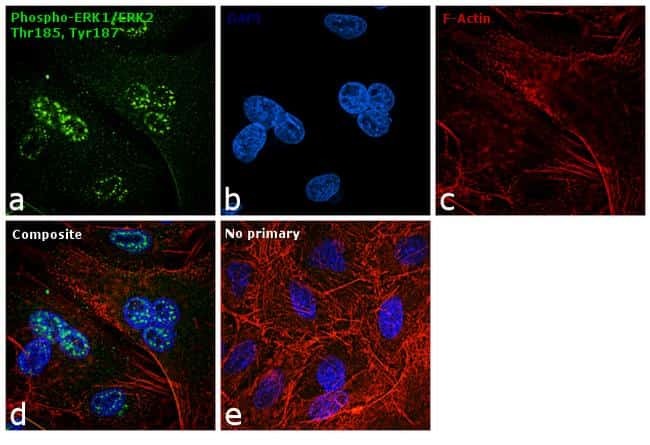
- Immunofluorescence analysis of Phosph-ERK1/2 (Thr 185,Tyr187) was performed using 70% confluent log phase A549 cells. The cells were fixed with 4% paraformaldehyde for 10 minutes, permeabilized with 0.1% Triton™ X-100 for 10 minutes, and blocked with 1% BSA for 1 hour at room temperature. The cells were labeled with ERK2 Rabbit monoclonal Antibody (Product # 700012) at 5 µg/mL in 0.1% BSA and incubated overnight at 4 degree Celsius and then labeled with Goat anti-Rabbit IgG (H+L) Superclonal™ Secondary Antibody, Alexa Fluor® 488 conjugate (Product # A27034) at a dilution of 1:2000 for 45 minutes at room temperature (Panel a: green). Nuclei (Panel b: blue) were stained with SlowFade® Gold Antifade Mountant with DAPI (Product # S36938). F-actin (Panel c: red) was stained with Rhodamine Phalloidin (Product # R415, 1:300). Panel d represents the merged image showing nuclear localization. Panel e represents control cells with no primary antibody to assess background. The images were captured at 60X magnification.
- Submitted by
- Invitrogen Antibodies (provider)
- Main image

- Experimental details
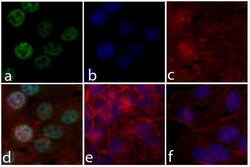
- Immunofluorescent analysis of ERK 1/2 (pTpY185/187) was done on 70% confluent log phase HeLa cells. The cells were fixed with 4% paraformaldehyde for 15 minutes; permeabilized with 0.25% Triton X-100 for 10 minutes followed by blocking with 5% BSA for 1 hour at room temperature. The cells were incubated with ERK 1/2 (pTpY185/187) Recombinant Rabbit Monoclonal Antibody (Product # 700012) at 2 µg-4 µg in 1% BSA and incubated for 3 hours at room temperature and then labeled with Alexa Fluor® 488 Goat anti-Rabbit IgG Secondary Antibody (Product # A-11008) at a dilution of 1:400 for 30 minutes at room temperature (Panel a: green). Nuclei (Panel b: blue) were stained with SlowFade® Gold Antifade Mountant with DAPI (Product # S36938). F-actin (Panel c: red) was stained with Alexa Fluor® 594 Phalloidin (Product # A12381). Panel d is a merged image showing ERK 1/2 (pTpY185/187) in nucleus. Panel e shows no primary antibody control. Panel f shows competition with ERK 1/2 (pTpY185/187) peptide. The images were captured at 20X magnification.

- Submitted by
- Invitrogen Antibodies (provider)
- Main image

- Experimental details
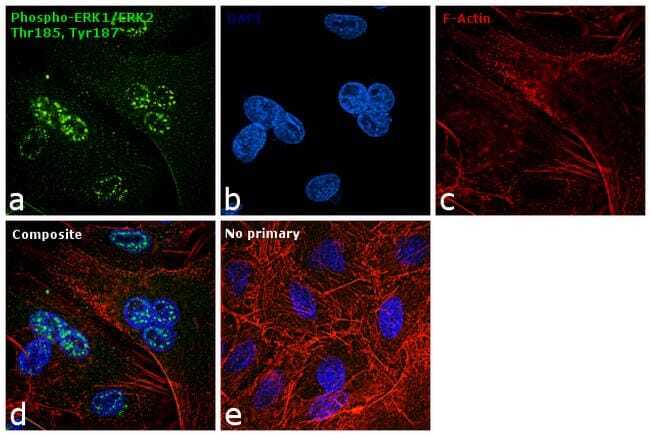
- Immunofluorescence analysis of Phosph-ERK1/2 (Thr 185,Tyr187) was performed using 70% confluent log phase A549 cells. The cells were fixed with 4% paraformaldehyde for 10 minutes, permeabilized with 0.1% Triton™ X-100 for 10 minutes, and blocked with 1% BSA for 1 hour at room temperature. The cells were labeled with ERK2 Rabbit monoclonal Antibody (Product # 700012) at 5 µg/mL in 0.1% BSA and incubated overnight at 4 degree Celsius and then labeled with Goat anti-Rabbit IgG (Heavy Chain) Superclonal™ Secondary Antibody, Alexa Fluor® 488 conjugate (Product # A27034) at a dilution of 1:2000 for 45 minutes at room temperature (Panel a: green). Nuclei (Panel b: blue) were stained with SlowFade® Gold Antifade Mountant with DAPI (Product # S36938). F-actin (Panel c: red) was stained with Rhodamine Phalloidin (Product # R415, 1:300). Panel d represents the merged image showing nuclear localization. Panel e represents control cells with no primary antibody to assess background. The images were captured at 60X magnification.
- Submitted by
- Invitrogen Antibodies (provider)
- Main image
- Experimental details
- Immunofluorescent analysis of ERK 1/2 (pTpY185/187) was done on 70% confluent log phase HeLa cells. The cells were fixed with 4% paraformaldehyde for 15 minutes; permeabilized with 0.25% Triton X-100 for 10 minutes followed by blocking with 5% BSA for 1 hour at room temperature. The cells were incubated with ERK 1/2 (pTpY185/187) Recombinant Rabbit Monoclonal Antibody (Product # 700012) at 2 µg-4 µg in 1% BSA and incubated for 3 hours at room temperature and then labeled with Alexa Fluor® 488 Goat anti-Rabbit IgG Secondary Antibody (Product # A-11008) at a dilution of 1:400 for 30 minutes at room temperature (Panel a: green). Nuclei (Panel b: blue) were stained with SlowFade® Gold Antifade Mountant with DAPI (Product # S36938). F-actin (Panel c: red) was stained with Alexa Fluor® 594 Phalloidin (Product # A12381). Panel d is a merged image showing ERK 1/2 (pTpY185/187) in nucleus. Panel e shows no primary antibody control. Panel f shows competition with ERK 1/2 (pTpY185/187) peptide. The images were captured at 20X magnification.

Supportive validation
- Submitted by
- Invitrogen Antibodies (provider)
- Main image

- Experimental details
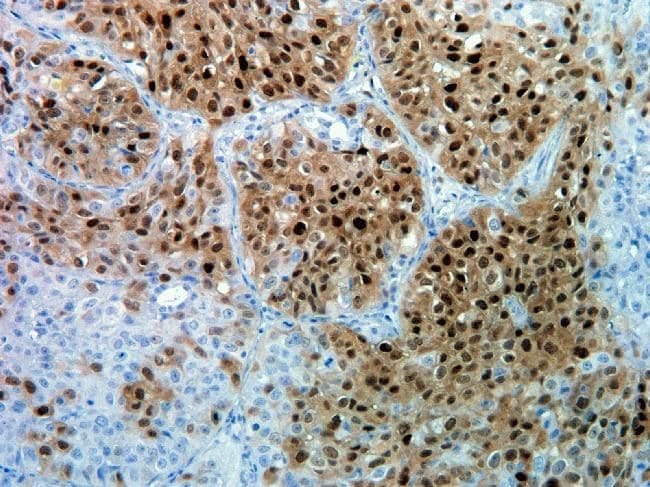
- Immunohistochemistry analysis of Phospho-ERK1/ERK2 pThr185/pTyr187 in formalin-fixed, paraffin-embedded human lung carcinoma tissue using a Phospho-ERK1/ERK2 pThr185/pTyr187 monoclonal antibody (Product # 700012) at a dilution of 5 µg/mL. Tissues were pretreated with EDTA and staining was visualized using DAB. Images were taken at a magnification of 20x. Results show nuclear and cytoplasmic staining in tumor cells.
Supportive validation
- Submitted by
- Invitrogen Antibodies (provider)
- Main image

- Experimental details
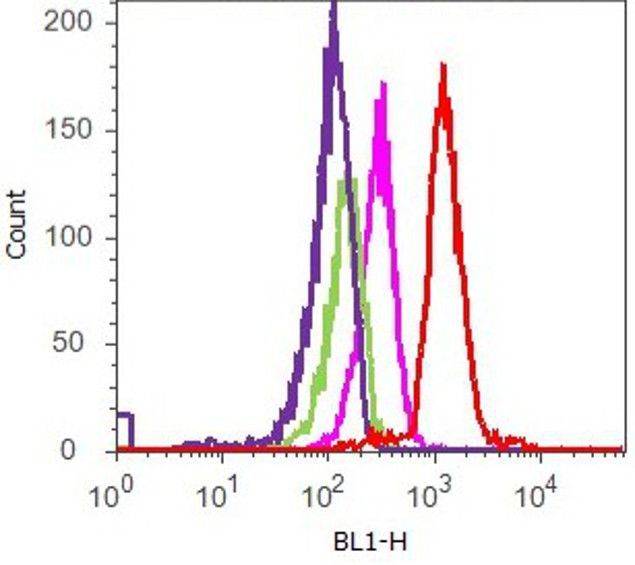
- Flow cytometry analysis of ERK 1/2 [pTpY185/187] was done on HeLa cells treated with PDGF (50 ng/ml,30 minutes). Cells were fixed with 70% ethanol for 10 minutes, permeabilized with 0.25% Tritonª X-100 for 20 minutes, and blocked with 5% BSA for 1 hour at room temperature. Cells were labeled with ABfinityª ERK 1/2 [pTpY185/187] Recombinant Rabbit Monoclonal Antibody (700012, red histogram) or with rabbit isotype control (pink histogram) at 2 µg-4 µg/million cells in 2.5% BSA. After incubation at room temperature for 2-3 hours, the cells were labeled with Alexa Fluor¨ 488 Goat Anti-Rabbit Secondary Antibody (A11008) at a dilution of 1:400 for 30 minutes at room temperature. The representative 10,000 cells were acquired and analyzed for each sample using an Attune¨ Acoustic Focusing Cytometer. The purple histogram represents unstained control cells and the green histogram represents no-primary-antibody control.
Supportive validation
- Submitted by
- Invitrogen Antibodies (provider)
- Main image
- Experimental details
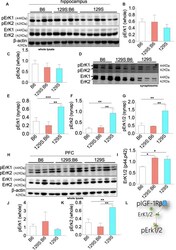
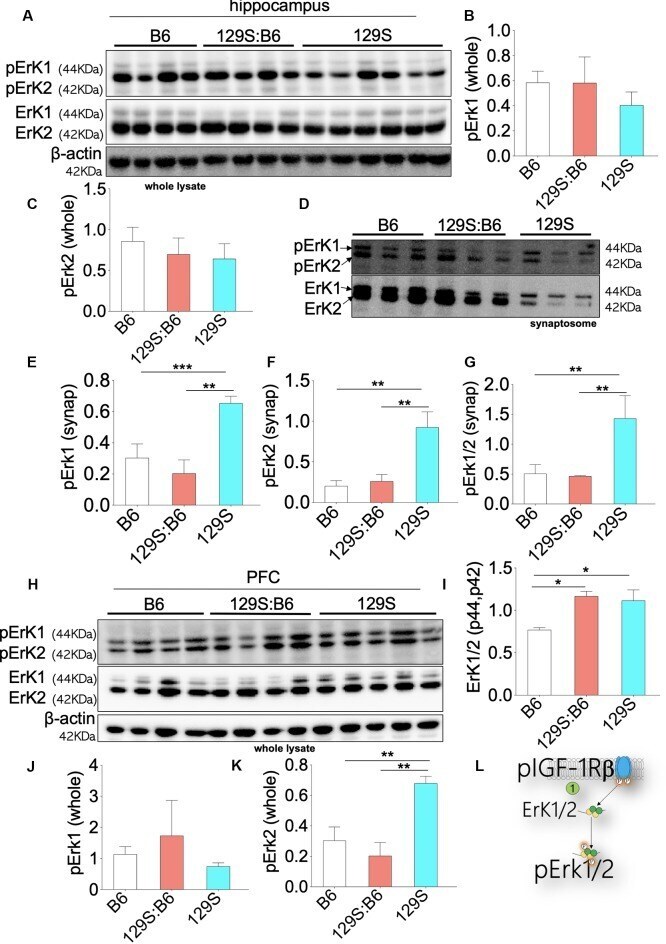
- Figure 6 Erk1/2 expression in the B6, 129S:B6 and 129S brain. (A) Immunoblots demonstrating the expression of Erk1/2 and pErk1/2 in the hippocampus. (B,C) Bar graph illustrating Erk (1 and 2) normalized pErk1 and pErk2 expression in the whole hippocampal lysate. (D) Representative western blots illustrating the expression of pErk1 and pErk2 in hippocampal synaptosomal extracts. (E-G) Bar graphs representing Erk normalized pErk1, pErk2, and total pErk1/2 expression in hippocampal synaptosomal extracts. (H) Immunoblots illustrating prefrontal total cortical Erk1/2 expression. (I) Bar graph demonstrating a significant increase in total PFC Erk1/2 expression for the 129S:B6 and 129S mice. (J,K) Bar graph representing the expression of Erk normalized pErk1 and pErk2 expression in cortical whole lysate. (L) Schematic illustration demonstrating an increase in cortical Erk1/2 expression. [ (E-G,I,K) ; * p < 0.05, ** p < 0.01, and *** p < 0.001].
- Submitted by
- Invitrogen Antibodies (provider)
- Main image

- Experimental details
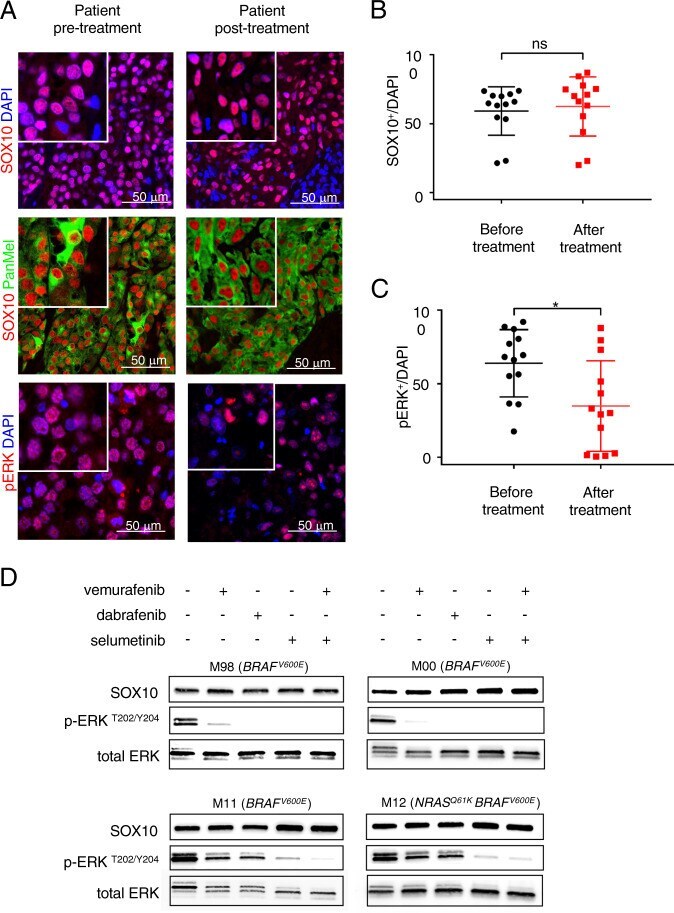
- Fig. 1 Clinically used targeted BRAF or MEK inhibitors do not interfere with SOX10 expression levels. a Representative images of immunohistochemical stainings of human melanoma patient derived biopsies ( n = 13) before (left panel) and after (right panel) combined BRAF and MEK inhibitor treatment stained for SOX10 (red), pERK (red) and Pan Melanoma (PanMel), a cocktail of Melanoma antigen recognized by T cells-1 (MART-1) and Tyrosinase (green). Nuclei were counterstained with DAPI (blue). b Quantification of SOX10 expression levels pre- and post-BRAF and MEK inhibitor treatment. c Quantification of pERK expression levels pre- and post-BRAF and MEK inhibitor treatment. d Representative western blot for the indicated proteins in four different human melanoma cell lines. Levels of SOX10 expression are not decreased upon treatment with BRAF inhibitors (vemurafenib and dabrafenib, each 1 muM) or MEK inhibitor (selumetinib, 1 muM) after 24 h neither in single, nor in double treatments (vemurafenib and selumetinib). In MAPK inhibitor sensitive cell lines (M98, M00) pERK levels are not detectable anymore, which indicates the correct function of the drugs, whereas in resistant cell cultures (M11, M12) pERK levels were not affected ( n = 3). In b and c data represent mean +- s.d. Statistical significance was determined by paired, two-tailed Student''s t test. * P < 0.05, ** P < 0.01, *** P < 0.001 Western blots shown in d are representative. In each panel, n indicates the number of ind
- Submitted by
- Invitrogen Antibodies (provider)
- Main image
- Experimental details
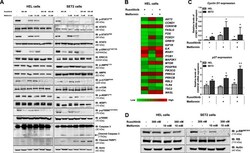
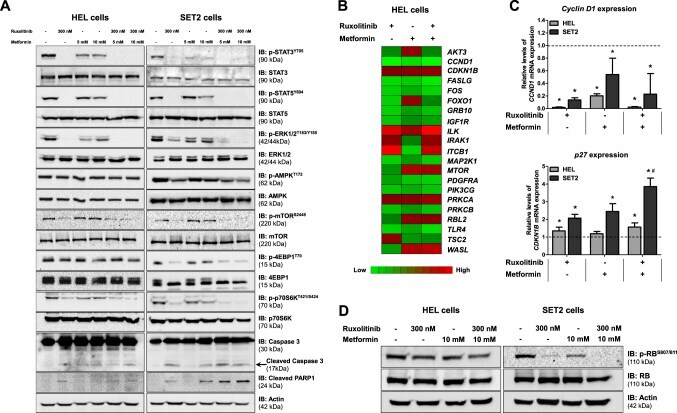
- Fig. 3 Metformin and ruxolitinib modulate JAK2/STAT signaling and PI3K/AKT-related genes in HEL and SET2 cells. a Western blot analysis for p-STAT3 Y705 , p-STAT5 Y694 , p-ERK1/2 T183/Y185 , p-AMPK T172 , p-mTOR S2448 , p-4EBP1 T70 , p-p70S6K T421/S424 , caspase 3 (total and cleaved) and cleaved PARP1 levels in total cell extracts from HEL and SET2 cells treated with the indicated concentrations of ruxolitinib and/or metformin; membranes were reprobed with the antibody for the detection of the respective total protein or actin, and developed with the SuperSignal(tm) West Dura Extended Duration Substrate system using a Gel Doc XR+ imaging system. b Gene expression heatmap from qPCR array analysis of HEL cells treated with ruxolitinib (300 nM) and/or metformin (10 mM). mRNA levels are normalized to those of untreated HEL cells and calculated as fold change in expression; genes demonstrating >=1.5-fold in either direction compared to untreated cells in any treatment are included in the heat map. Two independent experiments of each condition were used for the analysis; green indicates repressed mRNA levels and red elevated mRNA levels. c qPCR analysis of CCND1 and CDKN1B mRNA expression in HEL and SET2 cells treated with ruxolitinib (300 nM) and/or metformin (10 mM) for 48 h. The dashed line represents the mean gene expression in untreated cells and bars represent the fold change in gene expression in HEL and SET2 cells treated with ruxolitinib, metformin, or both compar
- Submitted by
- Invitrogen Antibodies (provider)
- Main image

- Experimental details
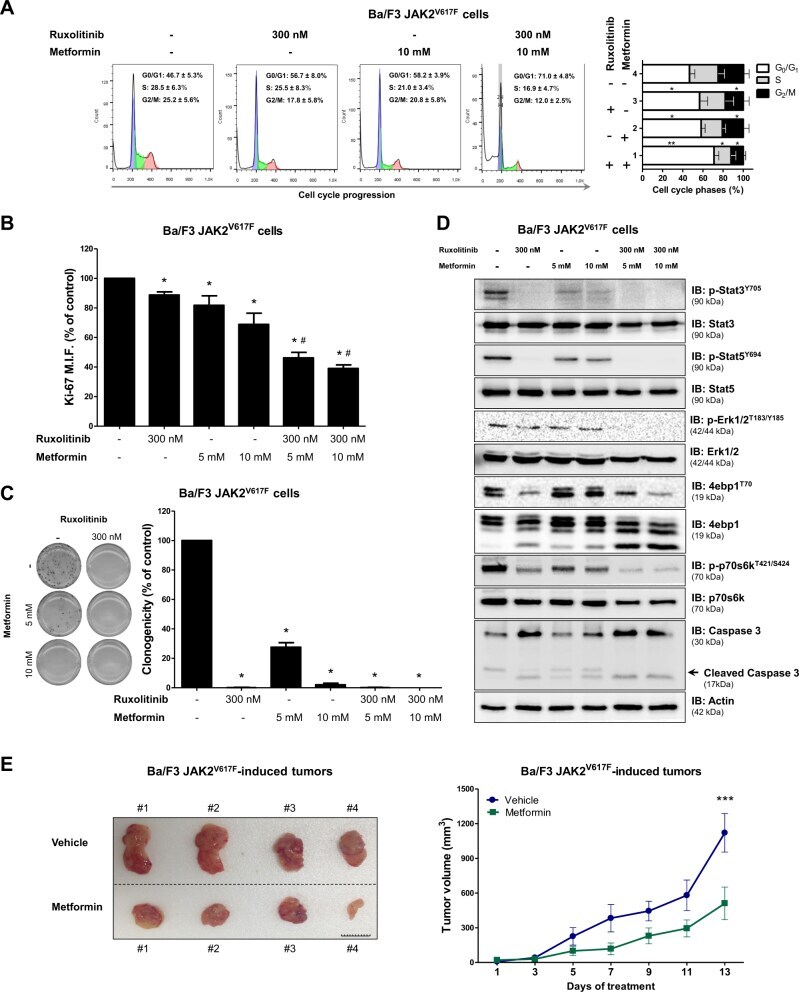
- Fig. 4 Metformin delays cell cycle progression, reduces colony formation, downregulates JAK2/STAT activation and decreases tumor burden in Ba/F3 JAK2 V617F cells. a Cell cycle phase profiling was determined by BD Cycletest(tm) Plus DNA Reagent Kit in Ba/F3 JAK2 V617F cells treated with ruxolitinib and/or metformin for 24 h. A representative histogram for each condition is illustrated. Bar graphs represent the mean +- SD of the fraction of cells in G 0 /G 1 , S and G 2 /M phase for each treatment condition across at least four independent experiments. b Ki-67 MFI was determined by flow cytometry after incubation of Ba/F3 JAK2 V617F cells treated with the indicated concentrations of ruxolitinib and/or metformin for 24 h. The Ki-67 M.F.I was normalized to the respective untreated control cells and results are shown as the mean +- SD of four independent experiments. c Colonies containing viable cells were detected by MTT after 10 days of culture of Ba/F3 JAK2 V617F cells treated with ruxolitinib and/or metformin and normalized to the corresponding untreated controls. Colony images are shown for one experiment and the bar graphs show the mean +- SD of at least four independent experiments. d Western blot analysis for p-Stat3 Y705 , p-Stat5 Y694 , p-Erk1/2 T183/Y185 , p-4ebp1 T70 , p-p70s6k T421/S424 and caspase 3 (total and cleaved) levels in total cell extracts from Ba/F3 JAK2 V617F cells treated with ruxolitinib and/or metformin for 24 h; membranes were reprobed wit