Explore
 Validate
 Learn
LearnMA1-41017
antibody from Invitrogen Antibodies
Targeting: MYOD1
bHLHc1, MYF3, MYOD, PUM
 Western blot Immunocytochemistry
 Immunoprecipitation Immunohistochemistry Flow cytometry Other assay
Antibody data
- Antibody Data
- Antigen structure
- References [21]
- Comments [0]
- Validations
- Western blot [2]
- Immunocytochemistry [2]
- Immunohistochemistry [1]
- Other assay [9]
Submit
Validation data
Reference
Comment
Report error
- Product number
- MA1-41017 - Provider product page

- Provider
- Invitrogen Antibodies
- Product name
- MYOD Monoclonal Antibody (5.8A)
- Antibody type
- Monoclonal
- Antigen
- Recombinant full-length protein
- Description
- The epitope of this antibody was mapped to a region within AA 180-189 of mouse MyoD. Suggested positive control: Rh-30.
- Reactivity
- Human, Mouse
- Host
- Mouse
- Isotype
- IgG
- Antibody clone number
- 5.8A
- Vial size
- 100 μg
- Concentration
- 1.0 mg/mL
- Storage
- Store at 4°C short term. For long term storage, store at -20°C, avoiding freeze/thaw cycles.
Submitted references Growth Factors Do Not Improve Muscle Function in Young or Adult mdx Mice.
RNA-Seq analysis of a Pax3-expressing myoblast clone in-vitro and effect of culture surface stiffness on differentiation.
Filopodia powered by class x myosin promote fusion of mammalian myoblasts.
The ESCRT-0 subcomplex component Hrs/Hgs is a master regulator of myogenesis via modulation of signaling and degradation pathways.
Advanced Glycation End Products Are Retained in Decellularized Muscle Matrix Derived from Aged Skeletal Muscle.
Ganoderma microsporum immunomodulatory protein, GMI, promotes C2C12 myoblast differentiation in vitro via upregulation of Tid1 and STAT3 acetylation.
MicroRNA-672-5p Identified during Weaning Reverses Osteopenia and Sarcopenia in Ovariectomized Mice.
Angiotensin-II-induced Muscle Wasting is Mediated by 25-Hydroxycholesterol via GSK3β Signaling Pathway.
Thyroid Hormone Stimulation of Autophagy Is Essential for Mitochondrial Biogenesis and Activity in Skeletal Muscle.
Synthetic niche to modulate regenerative potential of MSCs and enhance skeletal muscle regeneration.
The role of TORC1 in muscle development in Drosophila.
CD13 regulates anchorage and differentiation of the skeletal muscle satellite stem cell population in ischemic injury.
Molecular characterization of an EWSR1-POU5F1 fusion associated with a t(6;22) in an undifferentiated soft tissue sarcoma.
MyoD regulates apoptosis of myoblasts through microRNA-mediated down-regulation of Pax3.
CD90-positive cells, an additional cell population, produce laminin alpha2 upon transplantation to dy(3k)/dy(3k) mice.
Molecular signature of quiescent satellite cells in adult skeletal muscle.
ADP-ribosylation of integrin alpha7 modulates the binding of integrin alpha7beta1 to laminin.
Role of metalloprotease disintegrin ADAM12 in determination of quiescent reserve cells during myogenic differentiation in vitro.
MyoD and myogenin protein expression in skeletal muscles of senile rats.
Roles of peroxisome proliferator-activated receptors delta and gamma in myoblast transdifferentiation.
Roles of peroxisome proliferator-activated receptors delta and gamma in myoblast transdifferentiation.
Nielsen TL, Hornsyld TM, Pinós T, Brolin C, Vissing J, Krag TO
Biomedicines 2022 Jan 28;10(2)
Biomedicines 2022 Jan 28;10(2)
RNA-Seq analysis of a Pax3-expressing myoblast clone in-vitro and effect of culture surface stiffness on differentiation.
Richardson L, Wang D, Hughes R, Johnson CA, Peckham M
Scientific reports 2022 Feb 18;12(1):2841
Scientific reports 2022 Feb 18;12(1):2841
Filopodia powered by class x myosin promote fusion of mammalian myoblasts.
Hammers DW, Hart CC, Matheny MK, Heimsath EG, Lee YI, Hammer JA 3rd, Cheney RE, Sweeney HL
eLife 2021 Sep 14;10
eLife 2021 Sep 14;10
The ESCRT-0 subcomplex component Hrs/Hgs is a master regulator of myogenesis via modulation of signaling and degradation pathways.
Coudert L, Osseni A, Gangloff YG, Schaeffer L, Leblanc P
BMC biology 2021 Jul 30;19(1):153
BMC biology 2021 Jul 30;19(1):153
Advanced Glycation End Products Are Retained in Decellularized Muscle Matrix Derived from Aged Skeletal Muscle.
Olson LC, Nguyen TM, Heise RL, Boyan BD, Schwartz Z, McClure MJ
International journal of molecular sciences 2021 Aug 17;22(16)
International journal of molecular sciences 2021 Aug 17;22(16)
Ganoderma microsporum immunomodulatory protein, GMI, promotes C2C12 myoblast differentiation in vitro via upregulation of Tid1 and STAT3 acetylation.
Teo WH, Lo JF, Fan YN, Huang CY, Huang TF
PloS one 2020;15(12):e0244791
PloS one 2020;15(12):e0244791
MicroRNA-672-5p Identified during Weaning Reverses Osteopenia and Sarcopenia in Ovariectomized Mice.
Ahmad N, Kushwaha P, Karvande A, Tripathi AK, Kothari P, Adhikary S, Khedgikar V, Mishra VK, Trivedi R
Molecular therapy. Nucleic acids 2019 Mar 1;14:536-549
Molecular therapy. Nucleic acids 2019 Mar 1;14:536-549
Angiotensin-II-induced Muscle Wasting is Mediated by 25-Hydroxycholesterol via GSK3β Signaling Pathway.
Shen C, Zhou J, Wang X, Yu XY, Liang C, Liu B, Pan X, Zhao Q, Song JL, Wang J, Bao M, Wu C, Li Y, Song YH
EBioMedicine 2017 Feb;16:238-250
EBioMedicine 2017 Feb;16:238-250
Thyroid Hormone Stimulation of Autophagy Is Essential for Mitochondrial Biogenesis and Activity in Skeletal Muscle.
Lesmana R, Sinha RA, Singh BK, Zhou J, Ohba K, Wu Y, Yau WW, Bay BH, Yen PM
Endocrinology 2016 Jan;157(1):23-38
Endocrinology 2016 Jan;157(1):23-38
Synthetic niche to modulate regenerative potential of MSCs and enhance skeletal muscle regeneration.
Pumberger M, Qazi TH, Ehrentraut MC, Textor M, Kueper J, Stoltenburg-Didinger G, Winkler T, von Roth P, Reinke S, Borselli C, Perka C, Mooney DJ, Duda GN, Geißler S
Biomaterials 2016 Aug;99:95-108
Biomaterials 2016 Aug;99:95-108
The role of TORC1 in muscle development in Drosophila.
Hatfield I, Harvey I, Yates ER, Redd JR, Reiter LT, Bridges D
Scientific reports 2015 Apr 13;5:9676
Scientific reports 2015 Apr 13;5:9676
CD13 regulates anchorage and differentiation of the skeletal muscle satellite stem cell population in ischemic injury.
Rahman MM, Ghosh M, Subramani J, Fong GH, Carlson ME, Shapiro LH
Stem cells (Dayton, Ohio) 2014 Jun;32(6):1564-77
Stem cells (Dayton, Ohio) 2014 Jun;32(6):1564-77
Molecular characterization of an EWSR1-POU5F1 fusion associated with a t(6;22) in an undifferentiated soft tissue sarcoma.
Deng FM, Galvan K, de la Roza G, Zhang S, Souid AK, Stein CK
Cancer genetics 2011 Aug;204(8):423-9
Cancer genetics 2011 Aug;204(8):423-9
MyoD regulates apoptosis of myoblasts through microRNA-mediated down-regulation of Pax3.
Hirai H, Verma M, Watanabe S, Tastad C, Asakura Y, Asakura A
The Journal of cell biology 2010 Oct 18;191(2):347-65
The Journal of cell biology 2010 Oct 18;191(2):347-65
CD90-positive cells, an additional cell population, produce laminin alpha2 upon transplantation to dy(3k)/dy(3k) mice.
Fukada S, Yamamoto Y, Segawa M, Sakamoto K, Nakajima M, Sato M, Morikawa D, Uezumi A, Miyagoe-Suzuki Y, Takeda S, Tsujikawa K, Yamamoto H
Experimental cell research 2008 Jan 1;314(1):193-203
Experimental cell research 2008 Jan 1;314(1):193-203
Molecular signature of quiescent satellite cells in adult skeletal muscle.
Fukada S, Uezumi A, Ikemoto M, Masuda S, Segawa M, Tanimura N, Yamamoto H, Miyagoe-Suzuki Y, Takeda S
Stem cells (Dayton, Ohio) 2007 Oct;25(10):2448-59
Stem cells (Dayton, Ohio) 2007 Oct;25(10):2448-59
ADP-ribosylation of integrin alpha7 modulates the binding of integrin alpha7beta1 to laminin.
Zhao Z, Gruszczynska-Biegala J, Zolkiewska A
The Biochemical journal 2005 Jan 1;385(Pt 1):309-17
The Biochemical journal 2005 Jan 1;385(Pt 1):309-17
Role of metalloprotease disintegrin ADAM12 in determination of quiescent reserve cells during myogenic differentiation in vitro.
Cao Y, Zhao Z, Gruszczynska-Biegala J, Zolkiewska A
Molecular and cellular biology 2003 Oct;23(19):6725-38
Molecular and cellular biology 2003 Oct;23(19):6725-38
MyoD and myogenin protein expression in skeletal muscles of senile rats.
Dedkov EI, Kostrominova TY, Borisov AB, Carlson BM
Cell and tissue research 2003 Mar;311(3):401-16
Cell and tissue research 2003 Mar;311(3):401-16
Roles of peroxisome proliferator-activated receptors delta and gamma in myoblast transdifferentiation.
Holst D, Luquet S, Kristiansen K, Grimaldi PA
Experimental cell research 2003 Aug 1;288(1):168-76
Experimental cell research 2003 Aug 1;288(1):168-76
Roles of peroxisome proliferator-activated receptors delta and gamma in myoblast transdifferentiation.
Holst D, Luquet S, Kristiansen K, Grimaldi PA
Experimental cell research 2003 Aug 1;288(1):168-76
Experimental cell research 2003 Aug 1;288(1):168-76
No comments: Submit comment
Supportive validation
- Submitted by
- Invitrogen Antibodies (provider)
- Main image
- Experimental details
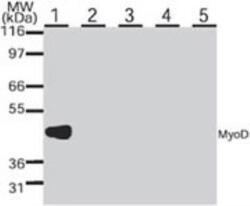
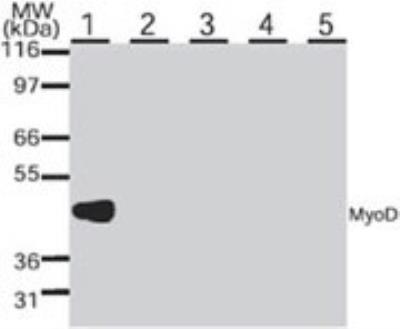
- Western blot analysis of MYOD in various small round cell tumor lines. Samples were incubated in MYOD monoclonal antibody (Product # MA1-41017 using a dilution of 1 µg/mL. The antibody only reacts with a band of approx. 45 kDa in the rhabdomyosarcoma cell line (Rh30, lane 1) but was negative against the primitive neuroectodermal (PFSK-1A, lane 2), lymphoma (EB2, lane 3), neuroblastoma (SK-N-SH, lane 4), and Ewings sarcoma (SJSA-1, lane 5) cell lines.
- Submitted by
- Invitrogen Antibodies (provider)
- Main image
- Experimental details
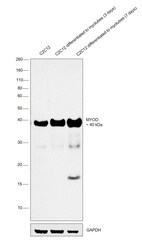
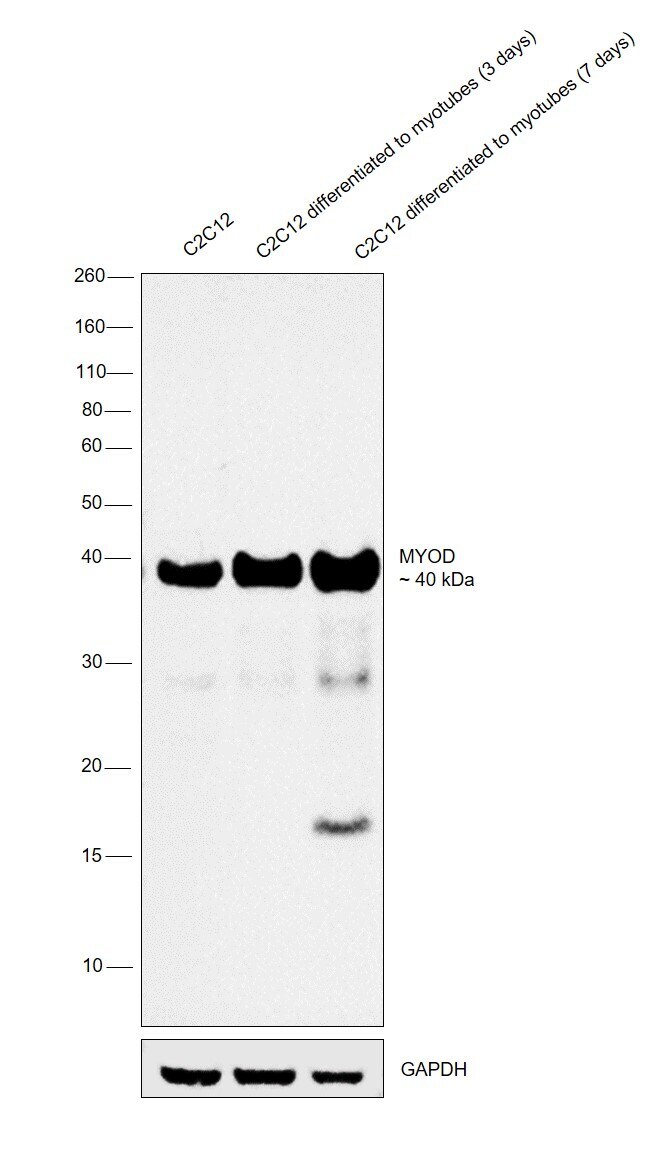
- Western blot was performed using Anti-MYOD Monoclonal Antibody (Product # MA1-41017) and a 40kDa band corresponding to MYOD was observed across cell lines tested and was observed to increase upon C2C12 differentiated to 3 and 7 days respectively. Modified whole cell extracts (1% SDS) (30 µg lysate) of C2C12 (Lane 1), C2C12 differentiated to myotubes (3 days) (Lane 2) and C2C12 differentiated to myotubes (7 days) (Lane 3) were electrophoresed using Novex® NuPAGE® 4-12 % Bis-Tris gel (Product # NP0322BOX). Resolved proteins were then transferred onto a nitrocellulose membrane (Product # IB23001) by iBlot® 2 Dry Blotting System (Product # IB21001). The blot was probed with the primary antibody (1ug/ml) and detected by chemiluminescence with Goat anti-Mouse IgG (H+L), Superclonal™ Recombinant Secondary Antibody, HRP (Product # A28177, 1:4000 dilution) using the iBright FL 1000 (Product # A32752). Chemiluminescent detection was performed using Novex® ECL Chemiluminescent Substrate Reagent Kit (Product # WP20005).
Supportive validation
- Submitted by
- Invitrogen Antibodies (provider)
- Main image
- Experimental details
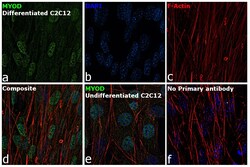
- Immunofluorescence analysis of MYOD was performed using 70% confluent log phase differentiated C2C12 cells. The cells were fixed with 4% paraformaldehyde for 10 minutes, permeabilized with 0.1% Triton™ X-100 for 15 minutes, and blocked with 2% BSA for 1 hour at room temperature. The cells were labeled with MYOD monoclonal antibody (Product # MA1-41017) at 5 µg/mL dilution in 0.1% BSA, incubated at 4 degree Celsius overnight and then labeled with Goat anti-Mouse IgG (H+L), Superclonal™ Recombinant Secondary Antibody, Alexa Fluor 488 conjugate (Product # A28175) at a dilution of 1:2000 for 45 minutes at room temperature (Panel a: green). Nuclei (Panel b: blue) were stained with ProLong™ Diamond Antifade Mountant with DAPI (Product # P36962). F-actin (Panel c: red) was stained with Rhodamine Phalloidin (Product # R415). Panel d represents the merged image. Panel e represents undifferentiated C2C12 cells. Panel f represents control cells with no primary antibody to assess background. The images were captured at 60X magnification.

- Submitted by
- Invitrogen Antibodies (provider)
- Main image

- Experimental details
- Immunofluorescence analysis of MYOD was performed using 70% confluent log phase differentiated C2C12 cells. The cells were fixed with 4% paraformaldehyde for 10 minutes, permeabilized with 0.1% Triton™ X-100 for 15 minutes, and blocked with 2% BSA for 1 hour at room temperature. The cells were labeled with MYOD monoclonal antibody (Product # MA1-41017) at 5 µg/mL dilution in 0.1% BSA, incubated at 4 degree Celsius overnight and then labeled with Goat anti-Mouse IgG (H+L), Superclonal™ Recombinant Secondary Antibody, Alexa Fluor 488 conjugate (Product # A28175) at a dilution of 1:2000 for 45 minutes at room temperature (Panel a: green). Nuclei (Panel b: blue) were stained with ProLong™ Diamond Antifade Mountant with DAPI (Product # P36962). F-actin (Panel c: red) was stained with Rhodamine Phalloidin (Product # R415). Panel d represents the merged image. Panel e represents undifferentiated C2C12 cells. Panel f represents control cells with no primary antibody to assess background. The images were captured at 60X magnification.

Supportive validation
- Submitted by
- Invitrogen Antibodies (provider)
- Main image

- Experimental details
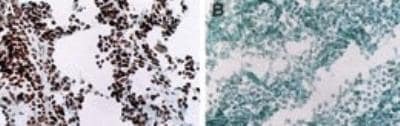
- Immunohistochemical analysis of MYOD in human tissues. Frozen samples were incubated in MYOD monoclonal antibody (Product # MA1-41017). A. Rhabdomyosaroma (nuclei are stained), B. Lymphoma (staining is absent).
Supportive validation
- Submitted by
- Invitrogen Antibodies (provider)
- Main image
- Experimental details
- NULL

- Submitted by
- Invitrogen Antibodies (provider)
- Main image
- Experimental details
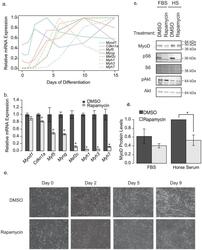
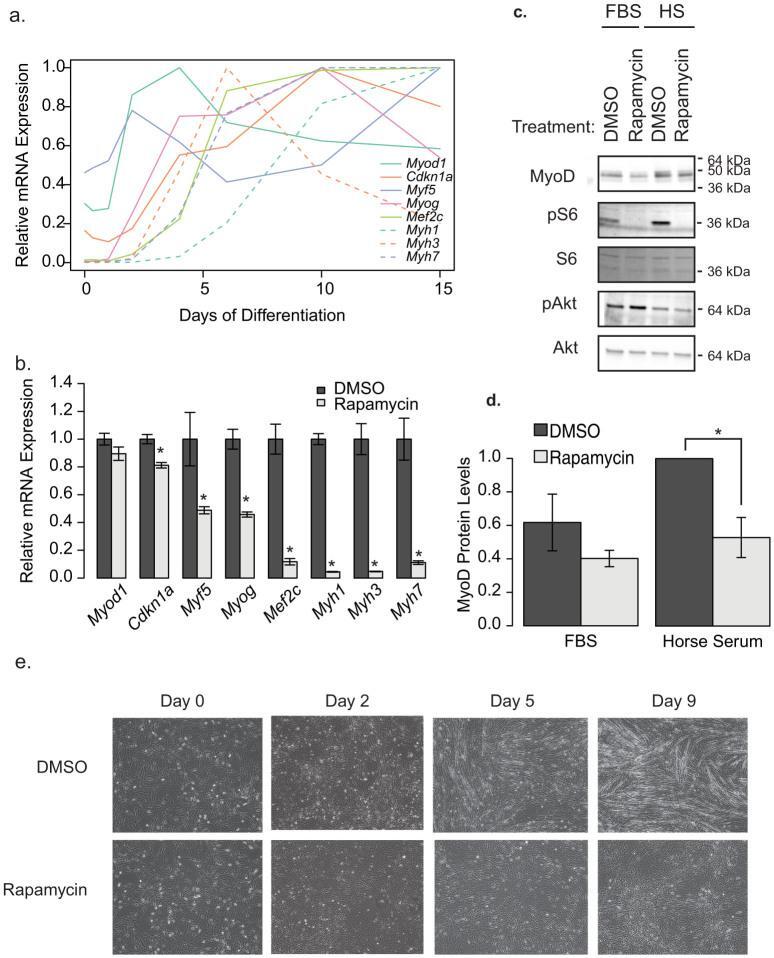
- Figure 1 Rapamycin blocks C2C12 differentiation. (a) The order of appearance of myotube differentiation markers over the course of 15 days in differentiation media only. This is representative of three independent experiments. (b) Differences in differentation marker transcripts when treated with DMSO (vehicle) or 500 nM rapamycin for 9 days, throughout the differentiation protocol. The most recent rapamycin administration was 1 day prior to cell lysis. These data represent the average of three wells, from a representative experiment (n = 3). Transcripts from both (a) and (b) were measured by qRT-PCR and normalized to Gapdh . (c) Representative western blot analysis of C2C12 cells treated for 4 h with Differentiation Media (2% Horse Serum; HS) or left in growth media (10% FBS) in the presence of 500 nM Rapamycin or DMSO. (d) Quantification of the blots in c (n = 4 independent experiments). Protein phosphorylation is presented as the intensity of the phosphospecific antibody band relative to that proteins total protein band. (e) Images of morphological changes in C2C12 myoblasts in response to 10 days of DMSO or rapamycin treatment througout the differentiation protocol (500 nM). Asterisks indicate p < 0.05. Data represents mean +/- standard error of the mean.
- Submitted by
- Invitrogen Antibodies (provider)
- Main image

- Experimental details
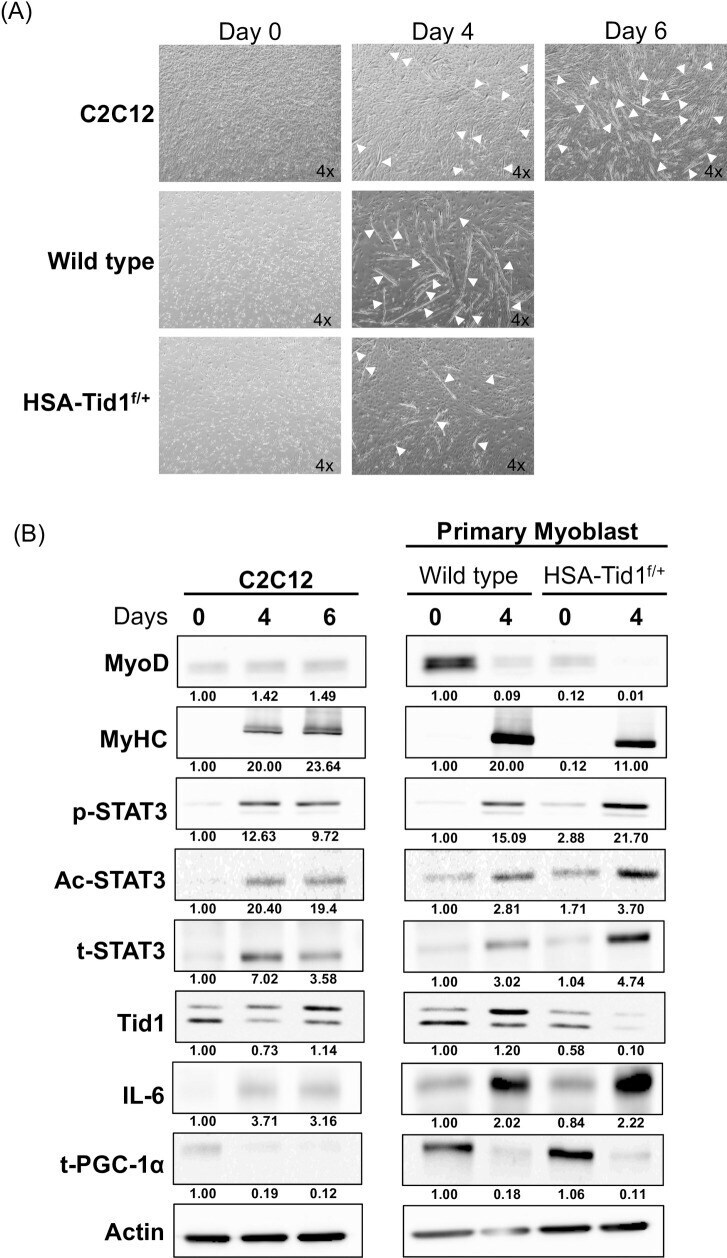
- 10.1371/journal.pone.0244791.g001 Fig 1 Differentiation of C2C12 and primary myoblast. (A) The representative phase contrast images of C2C12 cells and primary myoblasts under induced differentiation at different time intervals (Day 0, 4 and 6). White arrows indicating the myotube formation. (B) Immunoblot analyses showing the expression profile of myogenesis and mitochondrial biogenesis markers of C2C12 and primary myoblasts under induced differentiation (p-STAT3, phosphorylated STAT3; Ac, acetylated STAT3 and t-STAT3, total STAT3).
- Submitted by
- Invitrogen Antibodies (provider)
- Main image
- Experimental details
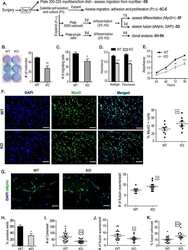
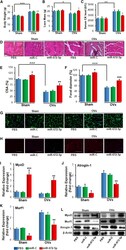
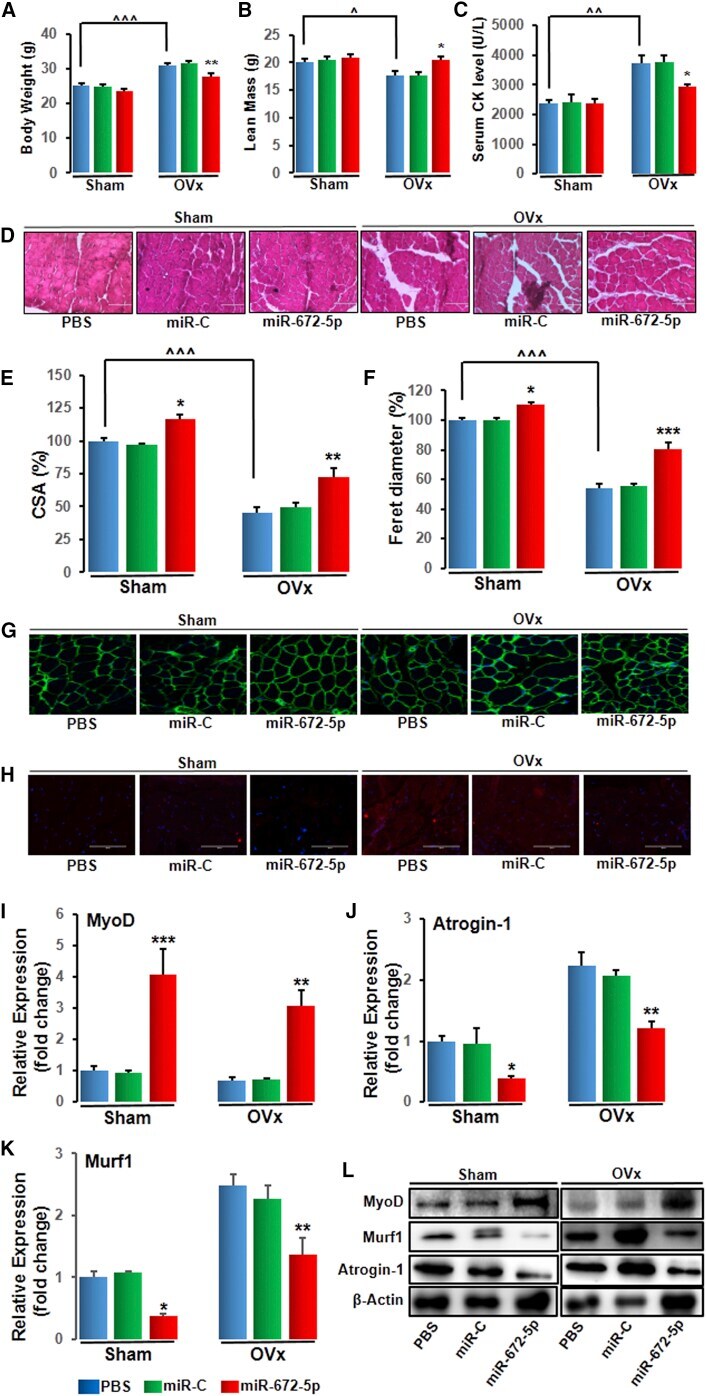
- Figure 5 miR-672-5p Treatment Mitigates Ovariectomy-Induced Sarcopenia (A) Body weight, (B) lean mass, and (C) serum CK levels. Data are mean +- SE. *p < 0.05 and **p < 0.01 compared with the PBS-treated group, or as shown ^ p < 0.05, ^^ p < 0.01, and ^^^ p < 0.001 (n >= 6 mice per group). (D) Representative photomicrographs of H&E-stained sections of gastrocnemius muscle from the indicated groups (n = 3, magnification 40x). (E) Cross-sectional area (CSA) and (F) Feret's diameter. Data are mean +- SE. *p < 0.05, **p < 0.01, and ***p < 0.001 compared with the PBS-treated group, or as shown ^^^ p < 0.001. (G and H) Immunostaining for laminin (G) and immunostaining for Atrogin-1 (H) (n = 3, magnification 40x). mRNA expression (qPCR, in triplicate) of MyoD (I), Atrogin-1 (J), and MuRF-1 (K) and protein expression (L) (western blotting) of muscle differentiation marker; MyoD (MA1-41017-Thermo Scientific; 1:1,000), catabolic markers, atrogin-1 (ab74023-Abcam; 1:1,000), and muscle ring-finger protein-1 (MuRF-1, ab183094-Abcam; 1:1,000) from gastrocnemius muscles of indicated groups. beta-actin (sc-47778 Santa Cruz Biotechnology; 1:500) was taken as a loading control. Secondary antibodies (either anti-rabbit or anti-mouse; 1:10,000) were HRP conjugated (Sigma-Aldrich). Data are mean +- SE. *p < 0.05, **p < 0.01, and ***p < 0.001 compared with the PBS-treated group.
- Submitted by
- Invitrogen Antibodies (provider)
- Main image

- Experimental details
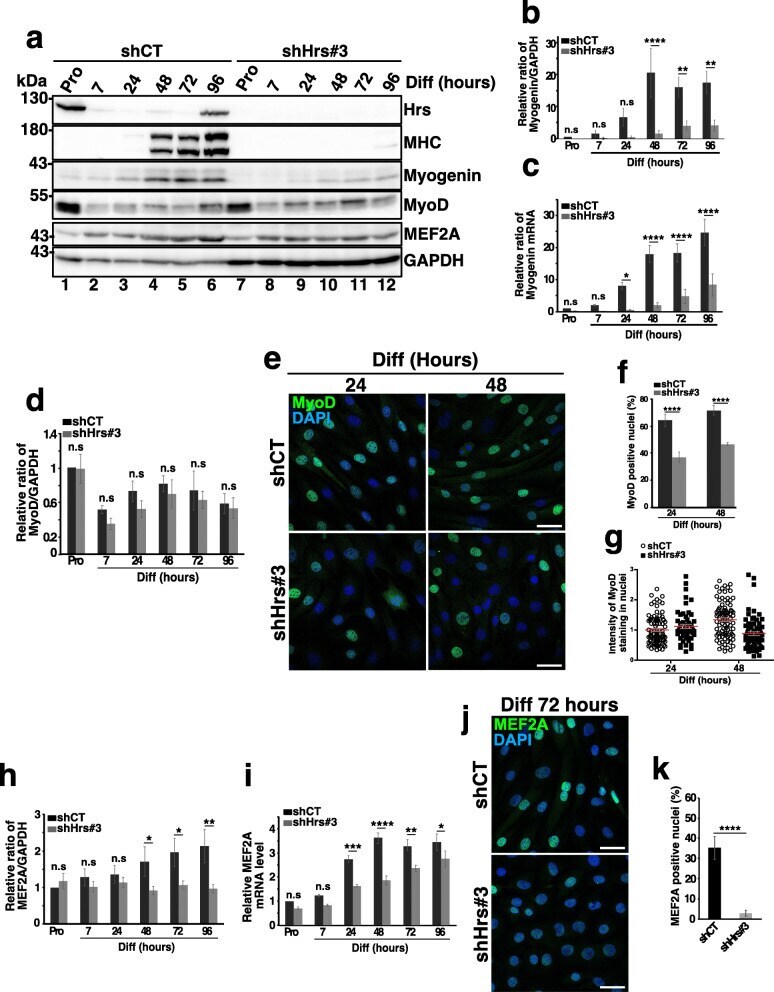
- Fig. 4 Depletion of Hrs affects the expression and localization of the myogenic regulator factors. a Representative Western blotting of shCT and shHrs#3 C2C12 extracts in Pro status (lanes 1 and 7) and at 7, 24, 48, 72, and 96 h of differentiation (lanes 2-6 and 8-12). Membranes were probed with the anti-HRS, -MHC, -Myogenin, -MyoD, and -MEF2A antibodies. GAPDH was used as a loading control. b Quantifications of the myogenin protein level present in experiments like in a . Data are presented as the ratio of myogenin/GAPDH and normalized to the Pro starting point condition. Data represent mean +/- SEM, n = 4 experiments. Significance was assessed using a two-way ANOVA test; ** p < 0.01, **** p < 0.0001. ns not significant. c qRT-PCR of myogenin mRNA realized on mRNAs from shCT and shHrs#3 C2C12 cells collected in Pro and at 7, 24, 48, 72, and 96 h of differentiation. Data are normalized to the Pro starting point condition and presented as mean +/- SEM, n = 4 experiments. Significance was assessed using a two-way ANOVA test; * p < 0.05, **** p < 0.0001. ns not significant. d Quantification of the MyoD protein level present in experiments like in a . Data are presented as the ratio of MyoD/GAPDH signals and normalized to the Pro starting point condition. Data represent mean +/- SEM, n = 5 experiments. Significance was assessed using a two-way ANOVA test. ns not significant. e Representative immunofluorescence images of MyoD in shCT and shHrs#3 C2C12 cells at 24 or 48 h of differ
- Submitted by
- Invitrogen Antibodies (provider)
- Main image
- Experimental details
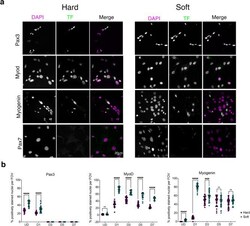
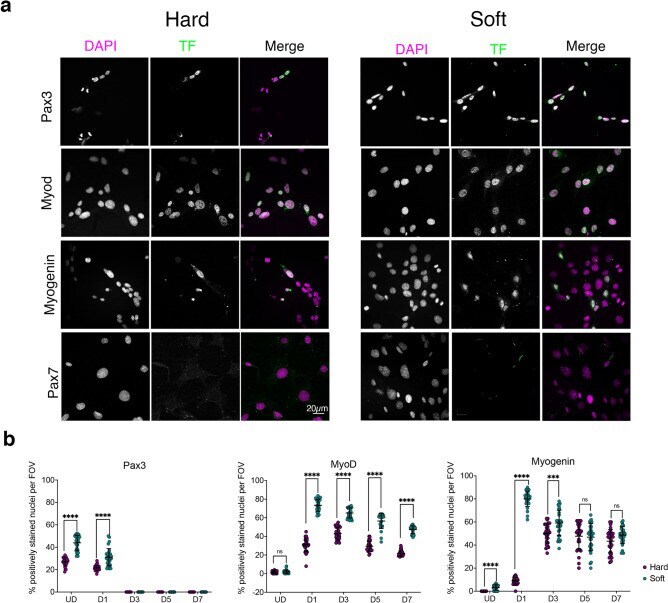
- Figure 4 Immunostaining for myogenic factors in C1F cells cultured on hard or soft surfaces. ( a ) Example images of cells stained for DAPI and specific transcription factor, shown in greyscale for each channel, and as magenta and green respectively in the merged image. ( b ) Quantification of the number of nuclei staining positively for each transcription factor (Pax3, MyoD and myogenin) over time on hard (magenta) and soft (green) surfaces. ****p < 0.0001, ***p < 0.001. ns non-significant.
- Submitted by
- Invitrogen Antibodies (provider)
- Main image
- Experimental details
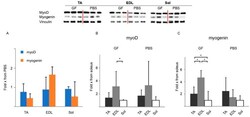
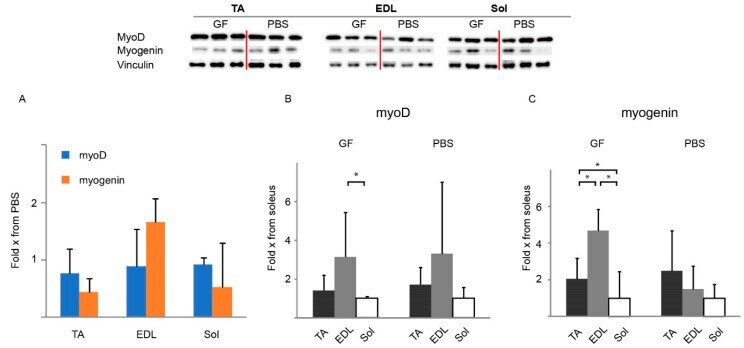
- Figure 6 Western blotting of myogenic transcription factors in relation to PBS or soleus in adolescent (8W) mdx treated for 12 weeks at the conclusion of treatment. Representative bands are shown (all bands can be seen in Supplementary Materials Figure S3 ). ( A ) Levels of myoD and myogenin in EDL, TA, and soleus in response to GF treatment relative to PBS. ( B , C ) Levels of myoD (B) and myogenin (C) in various muscles relative to soleus. A: N = 6 for all groups. B and C: N = 6 for all groups except EDL of PBS group ( n = 5). EDL, m. extensor digitorum longus; GF, growth factor; PBS, phosphate-buffered saline; Sol, m. soleus; TA, m. tibialis anterior. Data presented as bars with the respective mean and SD as vertical bar. Two-way ANOVAs were performed with subsequent Tukey HSD post-hoc tests to assess significance. Horizontal bars indicate significance: *: p < 0.05.
- Submitted by
- Invitrogen Antibodies (provider)
- Main image
- Experimental details
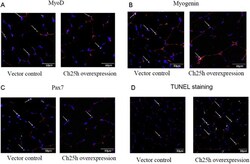
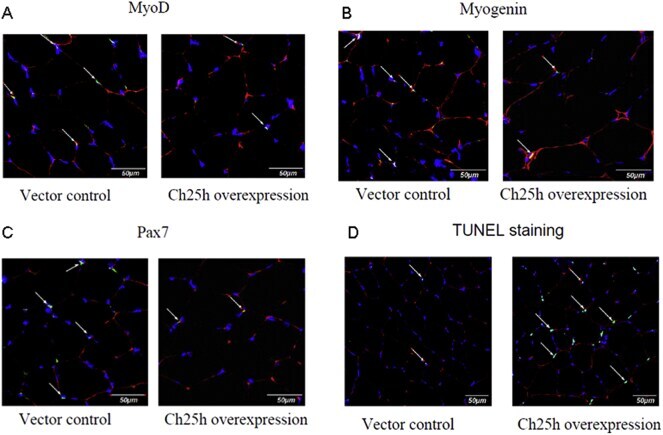
- Fig. 13 Ch25 overexpression in TA muscle inhibits the expression of myogenic markers and induces apoptosis. (A-C) Cryosections of TA muscles injected with lentivirus overexpressing 25-hydroxylase gene or lenti virus carrying empty vector were immunostained with MyoD, myogenin or Pax7, and laminin antibodies, and nuclei were stained with DAPI. (D) TUNEL staining in cryosections of TA muscles injected with lentivirus that overexpress 25-hydroxylase gene or lenti virus carrying empty vector. Fig. 13
- Submitted by
- Invitrogen Antibodies (provider)
- Main image
- Experimental details
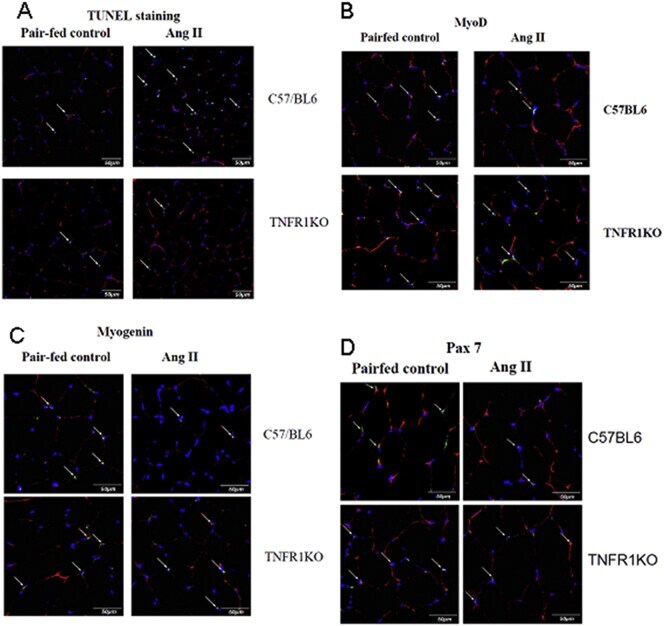
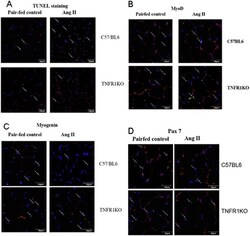
- Fig. 5 Ang II infusion leads to increased apoptosis and inhibition of myogenic differentiation in C57BL/6 but not in TNFR1KO mice. (A) TUNEL staining in cryosections of gastrocnemius muscles from ang II infused or pair-fed sham infused C57BL/6 or TNFR1KO mice. (B-D) MyoD, myogenin and Pax 7 staining in cryosections of gastrocnemius muscles from ang II infused or pair-fed sham infused C57BL/6 or TNFR1KO mice. The sections were immunostained with laminin and MyoD, myogenin or Pax7 antibodies, and nuclei were stained with DAPI. The pictures show MyoD, myogenin and Pax7 positive cells (green, indicated by white arrows) and basement membrane outlined by laminin staining (red). Fig. 5