Explore
 Validate
 Learn
Learn Western blot
 Immunocytochemistry
Antibody data
- Antibody Data
- Antigen structure
- References [3]
- Comments [0]
- Validations
- Immunocytochemistry [2]
- Immunohistochemistry [2]
- Other assay [3]
Submit
Validation data
Reference
Comment
Report error
- Product number
- MA1-41163 - Provider product page

- Provider
- Invitrogen Antibodies
- Product name
- pro-Caspase 3 Monoclonal Antibody (31A893)
- Antibody type
- Monoclonal
- Antigen
- Recombinant full-length protein
- Description
- Suggested positive control: HL-60 or staurosporine treated apoptotic HeLa.
- Reactivity
- Human
- Host
- Mouse
- Isotype
- IgG
- Antibody clone number
- 31A893
- Vial size
- 100 μg
- Concentration
- 1.0 mg/mL
- Storage
- Store at 4°C short term. For long term storage, store at -20°C, avoiding freeze/thaw cycles.
Submitted references A tissue-bioengineering strategy for modeling rare human kidney diseases in vivo.
miR‑18a‑5p promotes melanoma cell proliferation and inhibits apoptosis and autophagy by targeting EPHA7 signaling.
Caspase-3 Is a Pivotal Regulator of Microvascular Rarefaction and Renal Fibrosis after Ischemia-Reperfusion Injury.
Hernandez JOR, Wang X, Vazquez-Segoviano M, Lopez-Marfil M, Sobral-Reyes MF, Moran-Horowich A, Sundberg M, Lopez-Cantu DO, Probst CK, Ruiz-Esparza GU, Giannikou K, Abdi R, Henske EP, Kwiatkowski DJ, Sahin M, Lemos DR
Nature communications 2021 Nov 11;12(1):6496
Nature communications 2021 Nov 11;12(1):6496
miR‑18a‑5p promotes melanoma cell proliferation and inhibits apoptosis and autophagy by targeting EPHA7 signaling.
Guo Y, Shi W, Fang R
Molecular medicine reports 2021 Jan;23(1)
Molecular medicine reports 2021 Jan;23(1)
Caspase-3 Is a Pivotal Regulator of Microvascular Rarefaction and Renal Fibrosis after Ischemia-Reperfusion Injury.
Yang B, Lan S, Dieudé M, Sabo-Vatasescu JP, Karakeussian-Rimbaud A, Turgeon J, Qi S, Gunaratnam L, Patey N, Hébert MJ
Journal of the American Society of Nephrology : JASN 2018 Jul;29(7):1900-1916
Journal of the American Society of Nephrology : JASN 2018 Jul;29(7):1900-1916
No comments: Submit comment
Supportive validation
- Submitted by
- Invitrogen Antibodies (provider)
- Main image
- Experimental details
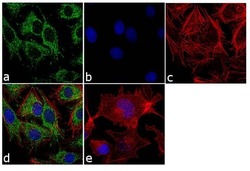
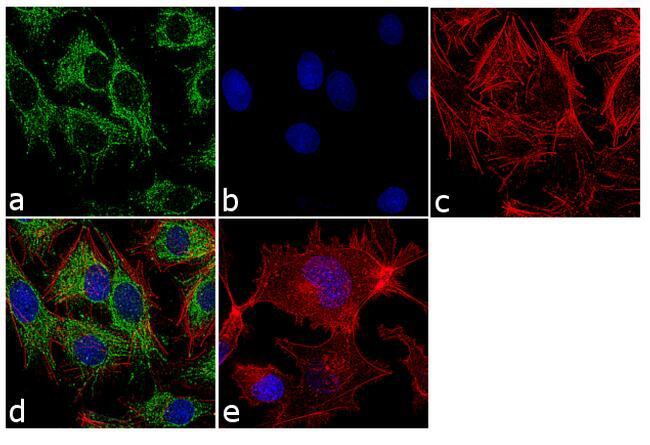
- Immunofluorescence analysis of pro-Caspase 3 Monoclonal Antibody was performed using 70% confluent log phase HepG2 cells. The cells were fixed with 4% paraformaldehyde for 10 minutes, permeabilized with 0.1% Triton X-100 for 10 minutes, and blocked with 1% BSA for 1 hour at room temperature. The cells were labeled with pro-Caspase 3 (31A893) Mouse Monoclonal Antibody (Product # MA1-41163) at 2 µg/mL in 0.1% BSA, incubated for 3 hours at room temperature and then labeled with Goat anti-Mouse IgG (H+L) Superclonal Secondary Antibody, Alexa Fluor® 488 conjugate (Product # A28175) at a dilution of 1:2000 for 45 minutes at room temperature (Panel a: green). Nuclei (Panel b: blue) were stained with SlowFade® Gold Antifade Mountant with DAPI (Product # S36938). F-actin (Panel c: red) was stained with Alexa Fluor® 555 Rhodamine Phalloidin (Product # R415, 1:300). Panel d represents the merged image showing cytoplasmic localization. Panel e shows the no primary antibody control. The images were captured at 60X magnification.

- Submitted by
- Invitrogen Antibodies (provider)
- Main image

- Experimental details
- Immunofluorescence analysis of pro-Caspase 3 Monoclonal Antibody was performed using 70% confluent log phase HepG2 cells. The cells were fixed with 4% paraformaldehyde for 10 minutes, permeabilized with 0.1% Triton X-100 for 10 minutes, and blocked with 1% BSA for 1 hour at room temperature. The cells were labeled with pro-Caspase 3 (31A893) Mouse Monoclonal Antibody (Product # MA1-41163) at 2 µg/mL in 0.1% BSA, incubated for 3 hours at room temperature and then labeled with Goat anti-Mouse IgG (H+L) Superclonal Secondary Antibody, Alexa Fluor® 488 conjugate (Product # A28175) at a dilution of 1:2000 for 45 minutes at room temperature (Panel a: green). Nuclei (Panel b: blue) were stained with SlowFade® Gold Antifade Mountant with DAPI (Product # S36938). F-actin (Panel c: red) was stained with Alexa Fluor® 555 Rhodamine Phalloidin (Product # R415, 1:300). Panel d represents the merged image showing cytoplasmic localization. Panel e shows the no primary antibody control. The images were captured at 60X magnification.
Supportive validation
- Submitted by
- Invitrogen Antibodies (provider)
- Main image
- Experimental details
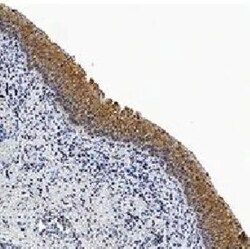
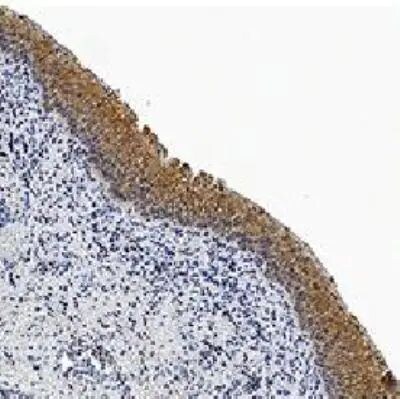
- Immunohistochemical analysis of pro-Caspase 3 in immersion fixed paraffin-embedded sections of human bladder tissue. Samples were incubated in pro-Caspase 3 monoclonal antibody (Product # MA1-41163) using a dilution of 5 µg/mL for 1 hour at room temperature followed by the anti-mouse IgG VisUCyte HRP polymer. Tissue was stained using DAB (brown) and counterstained with hematoxylin (blue).
- Submitted by
- Invitrogen Antibodies (provider)
- Main image

- Experimental details
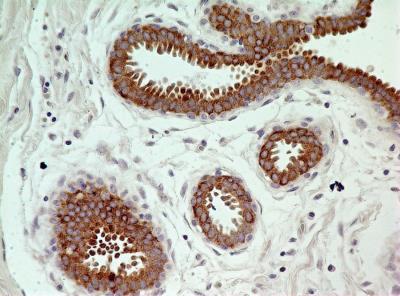
- Immunohistochemical analysis of pro-Caspase 3 in Tissue section of normal human breast. Samples were incubated in pro-Caspase 3 monoclonal antibody (Product # MA1-41163) using a dilution of 5 µg/mL. Very strong diffused as well as granular immunopositivity of Caspase 3 was observed specifically in the cytoplasmic of ductal /acinar epithelial cells.
Supportive validation
- Submitted by
- Invitrogen Antibodies (provider)
- Main image
- Experimental details
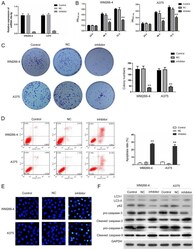
- Figure 2. miR-18a-5p knockdown suppresses proliferation and promotes apoptosis and autophagy in melanoma cells. (A) miR-18a-5p expression in WM266-4 and A375 cells with specific inhibitors. miR-18a-5p expression was evaluated by RT-qPCR 36 h following transfection. (B and C) Decreased proliferation rates in WM266-4 and A375 cells following miR-18a-5p knockdown. Cell proliferation rates were detected by (B) Cell Counting Kit-8 and (C) colony formation assays. (D and E) Enhanced apoptosis in WM266-4 and A375 cells transfected with miR-18a-5p inhibitors. Cell apoptosis was analyzed by (D) flow cytometry and (E) Hoechst staining (magnification, x400). (F) Altered levels of apoptosis and autophagy marker proteins in WM266-4 and A375 cells following miR-18a-5p knockdown. Protein expression was measured by western blotting. GAPDH was used as the internal standard. **P

- Submitted by
- Invitrogen Antibodies (provider)
- Main image
- Experimental details
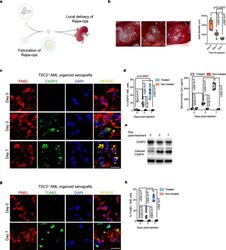
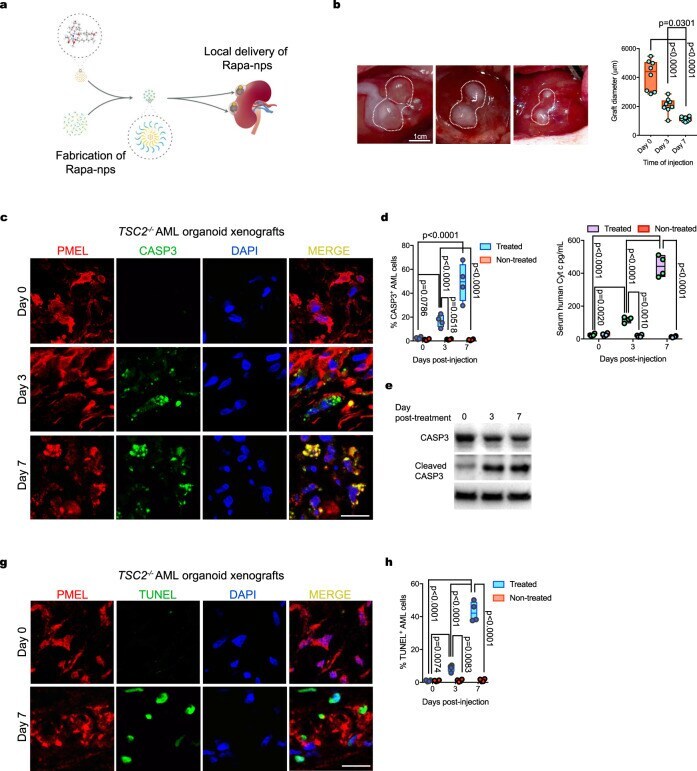
- Ablation of TSC2 -/- AML organoid xenografts treated with Rapamycin-loaded nanoparticles. a Schematic showing the strategy for the delivery of Rapa-nanoparticles locally, near the TSC2 -/- AML organoid xenografts. b Representative photographs showing the size of TSC2 -/- xenografts on Day 3 and Day 7 post Rapa-Np delivery. Quantified diameter values on the floating bar graph represent mean +- SD, n = 8 grafts. P values for individual comparisons done using Tukey test in one-way ANOVA analysis are indicated. c Representative immunofluorescence images for the detection of activated Casp3 in TSC2 -/- AML organoid xenograft PMEL + myoid cells on Day 3 and Day 7 postdrug delivery. Five independent experiments were performed with similar results. d Floating bar graph with quantification of PMEL + Casp3 + cells on Days 3 and 7 postdrug delivery. Mean +- SD are reported, n = 4 grafts. P values determined by two-way ANOVA analysis using Tukey test for multiple comparisons are indicated. e Detection of cleaved Casp3 on Day 0 (free organoid), 3 and 7 in protein extracts from TSC2 -/- AML xenografts (Day 3 and 7). f Quantification of human Cytochrome C in the serum of RNU carrying rats TSC2 -/- AML organoid xenografts, treated with Rapa-Np and controls that did not receive the treatment. Floating bar graph shows mean +- SD, n = 4 rats per group. P values determined by two-way ANOVA analysis using Tukey test for multiple comparisons are indicated. g Representative confocal imaging depicti
- Submitted by
- Invitrogen Antibodies (provider)
- Main image
- Experimental details
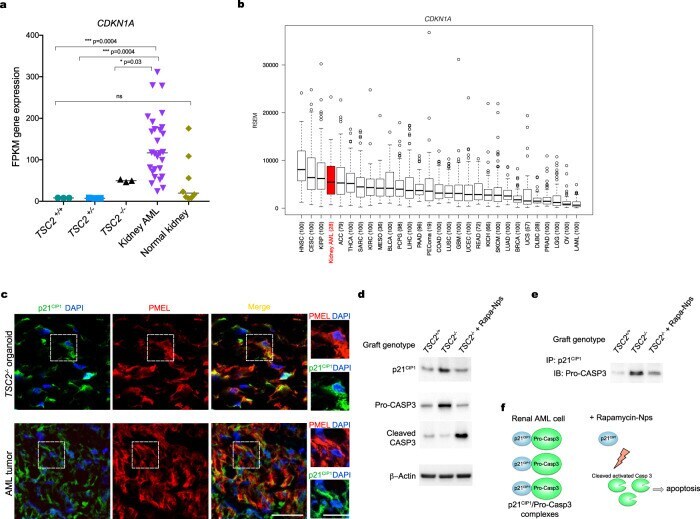
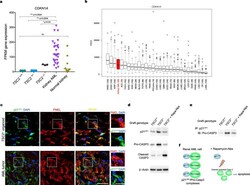
- Fig. 7 Rapamycin-Nps disrupt the interaction between p21 CIP1 and pro-CASP3 in TSC2 -/- organoid AML cells in vivo. a RNAseq data box plots showing expression levels of CDKN1A in TSC2 -/- , TSC2 +/- and TSC2 +/+ renal organoids ( n = 3 each, five organoids per ample), compared to human kidney AML ( n = 28) and human kidney ( n = 8) samples. P values for individual comparisons done using a two-sided Mann-Whitney U test are indicated. Gene expression is shown in FPKM values. b Box-and-whisker plot showing minimum value, first quartile, median, third quartile and maximum value for expression of CDKN1A in various tumors using The Cancer Genome Atlas data. Kidney AML is highlighted in red. Sample size for each type of tumor: HNSC n = 100, CESC n = 100, KIRP n = 100, kidney AML n = 28, ACC n = 79, THCA n = 100, SARC n = 100, KIRC n = 100, MESO n = 36, BLCA n = 100, PCPG n = 98, LIHC n = 100, PAAD n = 96, PEComa (19), COAD n = 100, LUSC n = 100, GBM n = 100, UCEC n = 100, READ n = 72, KICH n = 66, SKCM n = 100, LUAD n = 100, BRCA n = 100, UCS n = 57, DLBC n = 28, PRAD n = 100, LGG n = 100, OV n = 100, LAML n = 100. c Representative immunostaining and confocal images showing PMEL and p21 CIP1 in TSC2 -/- AML organoids and in kidney AML tumor samples. High magnifications show cytoplasmic p21 CIP1 signal. Three independent experiments were performed with similar results. Scale bars, 25 mum, and 12.5 mum for high magnification panels. d Representative Western Blots showing levels of p21