Explore
 Validate
 Learn
Learn Western blot
 Other assay
Antibody data
- Antibody Data
- Antigen structure
- References [1]
- Comments [0]
- Validations
- Other assay [3]
Submit
Validation data
Reference
Comment
Report error
- Product number
- PA5-42147 - Provider product page

- Provider
- Invitrogen Antibodies
- Product name
- PAGE4 Polyclonal Antibody
- Antibody type
- Polyclonal
- Antigen
- Synthetic peptide
- Description
- Peptide sequence: PPIEERKVEG DCQEMDLEKT RSERGDGSDV KEKTPPNPKH AKTKEAGDGQ Sequence homology: Human: 100%
- Reactivity
- Human
- Host
- Rabbit
- Isotype
- IgG
- Vial size
- 100 μL
- Concentration
- 0.5 mg/mL
- Storage
- -20°C, Avoid Freeze/Thaw Cycles
Submitted references The Prostate-Associated Gene 4 (PAGE4) Could Play a Role in the Development of Benign Prostatic Hyperplasia under Oxidative Stress.
Li Y, Liu J, Liu D, Wang Z, Zhou Y, Yang S, Guo F, Yang L, Zhang X
Oxidative medicine and cellular longevity 2022;2022:7041739
Oxidative medicine and cellular longevity 2022;2022:7041739
No comments: Submit comment
Supportive validation
- Submitted by
- Invitrogen Antibodies (provider)
- Main image
- Experimental details
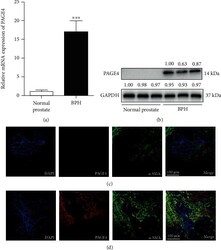
- The expression of PAGE4 in prostate. (a) qRT-PCR analysis demonstrating the expression level of PAGE4 gene in BPH tissue ( n = 10) and normal prostate tissue ( n = 10) (b) Immunoblot assay revealed the protein expression of PAGE4 in normal prostate tissues and BPH tissues. Immunolocalization of PAGE4 for (c) normal prostate tissues and (d) BPH tissues. DAPI (blue) shows nuclear staining; Cy3-immunofluorescence (red) shows PAGE4 protein; alpha -SMA (green) indicates stromal staining. Sections of all samples were used for immunofluorescence experiments, and representative graphs were selected for figures. GAPDH is used as loading control. *** : p < 0.001. Student's t -test. The scale bars are 100 mu m.

- Submitted by
- Invitrogen Antibodies (provider)
- Main image
- Experimental details
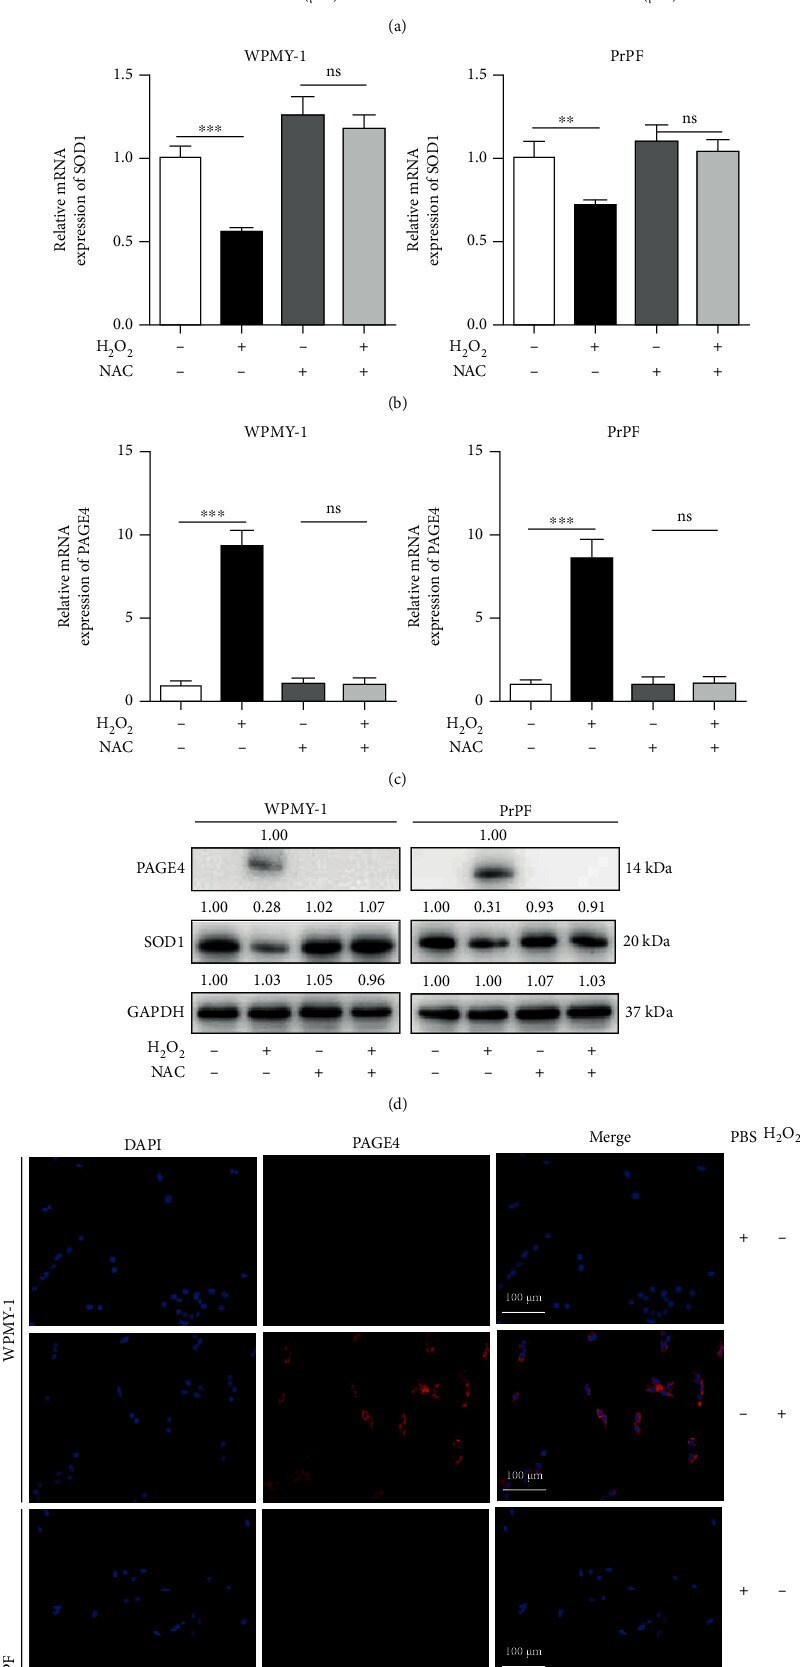
- Expression of PAGE4 when exposed to H 2 O 2 in WPMY-1 and PrPF cells. (a) The blank control group and 100, 200, 400, and 800 mu M H 2 O 2 treatment groups were set, respectively. The cell proliferation activity of WPMY-1 and PrPF cells was determined by CCK-8 assay. The IC50 value was 431.9 mu M and 409.2 mu M, respectively. The mRNA expression of (b) SOD1 and (c) PAGE4 in WPMY-1 and PrPF cells, which were treated with 400 mu M H 2 O 2 combined with or without 5 mM NAC. (d) Immunoblot assays demonstrated the protein expression of SOD1 and PAGE4 in WPMY-1 and PrPF cells, which were treated with 400 mu M H 2 O 2 combined with or without 5 mM NAC. (e) Immunofluorescence was used to detect the expression of PAGE4 in WPMY-1 cells without or with 400 mu M H 2 O 2 treatment. Left: DAPI (blue) shows nuclear staining; middle: Cy3 immunofluorescence (red) shows PAGE4 protein; right: merged image. Representative graphs were selected into figure. GAPDH is used as loading control. ns: no significant difference; ** : p < 0.01; *** : p < 0.001. ANOVA or Student's t -test. The scale bars are 100 mu m.
- Submitted by
- Invitrogen Antibodies (provider)
- Main image
- Experimental details
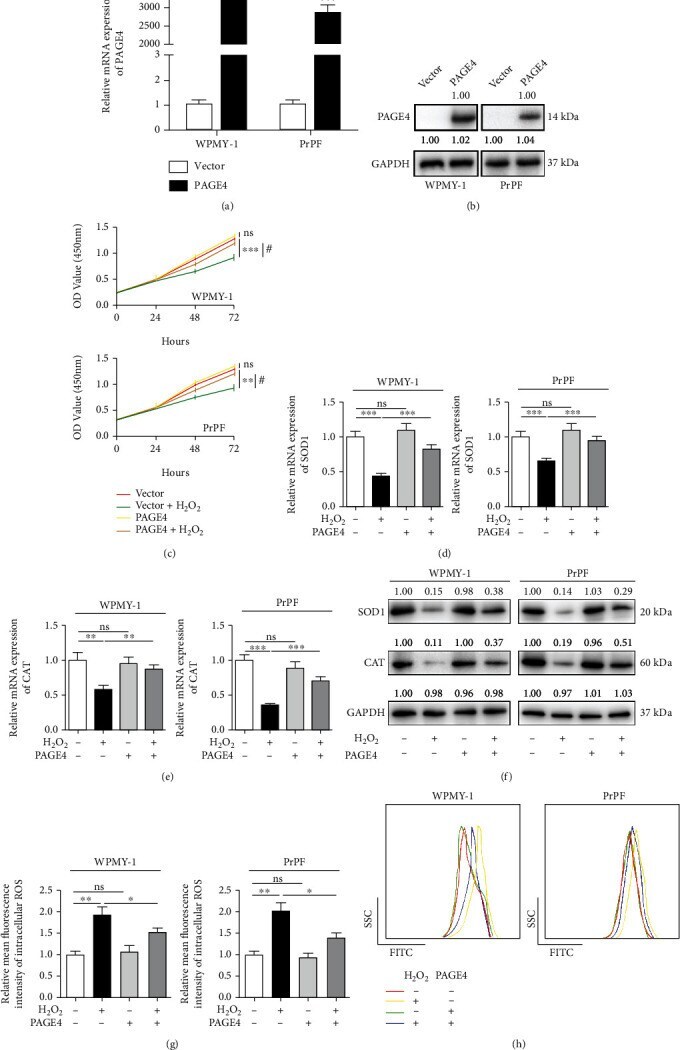
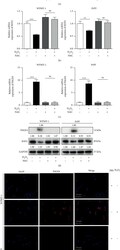
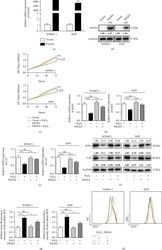
- The effect of overexpression of PAGE4 on cell proliferation and oxidative stress level of WPMY-1 and PrPF cells under OS. (a) qRT-PCR was used to verify the efficiency of PAGE4 overexpression in WPMY-1 and PrPF cells at the transcriptional level. (b) Immunoblot assays showing the efficiency of PAGE4 overexpression in WPMY-1 and PrPF cells at the protein level. (c) The cell viability of WPMY-1 (i) and PrPF (ii) after overexpression of PAGE4 with or without 400 mu M H 2 O 2 treatment at different time points by CCK-8 assay ( * : vector vs. vector + H 2 O 2 ; # : vector + H 2 O 2 vs. PAGE4 + H 2 O 2 ). qRT-PCR was used to verify the effect of PAGE4 and combined or noncombined 400 mu M H 2 O 2 on the transcription level of (d) SOD1 and (e) CAT in WPMY-1 and PrPF cells after PAGE4 overexpression. (f) Immunoblot assays showing the effects of PAGE4 overexpression with or without 400 mu M H 2 O 2 on the protein expression levels of SOD1 and CAT in WPMY-1 and PrPF cells. (g) Statistical analysis of mean fluorescence intensity (MFI) of DCFH-DA in WPMY-1 and PrPF cells after different treatments. (h) DCFH-DA fluorescent probe was used to analyze the accumulation of ROS by PAGE4 overexpression in WPMY-1 and PrPF cells under OS, and different color curves were used to represent different treatment groups. GAPDH is used as loading control. ns: no significant difference; * : p < 0.05; ** : p < 0.01; *** : p < 0.001. ANOVA or Student's t -test.