Explore
 Validate
 Learn
Learn Western blot
 Immunocytochemistry
Antibody data
- Antibody Data
- Antigen structure
- References [3]
- Comments [0]
- Validations
- Immunocytochemistry [2]
- Immunohistochemistry [1]
- Flow cytometry [1]
- Other assay [1]
Submit
Validation data
Reference
Comment
Report error
- Product number
- PA1-46159 - Provider product page

- Provider
- Invitrogen Antibodies
- Product name
- TRPA1 Polyclonal Antibody
- Antibody type
- Polyclonal
- Antigen
- Synthetic peptide
- Description
- The target sequence has 69% sequence homology with rat. Suggested positive control: human brain membrane fraction.
- Reactivity
- Human, Mouse, Rat, Guinea Pig, Zebrafish
- Host
- Rabbit
- Isotype
- IgG
- Vial size
- 100 μL
- Concentration
- 1 mg/mL
- Storage
- Store at 4°C short term. For long term storage, store at -20°C, avoiding freeze/thaw cycles.
Submitted references Interleukin 1 beta-induced calcium signaling via TRPA1 channels promotes mitogen-activated protein kinase-dependent mesangial cell proliferation.
Functional expression of the transient receptor potential ankyrin type 1 channel in pancreatic adenocarcinoma cells.
Thermo-TRPs and gut microbiota are involved in thermogenesis and energy metabolism during low temperature exposure of obese mice.
Soni H, Kumar R, Kanthakumar P, Adebiyi A
FASEB journal : official publication of the Federation of American Societies for Experimental Biology 2021 Jul;35(7):e21729
FASEB journal : official publication of the Federation of American Societies for Experimental Biology 2021 Jul;35(7):e21729
Functional expression of the transient receptor potential ankyrin type 1 channel in pancreatic adenocarcinoma cells.
Cojocaru F, Şelescu T, Domocoş D, Măruţescu L, Chiritoiu G, Chelaru NR, Dima S, Mihăilescu D, Babes A, Cucu D
Scientific reports 2021 Jan 21;11(1):2018
Scientific reports 2021 Jan 21;11(1):2018
Thermo-TRPs and gut microbiota are involved in thermogenesis and energy metabolism during low temperature exposure of obese mice.
Wen J, Bo T, Zhang X, Wang Z, Wang D
The Journal of experimental biology 2020 Jun 4;223(Pt 11)
The Journal of experimental biology 2020 Jun 4;223(Pt 11)
No comments: Submit comment
Supportive validation
- Submitted by
- Invitrogen Antibodies (provider)
- Main image

- Experimental details
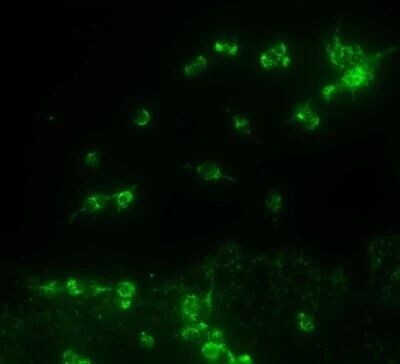
- Immunocytochemistry analysis of TRPA1 in HEK 293 cells (Flp In Trex system) cells. Samples were incubated in TRPA1 polyclonal antibody (Product # PA1-46159).
- Submitted by
- Invitrogen Antibodies (provider)
- Main image

- Experimental details
- Immunocytochemistry analysis of TRPA1 in HEK 293 cells (Flp In Trex system) cells. Samples were incubated in TRPA1 polyclonal antibody (Product # PA1-46159).

Supportive validation
- Submitted by
- Invitrogen Antibodies (provider)
- Main image
- Experimental details
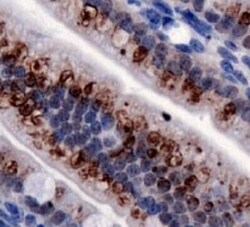
- Immunohistochemical analysis of TRPA1 in mouse intestine. Samples were incubated in TRPA1 polyclonal antibody (Product # PA1-46159).

Supportive validation
- Submitted by
- Invitrogen Antibodies (provider)
- Main image
- Experimental details
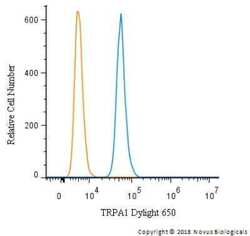
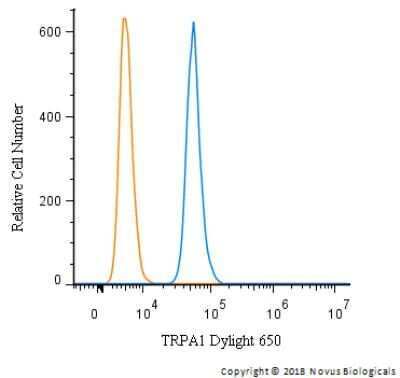
- Flow cytometry of TRPA1 in A549 cells. Samples were incubated in TRPA1 polyclonal antibody (Product # PA1-46159) using a dilution of 2.5 µg/mL for 30 minutes at room temperature. Antibody (blue) and a matched isotype control (orange). Cells were fixed with 4% PFA and then permeabilized with 0.1% saponin. Both antibodies were conjugated to DyLight 650.
Supportive validation
- Submitted by
- Invitrogen Antibodies (provider)
- Main image

- Experimental details
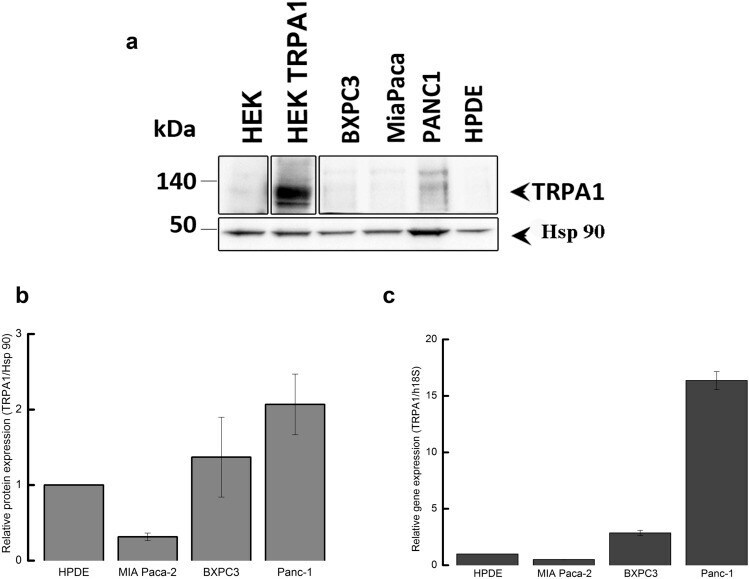
- Figure 1 Expression of TRPA1 in human PDAC cell lines. ( A ) Expression pattern of the TRPA1 protein in PDAC cell lines. Blots from whole-cell lysates (50 µg) obtained from three PDAC cell lines, the human pancreatic ductal cells, wild-type HEK293T and HEK293T/A1-transfected cell lines were probed with antibodies against TRPA1 and Hsp90 on the same gel. Cropped gel is presented here with full gel available in Supplemental Fig. 1 . ( B ) Densitometry quantification of the bands from panel A was performed with Quantity One software. The results are expressed as the ratio of the expression of TRPA1 to Hsp 90. ( C ) Levels of TRPA1 mRNA were determined by real-time RT-PCR, and a comparative Ct method (2 -DeltaDeltaCt ) was used for the relative mRNA quantification. Hu18S was used as endogenous gene. The values in ( B , C ) are shown as the means +- SD; n = 3. * p < 0.05 vs. control.