Explore
 Validate
 Learn
LearnPA5-40553
antibody from Invitrogen Antibodies
Targeting: HEY1
bHLHb31, CHF-2, CHF2, HERP2, HESR-1, HESR1, HRT-1
 Western blot
 Immunohistochemistry
Antibody data
- Antibody Data
- Antigen structure
- References [3]
- Comments [0]
- Validations
- Immunohistochemistry [2]
- Other assay [5]
Submit
Validation data
Reference
Comment
Report error
- Product number
- PA5-40553 - Provider product page

- Provider
- Invitrogen Antibodies
- Product name
- HEY1 Polyclonal Antibody
- Antibody type
- Polyclonal
- Antigen
- Synthetic peptide
- Description
- Peptide sequence: PQNGHGNAGT TASPTEPHHQ GRLGSAHPEA PALRAPPSGS FGPVLPVVTS Sequence homology: Cow: 79%; Dog: 86%; Guinea Pig: 93%; Horse: 93%; Human: 100%; Mouse: 93%; Rabbit: 79%; Rat: 93%
- Reactivity
- Human
- Host
- Rabbit
- Isotype
- IgG
- Vial size
- 100 μL
- Concentration
- 0.5 mg/mL
- Storage
- -20°C, Avoid Freeze/Thaw Cycles
Submitted references Crosstalk between Androgen-ZIP9 Signaling and Notch Pathway in Rodent Sertoli Cells.
Disruption of androgen signaling during puberty affects Notch pathway in rat seminiferous epithelium.
Human blood vessel organoids as a model of diabetic vasculopathy.
Kamińska A, Marek S, Pardyak L, Brzoskwinia M, Bilinska B, Hejmej A
International journal of molecular sciences 2020 Nov 5;21(21)
International journal of molecular sciences 2020 Nov 5;21(21)
Disruption of androgen signaling during puberty affects Notch pathway in rat seminiferous epithelium.
Kamińska A, Marek S, Pardyak L, Brzoskwinia M, Pawlicki P, Bilińska B, Hejmej A
Reproductive biology and endocrinology : RB&E 2020 Apr 16;18(1):30
Reproductive biology and endocrinology : RB&E 2020 Apr 16;18(1):30
Human blood vessel organoids as a model of diabetic vasculopathy.
Wimmer RA, Leopoldi A, Aichinger M, Wick N, Hantusch B, Novatchkova M, Taubenschmid J, Hämmerle M, Esk C, Bagley JA, Lindenhofer D, Chen G, Boehm M, Agu CA, Yang F, Fu B, Zuber J, Knoblich JA, Kerjaschki D, Penninger JM
Nature 2019 Jan;565(7740):505-510
Nature 2019 Jan;565(7740):505-510
No comments: Submit comment
Supportive validation
- Submitted by
- Invitrogen Antibodies (provider)
- Main image
- Experimental details
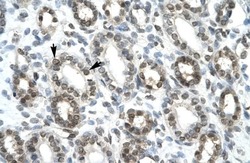
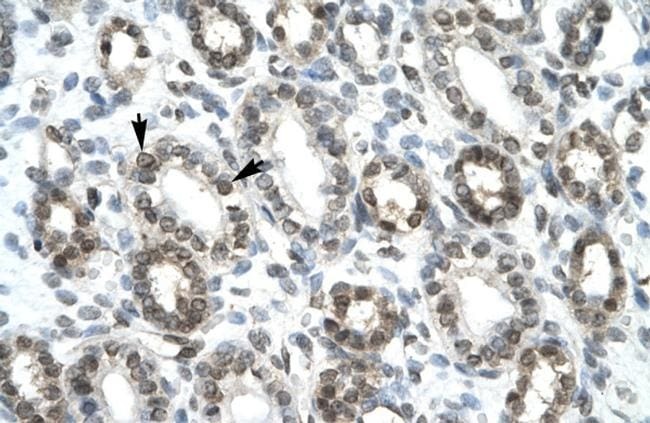
- Immunohistochemistry (paraffin-embedded) analysis of human kidney tissue using an anti-HEY1 polyclonal antibody (Product # PA5-40553).
- Submitted by
- Invitrogen Antibodies (provider)
- Main image
- Experimental details
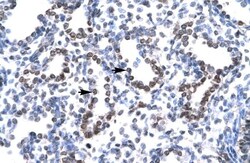
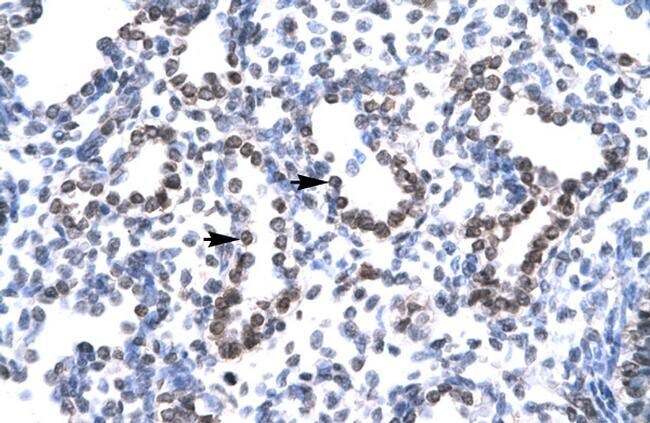
- Immunohistochemistry (paraffin-embedded) analysis of human lung tissue using an anti-HEY1 polyclonal antibody (Product # PA5-40553).
Supportive validation
- Submitted by
- Invitrogen Antibodies (provider)
- Main image
- Experimental details
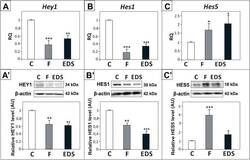
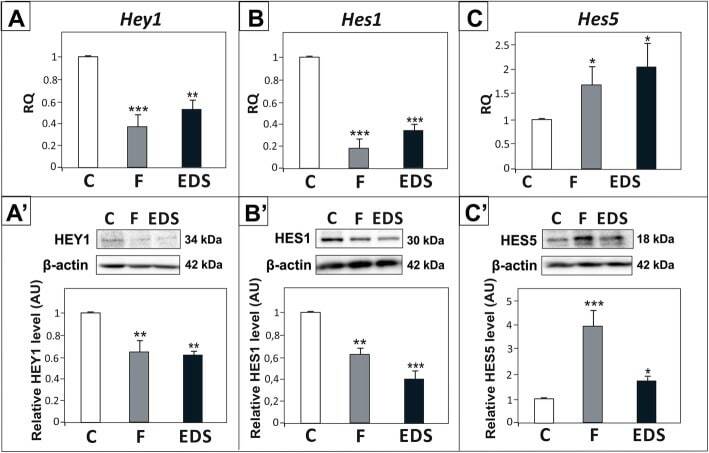
- Fig. 6 Effect of flutamide (F) and EDS on Hey1 , Hes1 , and Hes5 expression in rat testis. (A - C) Relative expression of Hey1, Hes1, and Hes5 mRNAs was determined using real-time RT-PCR analysis. The histograms are the quantitative representation of data of three independent analyses, each in triplicate ( n = 6 each group). The expression values of the individual genes were normalized to the mean expression of the reference genes ( Rn18s , B2m and Actb ) as an internal control. Relative quantification (RQ) is expressed as mean +- SD. Significant differences from control values are denoted as ** p < 0.01 and *** p < 0.001. (A'- C') Relative protein expression of HEY1, HES1 and HES5 was determined using western blot. The histograms are the quantitative representation after densitometry of data (mean +- SD) of three independent analyses ( n = 6 each group). The relative level of studied protein was normalized against its corresponding actin data point. The protein levels within the control group were arbitrarily set at 1. Significant differences from control values are denoted as * p < 0.05, ** p < 0.01, and *** p < 0.001
- Submitted by
- Invitrogen Antibodies (provider)
- Main image
- Experimental details
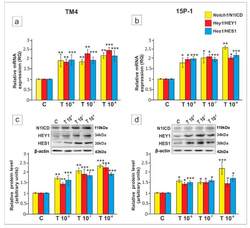
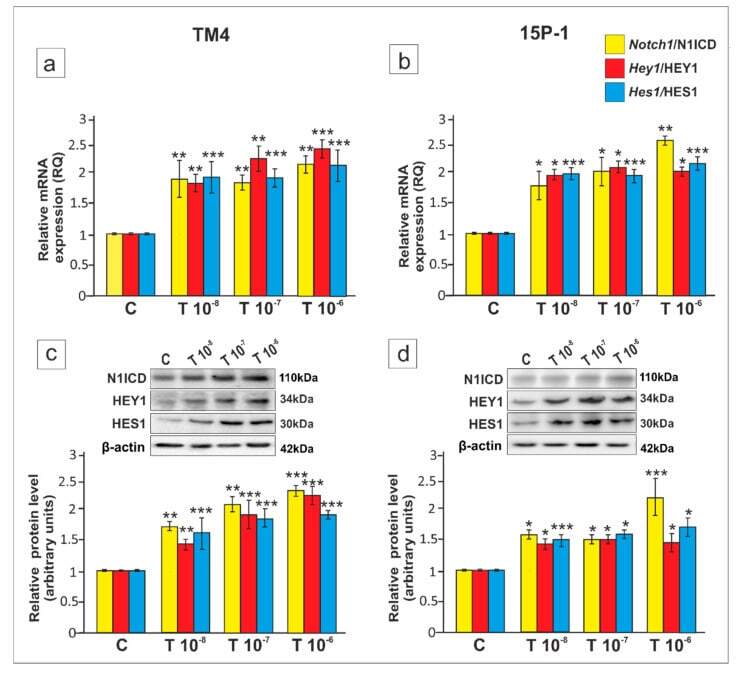
- Figure 1 The effect of testosterone on Notch1 , Hey1 and Hes1 mRNA, and Notch1 intracellular domain (N1ICD), HEY1 and HES1 protein expression in TM4 and 15P-1 Sertoli cell lines. Cells were treated with a vehicle (control, C), 10 -8 M, 10 -7 M or 10 -6 M testosterone (T) for 24 h ( a , b ) Relative expression of mRNAs (RQ) was determined using quantitative real-time RT-PCR analysis. The expression values of the individual genes were normalized to the mean expression of Rn18s , B2m , Gapdh and Actb . ( c , d ) Western blot detection of the proteins. The relative level of studied proteins was normalized to beta-actin. The protein levels within the control group were arbitrarily set at 1. The histograms are the quantitative representation of data (mean +- SD) of three independent experiments, each in triplicate. Significant differences from control values are denoted as * p < 0.05, ** p < 0.01, and *** p < 0.001.
- Submitted by
- Invitrogen Antibodies (provider)
- Main image
- Experimental details
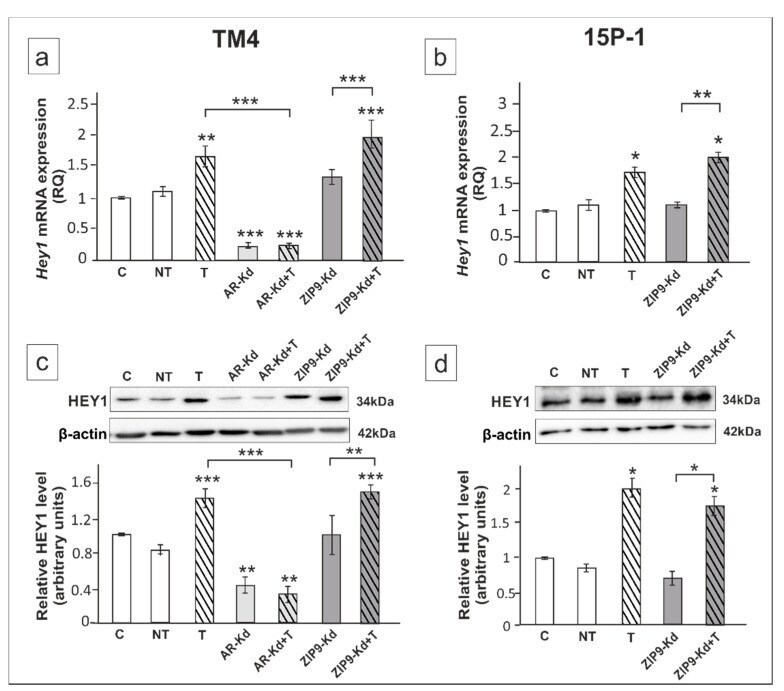
- Figure 5 The effect of AR and ZIP9 knockdown on Hey1 mRNA and HEY1 protein expression in TM4 ( a , c ) and 15P-1 ( b , d ) Sertoli cells. Cells were treated with transfection reagent alone (C), transfection reagent + 5 x 10 -8 M non-targeting siRNA (negative control, NT), transfection reagent + 5 x 10 -8 M AR siRNA (AR-Kd) or ZIP9 siRNA (ZIP9-Kd). After 24 h 10 -8 M T or vehicle was added to the culture. ( a , b ) Relative expression of mRNAs (RQ) was determined using real-time RT-PCR analysis. The expression values of the individual genes were normalized to the mean expression of Rn18s , B2m , Gapdh and Actb . ( c , d ) Western blot detection of the proteins. The relative level of studied protein was normalized to beta-actin. The protein levels within the control group were arbitrarily set at 1. The histograms are the quantitative representation of data (mean +- SD) of three independent experiments, each in triplicate. Significant differences from control values are denoted as * p < 0.05, ** p < 0.01, and *** p < 0.001.
- Submitted by
- Invitrogen Antibodies (provider)
- Main image

- Experimental details
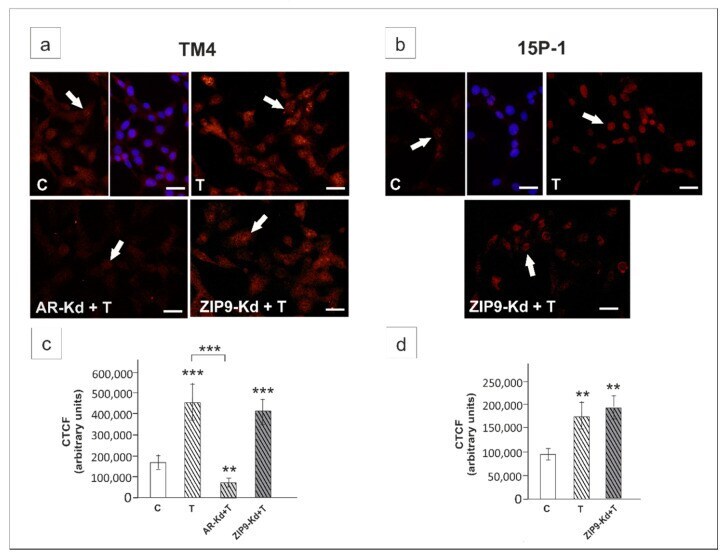
- Figure 6 Immunofluorescence analysis of HEY1 expression in TM4 ( a , c ) and 15P-1 ( b , d ) cells following AR or ZIP9 knockdown. Cells were transfected with transfection reagent alone (C), transfection reagent + 5 x 10 -8 M AR siRNA (AR-Kd) or ZIP9 siRNA (ZIP9-Kd). After 24 h 10 -8 M T or vehicle was added to the culture. Cells were fixed after a 24 h incubation. ( a , b ) Representative microphotographs of TM4 and 15P-1 cultures. Arrows indicate positive signal. Sertoli cell nuclei were stained with DAPI (blue). Right panels in controls (C) represent the merged images. Scale bar = 25 um. ( c , d ) The fluorescence intensity was quantified using ImageJ and displayed in corrected total cell fluorescence (CTCF). Histograms represent the mean +- SD. Significant differences from control values are denoted as ** p < 0.01, and *** p < 0.001.
- Submitted by
- Invitrogen Antibodies (provider)
- Main image
- Experimental details
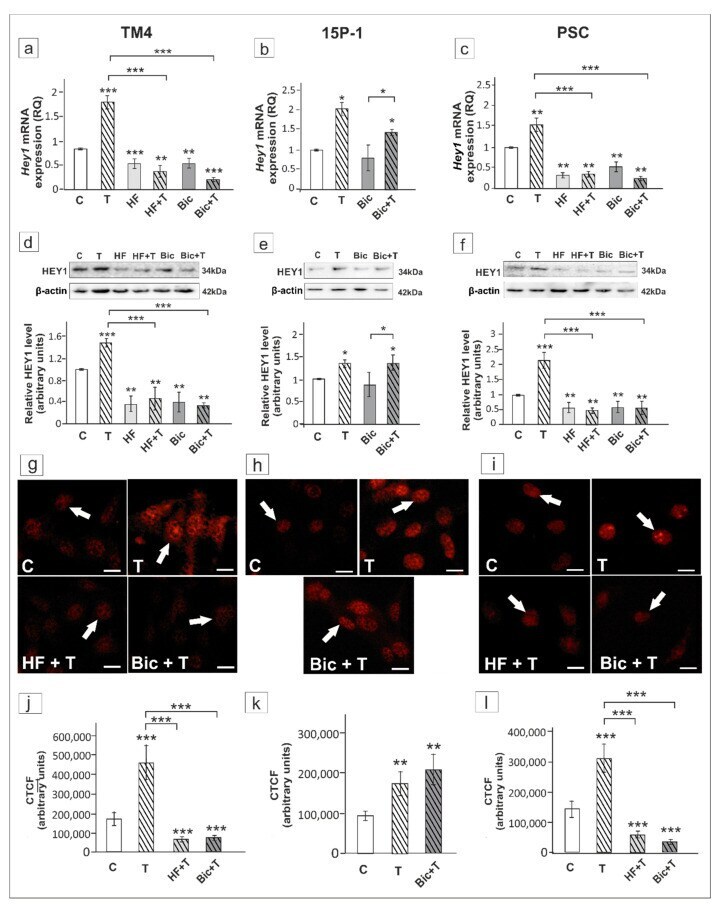
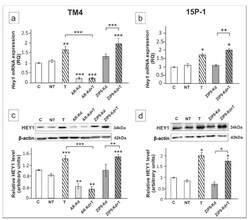
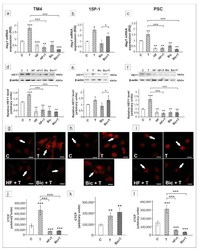
- Figure 7 The effect of hydroxyflutamide (HF) and bicalutamide (Bic) on Hey1 mRNA and HEY1 protein expression in TM4 ( a , d , g , j ), 15P-1 ( b , e , h , k ), and primary (PSC; c , f , j , l ) Sertoli cells. Cells were treated with 10 -8 M testosterone (T), 10 -4 HF, HF + T, 10 -6 M Bic, Bic + T or vehicle (C) for 24 h. ( a - c ) Relative expression of mRNAs (RQ) was determined using real-time RT-PCR analysis. The expression values of the individual genes were normalized to the mean expression of Rn18s , B2m , Gapdh and Actb . ( d - f ) Western blot detection of the proteins. The relative level of studied protein was normalized to beta-actin. The protein levels within the control group were arbitrarily set at 1. The histograms are the quantitative representation of data (mean +- SD) of three independent experiments, each in triplicate. ( g - i ) Immunofluorescence analysis of HEY1 expression. Arrows indicate positive signal. Scale bar = 10 um. ( j - l ) The fluorescence intensity was quantified using ImageJ and displayed in corrected total cell fluorescence (CTCF). Histograms represent the mean +- SD. Significant differences from control values are denoted as * p < 0.05, ** p < 0.01, and *** p < 0.001.