Explore
 Validate
 Learn
Learn Western blot
 Immunocytochemistry
Antibody data
- Antibody Data
- Antigen structure
- References [45]
- Comments [0]
- Validations
- Immunocytochemistry [2]
- Flow cytometry [2]
- Other assay [22]
Submit
Validation data
Reference
Comment
Report error
- Product number
- 459140 - Provider product page

- Provider
- Invitrogen Antibodies
- Product name
- UQCRC1 Monoclonal Antibody (16D10AD9AH5)
- Antibody type
- Monoclonal
- Antigen
- Other
- Description
- Use Human, Cow, Rat or Mouse heart mitochondrial lysate, HepG2 mitochondrial lysate. This antibody gave a positive result when used in the following methanol fixed cell lines: HCT116 for positive control.
- Reactivity
- Human, Mouse, Rat, Bovine
- Host
- Mouse
- Isotype
- IgG
- Antibody clone number
- 16D10AD9AH5
- Vial size
- 100 μg
- Concentration
- 1 mg/mL
- Storage
- 4°C, do not freeze
Submitted references PACSIN1 is indispensable for amphisome-lysosome fusion during basal autophagy and subsets of selective autophagy.
Cardiac disruption of SDHAF4-mediated mitochondrial complex II assembly promotes dilated cardiomyopathy.
Enhancement of anaerobic glycolysis - a role of PGC-1α4 in resistance exercise.
Interspecies Differences in Proteome Turnover Kinetics Are Correlated With Life Spans and Energetic Demands.
Genome-wide CRISPRi screening identifies OCIAD1 as a prohibitin client and regulatory determinant of mitochondrial Complex III assembly in human cells.
Fatal perinatal mitochondrial cardiac failure caused by recurrent de novo duplications in the ATAD3 locus.
Reperfusion mediates heme impairment with increased protein cysteine sulfonation of mitochondrial complex III in the post-ischemic heart.
Optic atrophy-associated TMEM126A is an assembly factor for the ND4-module of mitochondrial complex I.
β-adrenergic receptor signaling evokes the PKA-ASK axis in mature brown adipocytes.
Loss of MTX2 causes mandibuloacral dysplasia and links mitochondrial dysfunction to altered nuclear morphology.
A novel homozygous variant in MICOS13/QIL1 causes hepato-encephalopathy with mitochondrial DNA depletion syndrome.
Leigh Syndrome Due to NDUFV1 Mutations Initially Presenting as LBSL.
Autophagy inhibition prevents glucocorticoid-increased adiposity via suppressing BAT whitening.
GLP-1 Receptor Signaling in Astrocytes Regulates Fatty Acid Oxidation, Mitochondrial Integrity, and Function.
Herba Houttuyniae Extract Benefits Hyperlipidemic Mice via Activation of the AMPK/PGC-1α/Nrf2 Cascade.
The Mouse Heart Mitochondria N Terminome Provides Insights into ClpXP-Mediated Proteolysis.
Age-dependent loss of adipose Rubicon promotes metabolic disorders via excess autophagy.
The mitochondrial protein PGAM5 suppresses energy consumption in brown adipocytes by repressing expression of uncoupling protein 1.
Dissecting the Roles of Mitochondrial Complex I Intermediate Assembly Complex Factors in the Biogenesis of Complex I.
Effects of prolonged type 2 diabetes on mitochondrial function in cerebral blood vessels.
Mitochondrial Dysfunction Leads to Cortical Under-Connectivity and Cognitive Impairment.
L-Arabinose Elicits Gut-Derived Hydrogen Production and Ameliorates Metabolic Syndrome in C57BL/6J Mice on High-Fat-Diet.
COX6A2 variants cause a muscle-specific cytochrome c oxidase deficiency.
Stress-induced phospho-ubiquitin formation causes parkin degradation.
Mild Impairment of Mitochondrial OXPHOS Promotes Fatty Acid Utilization in POMC Neurons and Improves Glucose Homeostasis in Obesity.
APP promotes osteoblast survival and bone formation by regulating mitochondrial function and preventing oxidative stress.
CLPP deficiency protects against metabolic syndrome but hinders adaptive thermogenesis.
Defects in the mitochondrial-tRNA modification enzymes MTO1 and GTPBP3 promote different metabolic reprogramming through a HIF-PPARγ-UCP2-AMPK axis.
Impaired Mitochondrial Respiration in Large Cerebral Arteries of Rats with Type 2 Diabetes.
Selective Disruption of Respiratory Supercomplexes as a New Strategy to Suppress Her2(high) Breast Cancer.
Accessory subunits are integral for assembly and function of human mitochondrial complex I.
Control of mitochondrial function and cell growth by the atypical cadherin Fat1.
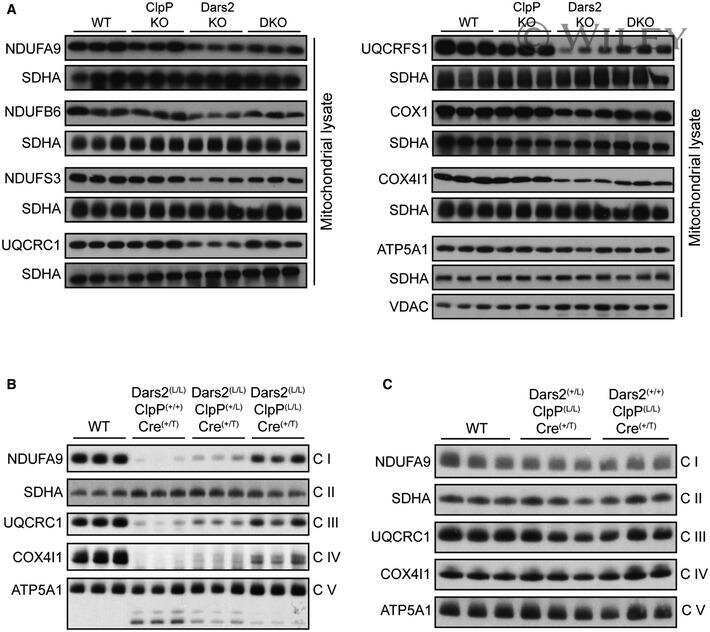
Loss of CLPP alleviates mitochondrial cardiomyopathy without affecting the mammalian UPRmt.
MicroRNA-181a suppresses parkin-mediated mitophagy and sensitizes neuroblastoma cells to mitochondrial uncoupler-induced apoptosis.
CHCHD10 mutations promote loss of mitochondrial cristae junctions with impaired mitochondrial genome maintenance and inhibition of apoptosis.
ASK1 signalling regulates brown and beige adipocyte function.
The mitochondrial function of the cerebral vasculature in insulin-resistant Zucker obese rats.
AMP-activated protein kinase controls exercise training- and AICAR-induced increases in SIRT3 and MnSOD.
Defective Expression of the Mitochondrial-tRNA Modifying Enzyme GTPBP3 Triggers AMPK-Mediated Adaptive Responses Involving Complex I Assembly Factors, Uncoupling Protein 2, and the Mitochondrial Pyruvate Carrier.
Dynamics of enhanced mitochondrial respiration in female compared with male rat cerebral arteries.
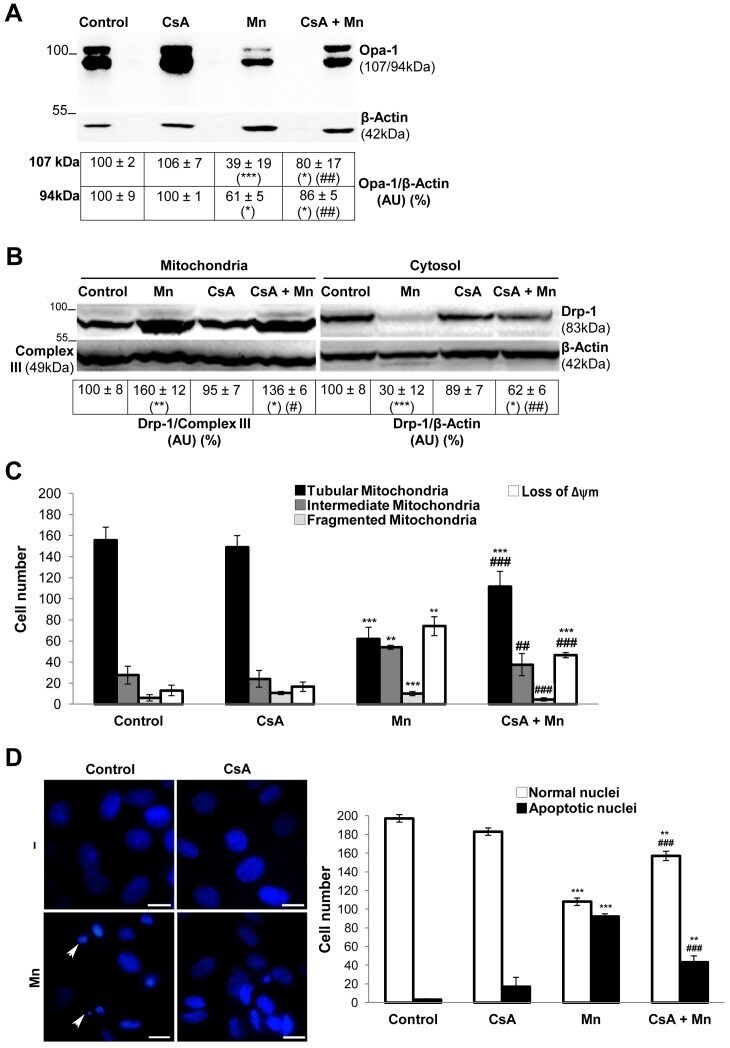
Deregulation of mitochondria-shaping proteins Opa-1 and Drp-1 in manganese-induced apoptosis.
Targeting FoxO1 with AS1842856 suppresses adipogenesis.
IKKα and alternative NF-κB regulate PGC-1β to promote oxidative muscle metabolism.
Mitochondrial DNA toxicity compromises mitochondrial dynamics and induces hippocampal antioxidant defenses.
The extrinsic and intrinsic apoptotic pathways are involved in manganese toxicity in rat astrocytoma C6 cells.
Oe Y, Kakuda K, Yoshimura SI, Hara N, Hasegawa J, Terawaki S, Kimura Y, Ikenaka K, Suetsugu S, Mochizuki H, Yoshimori T, Nakamura S
PLoS genetics 2022 Jun;18(6):e1010264
PLoS genetics 2022 Jun;18(6):e1010264
Cardiac disruption of SDHAF4-mediated mitochondrial complex II assembly promotes dilated cardiomyopathy.
Wang X, Zhang X, Cao K, Zeng M, Fu X, Zheng A, Zhang F, Gao F, Zou X, Li H, Li M, Lv W, Xu J, Long J, Zang W, Chen J, Gao F, Ding J, Liu J, Feng Z
Nature communications 2022 Jul 8;13(1):3947
Nature communications 2022 Jul 8;13(1):3947
Enhancement of anaerobic glycolysis - a role of PGC-1α4 in resistance exercise.
Koh JH, Pataky MW, Dasari S, Klaus KA, Vuckovic I, Ruegsegger GN, Kumar AP, Robinson MM, Nair KS
Nature communications 2022 Apr 28;13(1):2324
Nature communications 2022 Apr 28;13(1):2324
Interspecies Differences in Proteome Turnover Kinetics Are Correlated With Life Spans and Energetic Demands.
Swovick K, Firsanov D, Welle KA, Hryhorenko JR, Wise JP Sr, George C, Sformo TL, Seluanov A, Gorbunova V, Ghaemmaghami S
Molecular & cellular proteomics : MCP 2021;20:100041
Molecular & cellular proteomics : MCP 2021;20:100041
Genome-wide CRISPRi screening identifies OCIAD1 as a prohibitin client and regulatory determinant of mitochondrial Complex III assembly in human cells.
Le Vasseur M, Friedman J, Jost M, Xu J, Yamada J, Kampmann M, Horlbeck MA, Salemi MR, Phinney BS, Weissman JS, Nunnari J
eLife 2021 May 26;10
eLife 2021 May 26;10
Fatal perinatal mitochondrial cardiac failure caused by recurrent de novo duplications in the ATAD3 locus.
Frazier AE, Compton AG, Kishita Y, Hock DH, Welch AE, Amarasekera SSC, Rius R, Formosa LE, Imai-Okazaki A, Francis D, Wang M, Lake NJ, Tregoning S, Jabbari JS, Lucattini A, Nitta KR, Ohtake A, Murayama K, Amor DJ, McGillivray G, Wong FY, van der Knaap MS, Jeroen Vermeulen R, Wiltshire EJ, Fletcher JM, Lewis B, Baynam G, Ellaway C, Balasubramaniam S, Bhattacharya K, Freckmann ML, Arbuckle S, Rodriguez M, Taft RJ, Sadedin S, Cowley MJ, Minoche AE, Calvo SE, Mootha VK, Ryan MT, Okazaki Y, Stroud DA, Simons C, Christodoulou J, Thorburn DR
Med (New York, N.Y.) 2021 Jan 15;2(1):49-73
Med (New York, N.Y.) 2021 Jan 15;2(1):49-73
Reperfusion mediates heme impairment with increased protein cysteine sulfonation of mitochondrial complex III in the post-ischemic heart.
Chen CL, Kang PT, Zhang L, Xiao K, Zweier JL, Chilian WM, Chen YR
Journal of molecular and cellular cardiology 2021 Dec;161:23-38
Journal of molecular and cellular cardiology 2021 Dec;161:23-38
Optic atrophy-associated TMEM126A is an assembly factor for the ND4-module of mitochondrial complex I.
Formosa LE, Reljic B, Sharpe AJ, Hock DH, Muellner-Wong L, Stroud DA, Ryan MT
Proceedings of the National Academy of Sciences of the United States of America 2021 Apr 27;118(17)
Proceedings of the National Academy of Sciences of the United States of America 2021 Apr 27;118(17)
β-adrenergic receptor signaling evokes the PKA-ASK axis in mature brown adipocytes.
Hattori K, Wakatsuki H, Sakauchi C, Furutani S, Sugawara S, Hatta T, Natsume T, Ichijo H
PloS one 2020;15(10):e0232645
PloS one 2020;15(10):e0232645
Loss of MTX2 causes mandibuloacral dysplasia and links mitochondrial dysfunction to altered nuclear morphology.
Elouej S, Harhouri K, Le Mao M, Baujat G, Nampoothiri S, Kayserili H, Menabawy NA, Selim L, Paneque AL, Kubisch C, Lessel D, Rubinsztajn R, Charar C, Bartoli C, Airault C, Deleuze JF, Rötig A, Bauer P, Pereira C, Loh A, Escande-Beillard N, Muchir A, Martino L, Gruenbaum Y, Lee SH, Manivet P, Lenaers G, Reversade B, Lévy N, De Sandre-Giovannoli A
Nature communications 2020 Sep 11;11(1):4589
Nature communications 2020 Sep 11;11(1):4589
A novel homozygous variant in MICOS13/QIL1 causes hepato-encephalopathy with mitochondrial DNA depletion syndrome.
Kishita Y, Shimura M, Kohda M, Akita M, Imai-Okazaki A, Yatsuka Y, Nakajima Y, Ito T, Ohtake A, Murayama K, Okazaki Y
Molecular genetics & genomic medicine 2020 Oct;8(10):e1427
Molecular genetics & genomic medicine 2020 Oct;8(10):e1427
Leigh Syndrome Due to NDUFV1 Mutations Initially Presenting as LBSL.
Borna NN, Kishita Y, Sakai N, Hamada Y, Kamagata K, Kohda M, Ohtake A, Murayama K, Okazaki Y
Genes 2020 Nov 9;11(11)
Genes 2020 Nov 9;11(11)
Autophagy inhibition prevents glucocorticoid-increased adiposity via suppressing BAT whitening.
Deng J, Guo Y, Yuan F, Chen S, Yin H, Jiang X, Jiao F, Wang F, Ji H, Hu G, Ying H, Chen Y, Zhai Q, Xiao F, Guo F
Autophagy 2020 Mar;16(3):451-465
Autophagy 2020 Mar;16(3):451-465
GLP-1 Receptor Signaling in Astrocytes Regulates Fatty Acid Oxidation, Mitochondrial Integrity, and Function.
Timper K, Del Río-Martín A, Cremer AL, Bremser S, Alber J, Giavalisco P, Varela L, Heilinger C, Nolte H, Trifunovic A, Horvath TL, Kloppenburg P, Backes H, Brüning JC
Cell metabolism 2020 Jun 2;31(6):1189-1205.e13
Cell metabolism 2020 Jun 2;31(6):1189-1205.e13
Herba Houttuyniae Extract Benefits Hyperlipidemic Mice via Activation of the AMPK/PGC-1α/Nrf2 Cascade.
Cao K, Lv W, Liu X, Fan Y, Wang K, Feng Z, Liu J, Zang W, Xing L, Liu J
Nutrients 2020 Jan 7;12(1)
Nutrients 2020 Jan 7;12(1)
The Mouse Heart Mitochondria N Terminome Provides Insights into ClpXP-Mediated Proteolysis.
Hofsetz E, Demir F, Szczepanowska K, Kukat A, Kizhakkedathu JN, Trifunovic A, Huesgen PF
Molecular & cellular proteomics : MCP 2020 Aug;19(8):1330-1345
Molecular & cellular proteomics : MCP 2020 Aug;19(8):1330-1345
Age-dependent loss of adipose Rubicon promotes metabolic disorders via excess autophagy.
Yamamuro T, Kawabata T, Fukuhara A, Saita S, Nakamura S, Takeshita H, Fujiwara M, Enokidani Y, Yoshida G, Tabata K, Hamasaki M, Kuma A, Yamamoto K, Shimomura I, Yoshimori T
Nature communications 2020 Aug 18;11(1):4150
Nature communications 2020 Aug 18;11(1):4150
The mitochondrial protein PGAM5 suppresses energy consumption in brown adipocytes by repressing expression of uncoupling protein 1.
Sugawara S, Kanamaru Y, Sekine S, Maekawa L, Takahashi A, Yamamoto T, Watanabe K, Fujisawa T, Hattori K, Ichijo H
The Journal of biological chemistry 2020 Apr 24;295(17):5588-5601
The Journal of biological chemistry 2020 Apr 24;295(17):5588-5601
Dissecting the Roles of Mitochondrial Complex I Intermediate Assembly Complex Factors in the Biogenesis of Complex I.
Formosa LE, Muellner-Wong L, Reljic B, Sharpe AJ, Jackson TD, Beilharz TH, Stojanovski D, Lazarou M, Stroud DA, Ryan MT
Cell reports 2020 Apr 21;31(3):107541
Cell reports 2020 Apr 21;31(3):107541
Effects of prolonged type 2 diabetes on mitochondrial function in cerebral blood vessels.
Merdzo I, Rutkai I, Sure VNLR, Katakam PVG, Busija DW
American journal of physiology. Heart and circulatory physiology 2019 Nov 1;317(5):H1086-H1092
American journal of physiology. Heart and circulatory physiology 2019 Nov 1;317(5):H1086-H1092
Mitochondrial Dysfunction Leads to Cortical Under-Connectivity and Cognitive Impairment.
Fernandez A, Meechan DW, Karpinski BA, Paronett EM, Bryan CA, Rutz HL, Radin EA, Lubin N, Bonner ER, Popratiloff A, Rothblat LA, Maynard TM, LaMantia AS
Neuron 2019 Jun 19;102(6):1127-1142.e3
Neuron 2019 Jun 19;102(6):1127-1142.e3
L-Arabinose Elicits Gut-Derived Hydrogen Production and Ameliorates Metabolic Syndrome in C57BL/6J Mice on High-Fat-Diet.
Zhao L, Wang Y, Zhang G, Zhang T, Lou J, Liu J
Nutrients 2019 Dec 13;11(12)
Nutrients 2019 Dec 13;11(12)
COX6A2 variants cause a muscle-specific cytochrome c oxidase deficiency.
Inoue M, Uchino S, Iida A, Noguchi S, Hayashi S, Takahashi T, Fujii K, Komaki H, Takeshita E, Nonaka I, Okada Y, Yoshizawa T, Van Lommel L, Schuit F, Goto YI, Mimaki M, Nishino I
Annals of neurology 2019 Aug;86(2):193-202
Annals of neurology 2019 Aug;86(2):193-202
Stress-induced phospho-ubiquitin formation causes parkin degradation.
Kovalchuke L, Mosharov EV, Levy OA, Greene LA
Scientific reports 2019 Aug 12;9(1):11682
Scientific reports 2019 Aug 12;9(1):11682
Mild Impairment of Mitochondrial OXPHOS Promotes Fatty Acid Utilization in POMC Neurons and Improves Glucose Homeostasis in Obesity.
Timper K, Paeger L, Sánchez-Lasheras C, Varela L, Jais A, Nolte H, Vogt MC, Hausen AC, Heilinger C, Evers N, Pospisilik JA, Penninger JM, Taylor EB, Horvath TL, Kloppenburg P, Brüning JC
Cell reports 2018 Oct 9;25(2):383-397.e10
Cell reports 2018 Oct 9;25(2):383-397.e10
APP promotes osteoblast survival and bone formation by regulating mitochondrial function and preventing oxidative stress.
Pan JX, Tang F, Xiong F, Xiong L, Zeng P, Wang B, Zhao K, Guo H, Shun C, Xia WF, Mei L, Xiong WC
Cell death & disease 2018 Oct 22;9(11):1077
Cell death & disease 2018 Oct 22;9(11):1077
CLPP deficiency protects against metabolic syndrome but hinders adaptive thermogenesis.
Becker C, Kukat A, Szczepanowska K, Hermans S, Senft K, Brandscheid CP, Maiti P, Trifunovic A
EMBO reports 2018 May;19(5)
EMBO reports 2018 May;19(5)
Defects in the mitochondrial-tRNA modification enzymes MTO1 and GTPBP3 promote different metabolic reprogramming through a HIF-PPARγ-UCP2-AMPK axis.
Boutoual R, Meseguer S, Villarroya M, Martín-Hernández E, Errami M, Martín MA, Casado M, Armengod ME
Scientific reports 2018 Jan 18;8(1):1163
Scientific reports 2018 Jan 18;8(1):1163
Impaired Mitochondrial Respiration in Large Cerebral Arteries of Rats with Type 2 Diabetes.
Merdzo I, Rutkai I, Sure VN, McNulty CA, Katakam PV, Busija DW
Journal of vascular research 2017;54(1):1-12
Journal of vascular research 2017;54(1):1-12
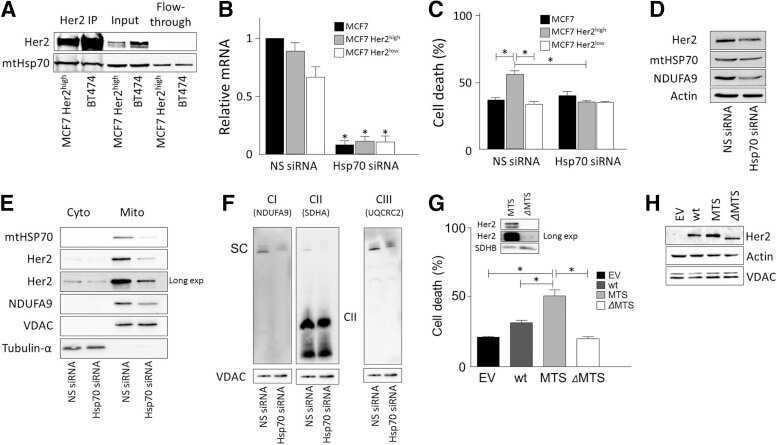
Selective Disruption of Respiratory Supercomplexes as a New Strategy to Suppress Her2(high) Breast Cancer.
Rohlenova K, Sachaphibulkij K, Stursa J, Bezawork-Geleta A, Blecha J, Endaya B, Werner L, Cerny J, Zobalova R, Goodwin J, Spacek T, Alizadeh Pesdar E, Yan B, Nguyen MN, Vondrusova M, Sobol M, Jezek P, Hozak P, Truksa J, Rohlena J, Dong LF, Neuzil J
Antioxidants & redox signaling 2017 Jan 10;26(2):84-103
Antioxidants & redox signaling 2017 Jan 10;26(2):84-103
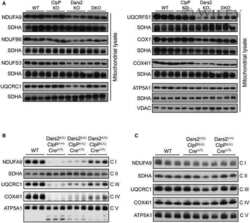
Accessory subunits are integral for assembly and function of human mitochondrial complex I.
Stroud DA, Surgenor EE, Formosa LE, Reljic B, Frazier AE, Dibley MG, Osellame LD, Stait T, Beilharz TH, Thorburn DR, Salim A, Ryan MT
Nature 2016 Oct 6;538(7623):123-126
Nature 2016 Oct 6;538(7623):123-126
Control of mitochondrial function and cell growth by the atypical cadherin Fat1.
Cao LL, Riascos-Bernal DF, Chinnasamy P, Dunaway CM, Hou R, Pujato MA, O'Rourke BP, Miskolci V, Guo L, Hodgson L, Fiser A, Sibinga NE
Nature 2016 Nov 24;539(7630):575-578
Nature 2016 Nov 24;539(7630):575-578
Loss of CLPP alleviates mitochondrial cardiomyopathy without affecting the mammalian UPRmt.
Seiferling D, Szczepanowska K, Becker C, Senft K, Hermans S, Maiti P, König T, Kukat A, Trifunovic A
EMBO reports 2016 Jul;17(7):953-64
EMBO reports 2016 Jul;17(7):953-64
MicroRNA-181a suppresses parkin-mediated mitophagy and sensitizes neuroblastoma cells to mitochondrial uncoupler-induced apoptosis.
Cheng M, Liu L, Lao Y, Liao W, Liao M, Luo X, Wu J, Xie W, Zhang Y, Xu N
Oncotarget 2016 Jul 5;7(27):42274-42287
Oncotarget 2016 Jul 5;7(27):42274-42287
CHCHD10 mutations promote loss of mitochondrial cristae junctions with impaired mitochondrial genome maintenance and inhibition of apoptosis.
Genin EC, Plutino M, Bannwarth S, Villa E, Cisneros-Barroso E, Roy M, Ortega-Vila B, Fragaki K, Lespinasse F, Pinero-Martos E, Augé G, Moore D, Burté F, Lacas-Gervais S, Kageyama Y, Itoh K, Yu-Wai-Man P, Sesaki H, Ricci JE, Vives-Bauza C, Paquis-Flucklinger V
EMBO molecular medicine 2016 Jan 1;8(1):58-72
EMBO molecular medicine 2016 Jan 1;8(1):58-72
ASK1 signalling regulates brown and beige adipocyte function.
Hattori K, Naguro I, Okabe K, Funatsu T, Furutani S, Takeda K, Ichijo H
Nature communications 2016 Apr 5;7:11158
Nature communications 2016 Apr 5;7:11158
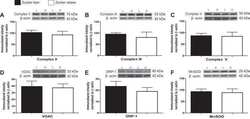
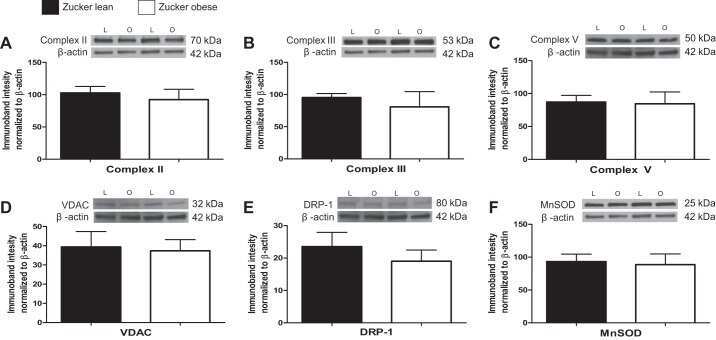
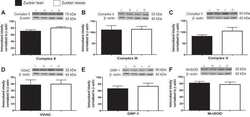
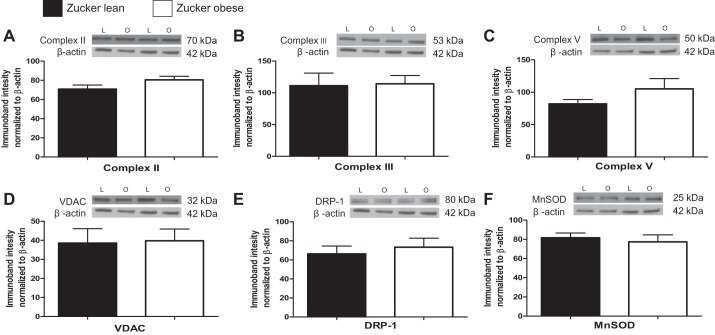
The mitochondrial function of the cerebral vasculature in insulin-resistant Zucker obese rats.
Merdzo I, Rutkai I, Tokes T, Sure VN, Katakam PV, Busija DW
American journal of physiology. Heart and circulatory physiology 2016 Apr 1;310(7):H830-8
American journal of physiology. Heart and circulatory physiology 2016 Apr 1;310(7):H830-8
AMP-activated protein kinase controls exercise training- and AICAR-induced increases in SIRT3 and MnSOD.
Brandauer J, Andersen MA, Kellezi H, Risis S, Frøsig C, Vienberg SG, Treebak JT
Frontiers in physiology 2015;6:85
Frontiers in physiology 2015;6:85
Defective Expression of the Mitochondrial-tRNA Modifying Enzyme GTPBP3 Triggers AMPK-Mediated Adaptive Responses Involving Complex I Assembly Factors, Uncoupling Protein 2, and the Mitochondrial Pyruvate Carrier.
Martínez-Zamora A, Meseguer S, Esteve JM, Villarroya M, Aguado C, Enríquez JA, Knecht E, Armengod ME
PloS one 2015;10(12):e0144273
PloS one 2015;10(12):e0144273
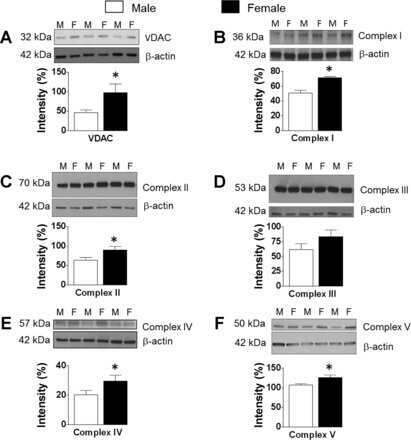
Dynamics of enhanced mitochondrial respiration in female compared with male rat cerebral arteries.
Rutkai I, Dutta S, Katakam PV, Busija DW
American journal of physiology. Heart and circulatory physiology 2015 Nov;309(9):H1490-500
American journal of physiology. Heart and circulatory physiology 2015 Nov;309(9):H1490-500
Deregulation of mitochondria-shaping proteins Opa-1 and Drp-1 in manganese-induced apoptosis.
Alaimo A, Gorojod RM, Beauquis J, Muñoz MJ, Saravia F, Kotler ML
PloS one 2014;9(3):e91848
PloS one 2014;9(3):e91848
Targeting FoxO1 with AS1842856 suppresses adipogenesis.
Zou P, Liu L, Zheng L, Liu L, Stoneman RE, Cho A, Emery A, Gilbert ER, Cheng Z
Cell cycle (Georgetown, Tex.) 2014;13(23):3759-67
Cell cycle (Georgetown, Tex.) 2014;13(23):3759-67
IKKα and alternative NF-κB regulate PGC-1β to promote oxidative muscle metabolism.
Bakkar N, Ladner K, Canan BD, Liyanarachchi S, Bal NC, Pant M, Periasamy M, Li Q, Janssen PM, Guttridge DC
The Journal of cell biology 2012 Feb 20;196(4):497-511
The Journal of cell biology 2012 Feb 20;196(4):497-511
Mitochondrial DNA toxicity compromises mitochondrial dynamics and induces hippocampal antioxidant defenses.
Lauritzen KH, Cheng C, Wiksen H, Bergersen LH, Klungland A
DNA repair 2011 Jun 10;10(6):639-53
DNA repair 2011 Jun 10;10(6):639-53
The extrinsic and intrinsic apoptotic pathways are involved in manganese toxicity in rat astrocytoma C6 cells.
Alaimo A, Gorojod RM, Kotler ML
Neurochemistry international 2011 Aug;59(2):297-308
Neurochemistry international 2011 Aug;59(2):297-308
No comments: Submit comment
Supportive validation
- Submitted by
- Invitrogen Antibodies (provider)
- Main image
- Experimental details
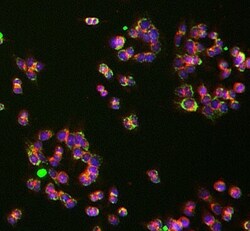
- Immunocytochemistry analysis of UQCRC1 was performed on HCT116 cells using a UQCRC1 Monoclonal Antibody (Product # 459140). The cells were 100% methanol fixed for 5 minutes at room temperature and then incubated in 1%BSA, 10% normal goat serum, 0.3M glycine in 0.1% PBS-Tween for 1 hour at room temperature to permeabilize the cells and block non-specific protein-protein interactions. The cells were then incubated with the UQCRC1 Monoclonal Antibody (1:50 dilution) overnight at 4°C. The secondary antibody (pseudo-colored green) was a Goat Anti-Mouse IgG H&L used at a 1:1000 dilution for 1 hour at room temperature. Alexa Fluor® 594 WGA was used to label plasma membranes (pseudo-colored red) at a 1:200 dilution for 1 hour at room temperature. DAPI was used to stain the cell nuclei (pseudo-colored blue) at a concentration of 1.43 µM for 1 hour at room temperature.

- Submitted by
- Invitrogen Antibodies (provider)
- Main image

- Experimental details
- Immunocytochemistry analysis of UQCRC1 was performed on HCT116 cells using a UQCRC1 Monoclonal Antibody (Product # 459140). The cells were 100% methanol fixed for 5 minutes at room temperature and then incubated in 1%BSA, 10% normal goat serum, 0.3M glycine in 0.1% PBS-Tween for 1 hour at room temperature to permeabilize the cells and block non-specific protein-protein interactions. The cells were then incubated with the UQCRC1 Monoclonal Antibody (1:50 dilution) overnight at 4°C. The secondary antibody (pseudo-colored green) was a Goat Anti-Mouse IgG H&L used at a 1:1000 dilution for 1 hour at room temperature. Alexa Fluor® 594 WGA was used to label plasma membranes (pseudo-colored red) at a 1:200 dilution for 1 hour at room temperature. DAPI was used to stain the cell nuclei (pseudo-colored blue) at a concentration of 1.43 µM for 1 hour at room temperature.

Supportive validation
- Submitted by
- Invitrogen Antibodies (provider)
- Main image

- Experimental details
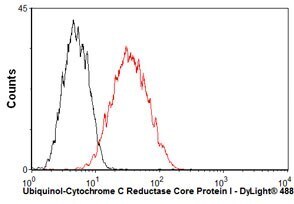
- Overlay histogram showing HepG2 cells stained with UQCRC1 Monoclonal Antibody (Product # 459140) (red line). The cells were fixed with 80% methanol (5 min) and then permeabilized with 0.1% PBS-Tween for 20 min. The cells were then incubated in 1x PBS, 10% normal goat serum, 0.3M glycine to block non-specific protein-protein interactions. The cells were then incubated with UQCRC1 Monoclonal Antibody at a dilution of 1µg/1x10^6 cells for 30 min at 22°C. The secondary antibody used was a goat anti-mouse IgG (H+L) at a 1:500 dilution for 30 min at 22°C. Isotype control antibody (black line) was mouse IgG1 (2µg/1x10^6 cells) used under the same conditions.
- Submitted by
- Invitrogen Antibodies (provider)
- Main image

- Experimental details
- Overlay histogram showing HepG2 cells stained with UQCRC1 Monoclonal Antibody (Product # 459140) (red line). The cells were fixed with 80% methanol (5 min) and then permeabilized with 0.1% PBS-Tween for 20 min. The cells were then incubated in 1x PBS, 10% normal goat serum, 0.3M glycine to block non-specific protein-protein interactions. The cells were then incubated with UQCRC1 Monoclonal Antibody at a dilution of 1µg/1x10^6 cells for 30 min at 22°C. The secondary antibody used was a goat anti-mouse IgG (H+L) at a 1:500 dilution for 30 min at 22°C. Isotype control antibody (black line) was mouse IgG1 (2µg/1x10^6 cells) used under the same conditions.

Supportive validation
- Submitted by
- Invitrogen Antibodies (provider)
- Main image
- Experimental details
- NULL
- Submitted by
- Invitrogen Antibodies (provider)
- Main image

- Experimental details
- NULL
- Submitted by
- Invitrogen Antibodies (provider)
- Main image
- Experimental details
- NULL
- Submitted by
- Invitrogen Antibodies (provider)
- Main image
- Experimental details
- NULL
- Submitted by
- Invitrogen Antibodies (provider)
- Main image
- Experimental details
- NULL

- Submitted by
- Invitrogen Antibodies (provider)
- Main image
- Experimental details
- NULL
- Submitted by
- Invitrogen Antibodies (provider)
- Main image
- Experimental details
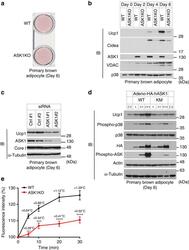
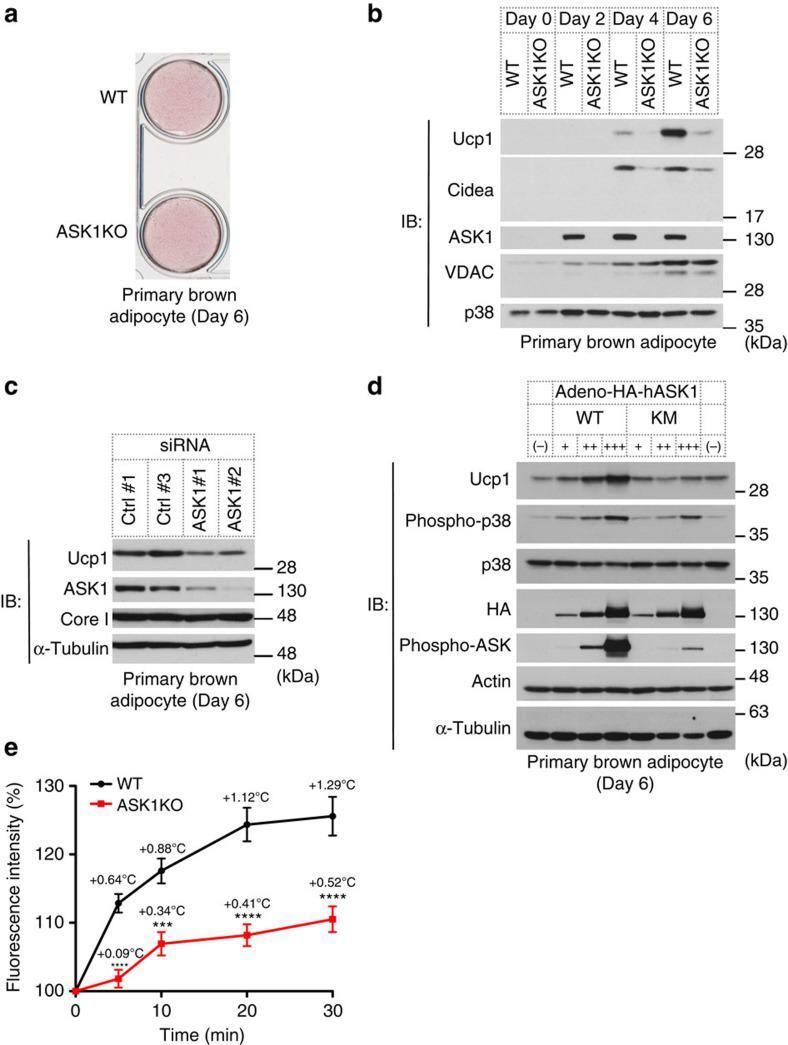
- Figure 2 ASK1 is involved in brown adipocyte-selective gene expression. ( a ) Oil red O staining of differentiated brown adipocytes (day 6). ( b ) Western blot against indicated genes in brown adipocytes. The same amount of protein was loaded in each lane. ( c ) Western blot against indicated genes in brown adipocytes (day 6). ( d ) Western blot analysis to detect Ucp1 expression in differentiated adipocytes (day 6) in which WT or kinase-negative mutant (KM) ASK1 was overexpressed. ( e ) Intracellular thermometry using fluorescent nanogel thermometer ( n =11 (WT), n =22 (ASK1KO)). Estimated temperature change for each point is shown as an insert. *** P
- Submitted by
- Invitrogen Antibodies (provider)
- Main image
- Experimental details
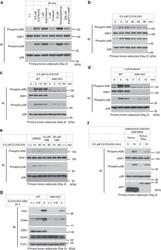
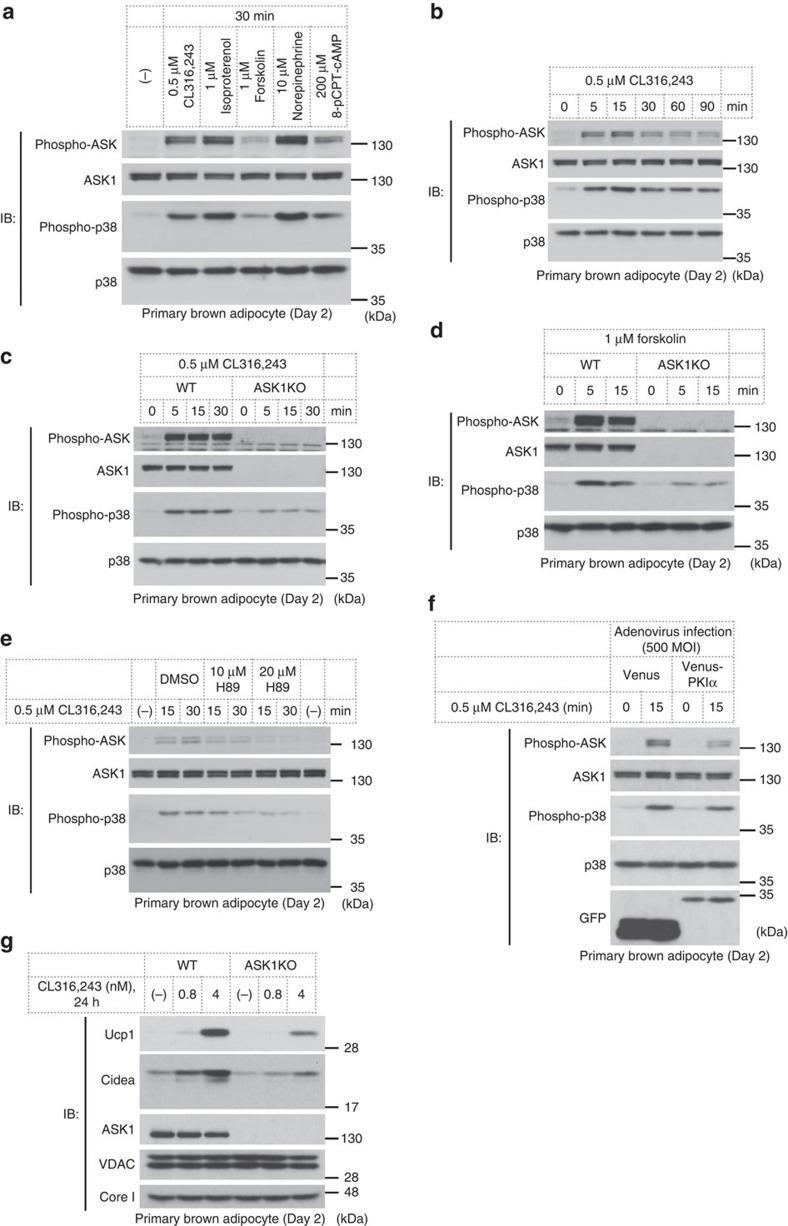
- Figure 3 cAMP signalling activates the ASK1-p38 axis and leads to Ucp1 expression. ( a ) ASK1 and p38 activation in response to cAMP signalling in immature brown adipocytes. ( b ) Temporal change of ASK1 and p38 activation status. ( c , d ) Effect of ASK1 deficiency on cAMP signalling-dependent p38 activation. ( e ) Effect of H89 treatment on CL316,243-induced activation of the ASK1-p38 pathway. Cells were pretreated with H89 for 30 min before addition of CL316,243. ( f ) Activation levels of ASK1 in PKIalpha-infected cells. Cells were infected with adenovirus on day -2 and day 0 with 500 MOI. ( g ) Ucp1 and Cidea induction in immature brown adipocytes.
- Submitted by
- Invitrogen Antibodies (provider)
- Main image

- Experimental details
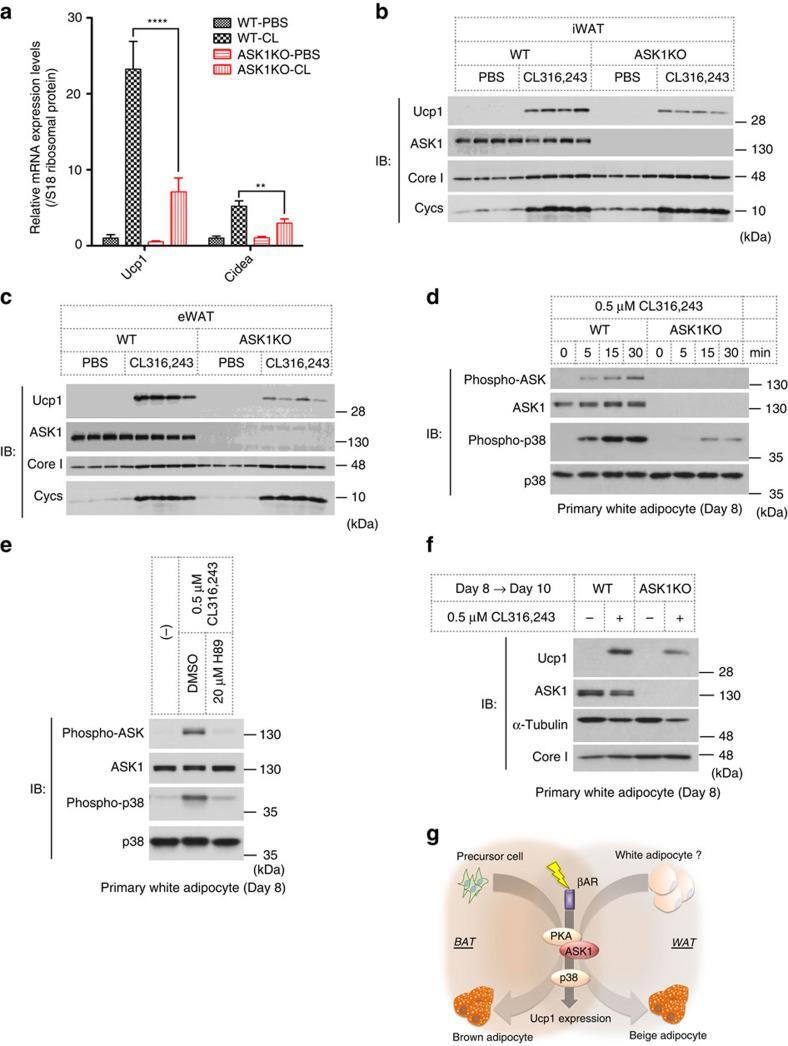
- Figure 5 ASK1 is involved in browning. ( a ) CL316,243 or PBS was injected once a day for 2 days, and iWAT was subjected to qRT-PCR analysis ( n =5). ** P
- Submitted by
- Invitrogen Antibodies (provider)
- Main image
- Experimental details
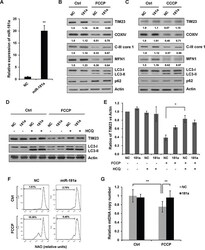
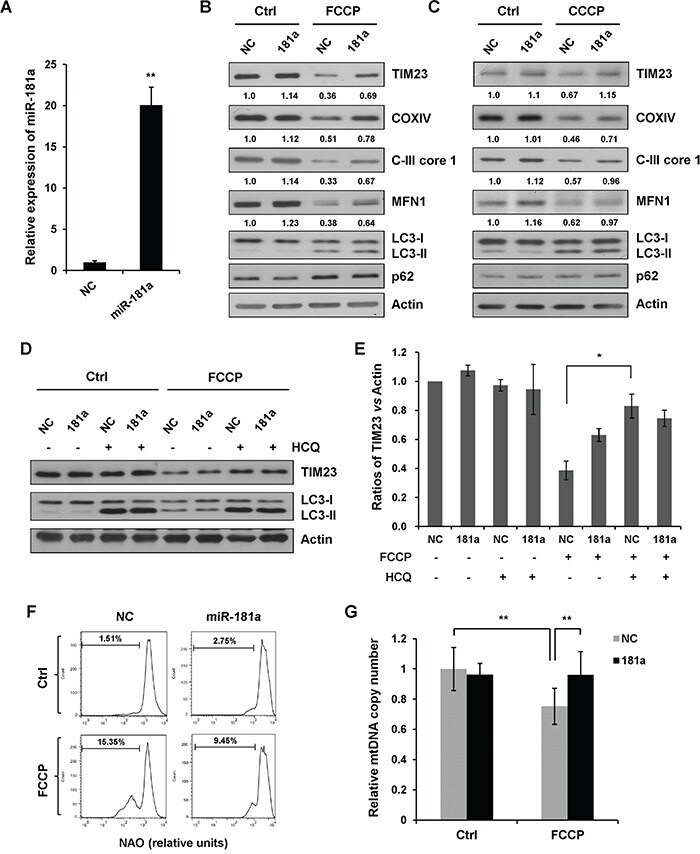
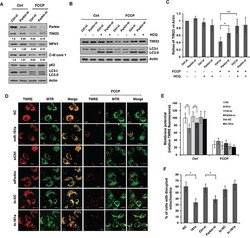
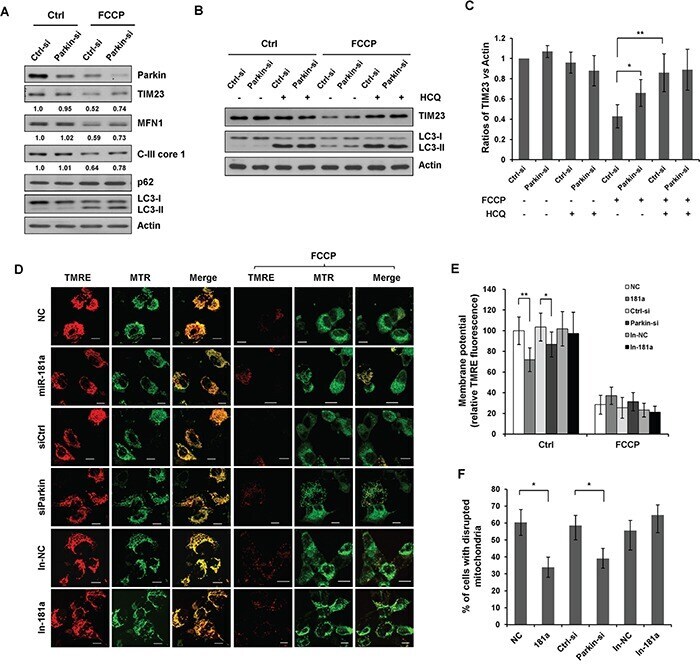
- Figure 2 miR-181a inhibits mitochondrial uncoupler-induced mitophagy A. The relative expression of miR-181a in SH-SY5Y cells transfected with miR-181a mimics or the negative control (NC). B. SH-SY5Y cells transfected with miR-181a or NC were treated with 10 muM FCCP or C. CCCP for 12 h. Samples were collected for western blot to analyze the expression of TIM23, COXIV, C-III core, MFN1, LC3, p62, and Actin. Densitometric ratios of mitochondrial marker proteins are quantified by Image J software. D. SH-SY5Y cells transfected with NC or miR-181a were exposed to FCCP (10 muM) and HCQ (20 muM) for 12 h. Western blot was performed to analyze the status of TIM23, LC3 and Actin. E. Image J densitometric analysis of the TIM23/Actin ratios from immunoblots is shown (data from three independent experiments, *p
- Submitted by
- Invitrogen Antibodies (provider)
- Main image

- Experimental details
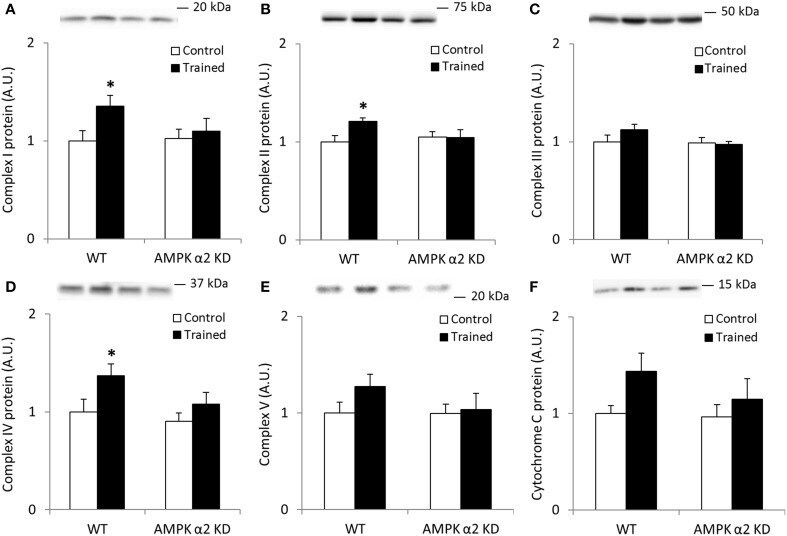
- Figure 1 Exercise training increase mitochondrial oxidative phosphorylation complexes in an AMPK alpha2-dependent manner . Protein levels of oxidative phosphorylation complexes, (A) Complex I, (B) Complex II, (C) Complex III, (D) Complex IV, (E) Complex V (oligomycin-sensitivity conferring protein subunit, OSCP), and (F) Cytochrome C were evaluated in quadriceps muscle of sedentary (control) or exercise trained female WT and AMPK alpha2 KD mice ( n = 13-15). Values are mean +- SEM. * indicates vs. WT control ( p < 0.05) analyzed by unpaired t -tests.
- Submitted by
- Invitrogen Antibodies (provider)
- Main image

- Experimental details
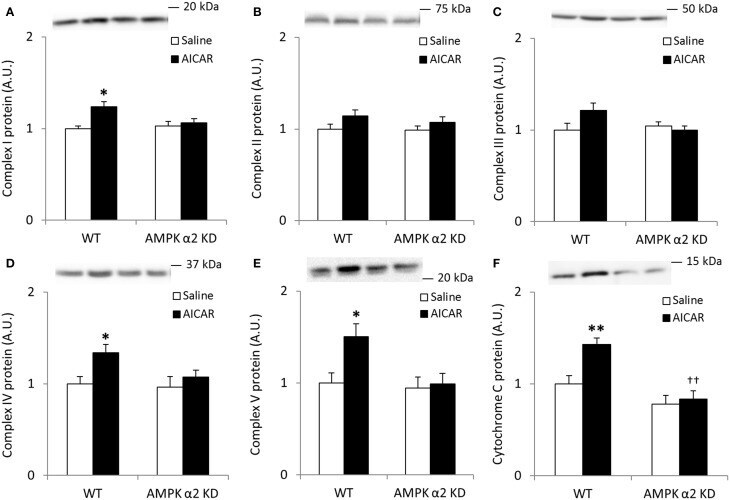
- Figure 4 Repeated treatment with AICAR increases abundance of mitochondrial electron transport chain proteins in an AMPK alpha2-dependent manner . WT and AMPK alpha2 KD male mice were given daily subcutaneous injections with AICAR (500 mg/kg body weight) or saline for 4 weeks. (A-E) Protein abundance of oxidative phosphorylation Complexes I-V and (F) Cytochrome C was measured in quadriceps muscle ( n = 7-8). A significant interaction effect (treatment x genotype; p < 0.05) was observed for Cytochrome C. Values are mean +- SEM. * indicates vs. WT saline ( p < 0.05) analyzed by t -tests, ** indicates vs. WT saline ( p < 0.01), and ++ indicates genotype effect within AICAR treated animals ( p < 0.01).
- Submitted by
- Invitrogen Antibodies (provider)
- Main image

- Experimental details
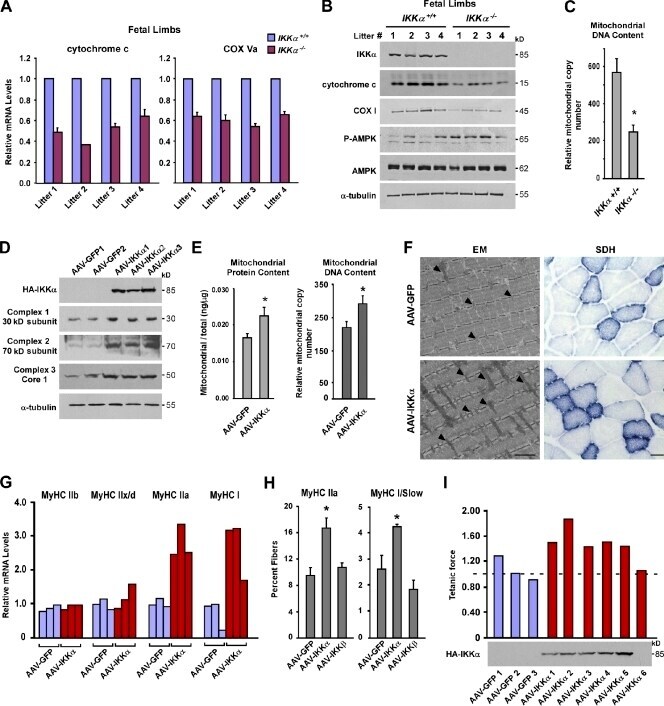
- Figure 1. IKKalpha regulates mitochondrial biogenesis and fiber type specification in vivo. (A) Hind limbs from four independent litters of IKKalpha +/+ and IKKalpha -/- embryos (total n = 8) were isolated at E20. Cytochrome c and COX Va were measured by real-time quantitative RT-PCR. (B) Additional tissues from E20 limbs from A were homogenized and probed by Western blotting. (C) Total DNA was extracted from E20 limbs, and real-time RT-PCR analysis was performed to quantitate mitochondrial and nuclear (GAPDH) genome copy number. Results are means of five mice per genotype and calculated as fold mitochondrial over genomic DNA. P = 0.004. (D) AAV-GFP and AAV-IKKalpha viruses were injected into the TA. Mice were sacrificed after 3-4 mo, and protein lysates were prepared and analyzed by Western blotting. Shown is a representative blot from five independent experiments. (E and F) After similar viral injections as described in D, mitochondria were fractionated, and protein concentrations or DNA content was determined and normalized to total protein/DNA content (E; n = 5 per group; P < 0.005) or TA muscles were analyzed by EM (F). Bar, 1 um. Parallel muscles were stained for SDH. Bar, 200 um. Arrowheads point to individual mitochondria. (G) TA muscles were isolated from AAV-GFP- and AAV-IKKalpha-injected mice ( n = 3 per group, repeated five times), and myosin isoforms were measured by real-time RT-PCR. The data shown are from a single representative experiment out of three replica
- Submitted by
- Invitrogen Antibodies (provider)
- Main image
- Experimental details
- Figure 6 Silencing endogenous Parkin inhibits mitophagy A. SH-SY5Y cells were transfected with control or Parkin siRNA for 36 h. Cells were treated with 10 muM FCCP for 12 h. Sample were collected for western blot to analyze the expression of TIM23, MFN1, Parkin, C-III core 1, p62, LC3 and Actin. B. SH-SY5Y cells transfected with control or Parkin siRNA were exposed to FCCP and HCQ for 12 h. Western blot was performed to analyze the status of TIM23, LC3 and Actin. C. Image J densitometric analysis of the TIM23/Actin ratios from immunoblots is shown (data from three independent experiments, *p
- Submitted by
- Invitrogen Antibodies (provider)
- Main image

- Experimental details
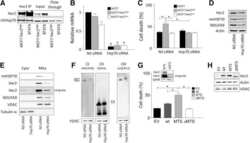
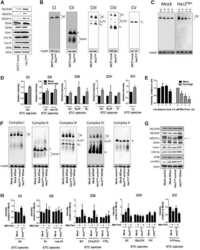
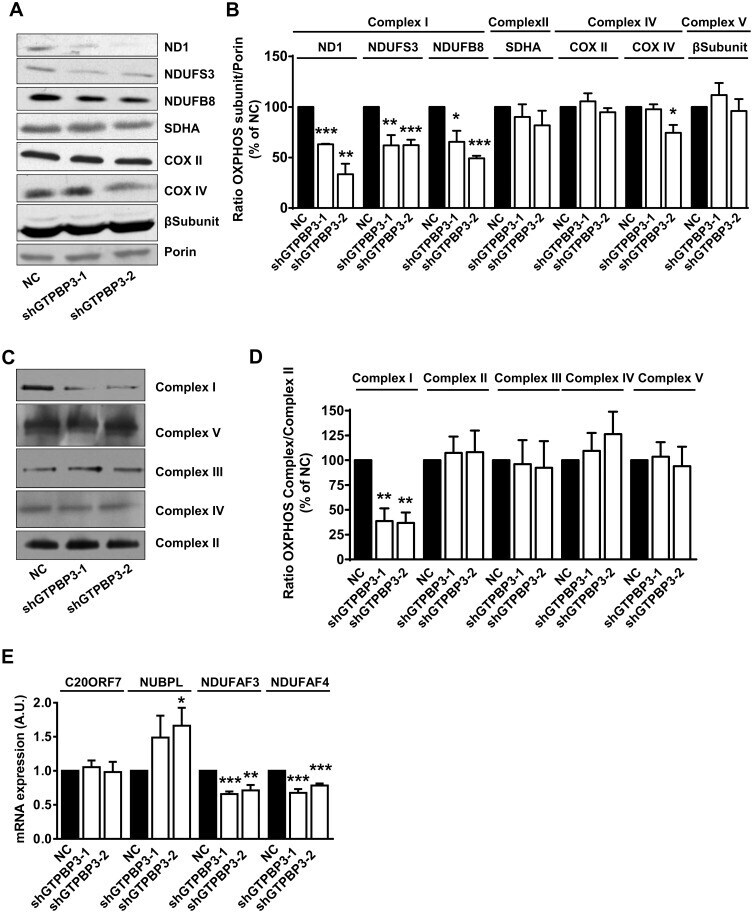
- Fig 7 Stable knock-down of GTPBP3 disturbs Complex I assembly and reduces the expression of Complex I assembly factors NDUFAF3 and NDUFAF4 (A) Western blot analysis of OXPHOS subunits ND1, NDUFS3 and NDUFB8 (Complex I), SDHA (Complex II), COXII and COXIV (Complex IV), and beta-subunit (Complex V) in shGTPBP3-1, shGTPBP3-2 and negative control (NC) cells. The filter was also probed with porin as a loading control. (B) Densitometric analysis of OXPHOS subunits normalized to porin and represented as % of NC. (C) Representative Blue Native-PAGE of OXPHOS complexes in shGTPBP3-1, shGTPBP3-2 and NC cells. (D) Densitometric analysis of OXPHOS Complexes normalized to Complex-II (loading control) and represented as % of NC. (E) qRT-PCR analysis of C20ORF7 , NUBPL , NDUFAF3 and NDUFAF4 mRNA expression in shGTPBP3 and NC cells. All data are the mean +- SEM of at least three independent biological replicates. Differences from NC values were found to be statistically significant at *p
- Submitted by
- Invitrogen Antibodies (provider)
- Main image
- Experimental details
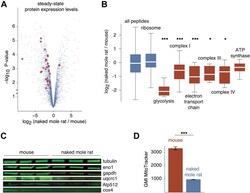
- Fig. 5 Proteome-wide differences in steady-state protein levels between mouse and naked mole rat cells. A , the volcano plot of the p -value versus log 2 ratio of expression levels in naked mole rat and mouse cells. Blue points represent all proteins, and red points highlight proteins involved in glycolysis and oxidative phosphorylation with significantly altered expression levels. B , distribution of log 2 expression level ratios for specified protein subsets. The box plot representations are as described in Figure 1 . Red boxes highlight GO terms involved in ATP production. *, and *** indicate p -values of less than 0.05, 0.005, and 0.0005, respectively, in comparison with the global distribution using the Mann-Whitney U test. C , western blots of selected proteins from respiratory chain complexes (Uqcrc1, Atp512, Cox4) and glycolysis (Eno1, Gapdh). D , measurements of geometric mean intensities of MitoTracker mitochondrial staining of naked mole rat and mouse cells. GO, gene ontology.

- Submitted by
- Invitrogen Antibodies (provider)
- Main image
- Experimental details
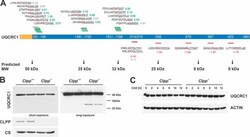
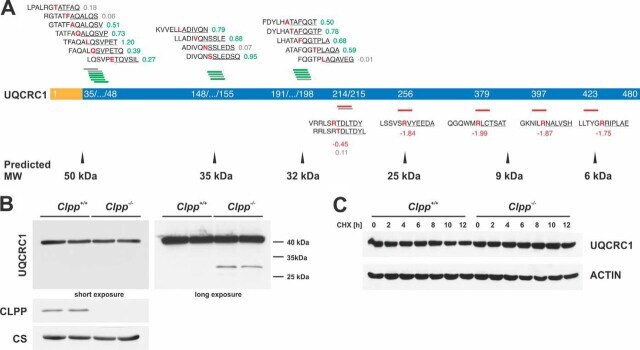
- Fig. 7 Validation of UQCRC1 as an unexpected ClpXP substrate. A , UQCRC1 N termini abundance. MTS (yellow) and mature protein (blue) are shown with starting position of detected N termini. Above and below the protein, identified N-terminal peptides (underlined) are shown with the associated log 2 ( Clpp -/- /wt) and the preceding sequence. Amino acids at the P1 position are highlighted in red. N termini with increased abundance are depicted in green, with decreased abundance in red and unchanged abundance in gray. Predicted masses of the corresponding proteoforms are indicated below the scheme. B , Western blots of UQCRC1 steady state levels in isolated mitochondria. Citrate synthase (CS) was used as loading control. C , CHX chase experiment of UQCRC1 in MEFs. ACTIN was used as loading control ().
- Submitted by
- Invitrogen Antibodies (provider)
- Main image
- Experimental details
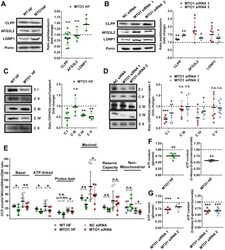
- Figure 2 MTO1 defective cells exhibit proteostasis stress and an altered bioenergetic state. (A and B) Representative immunoblots showing the expression of CLPP, AFG3L2 and LONP1 in extracts of WT and MTO1 HF ( A ), and in MTO1 siRNA 1-, MTO1 siRNA 2- and Negative Control (NC) siRNA-transfected 143B cells ( B ). Porin was used as a loading control. Full-length blots are included in supplementary information (Fig. S 19 ). The scatter plots show the densitometric measurements of the mitoproteases normalized to the loading control and represented as fold change relative to control cells. (C and D) Representative Blue Native-PAGE of OXPHOS complexes in WT and MTO1 HF ( C ), and in MTO1 siRNA 1-, MTO1 siRNA 2- and NC siRNA-transfected 143B cells ( D ). Full-length blots and lower-exposure blots of complex III are included in supplementary information (Fig. S 20 ). The scatter plots show the densitometric measurements of OXPHOS complexes normalized to complex-II (loading control) and represented as fold change relative to control cells. (E) Analysis of oxygen consumption rate (OCR) of intact cells using different OXPHOS inhibitors. OCR was measured in each cell type under basal conditions and after sequential addition of oligomycin, carbonyl cyanide-p-trifluoromethoxyphenylhydrazone (CCCP), rotenone and antimycin A. The scatter plot shows basal OCR (determined as the difference between OCR before oligomycin and OCR after rotenone/antimycin A), ATP-linked OCR (difference b
- Submitted by
- Invitrogen Antibodies (provider)
- Main image
- Experimental details
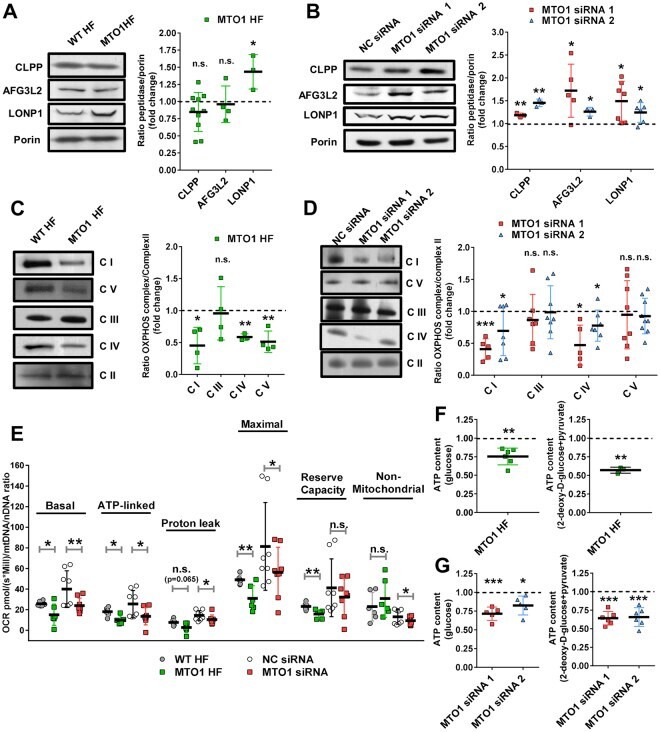
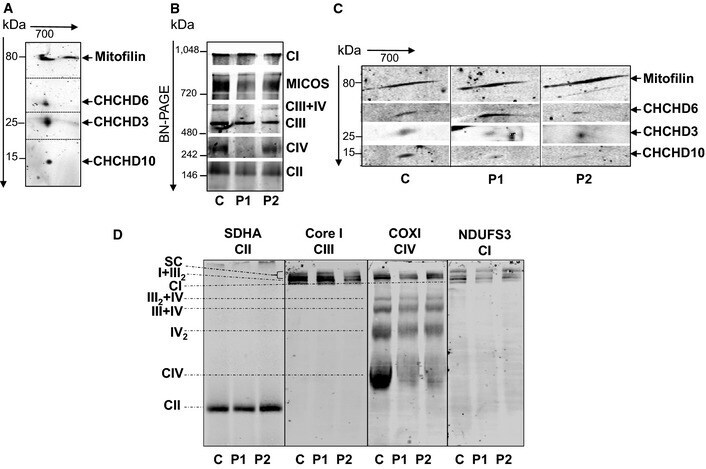
- Figure 1 CHCHD 10 resides in the same complex as mitofilin, CHCHD 3 and CHCHD 6 Second dimension of the blue native ( BN )- PAGE showing that CHCHD 10 migrates with the MICOS protein subunits mitofilin, CHCHD 3 and CHCHD 6 in isolated mitochondria from mouse brain. BN - PAGE of the MICOS and OXPHOS complexes in control (C) and patient (P1, P2) fibroblasts. Complexes I to IV of OXPHOS were detected with the 39 kDa subunit antibody ( CI ), 70 kDa subunit antibody ( CII ), core I antibody ( CIII ), and cytochrome c oxidase subunit I antibody ( CIV ). MICOS complex was detected with an anti-mitofilin antibody. Second dimension of the BN - PAGE showing that the steady-state levels of assembled CHCHD 10 in MICOS complex are decreased in patient fibroblasts. The dividing lines correspond to gel sections visible in the raw data file. Analysis of OXPHOS supercomplexes in control and patient fibroblasts. BN - PAGE from isolated mitochondria permeabilized with 6 g/g (w/v) of digitonin immunoblotted on PVDF membrane and incubated with the indicated antibodies. SC , supercomplexes I+ III 2 + IV n . The dividing lines correspond to gels sections visible in the raw data file. Source data are available online for this figure.
- Submitted by
- Invitrogen Antibodies (provider)
- Main image
- Experimental details
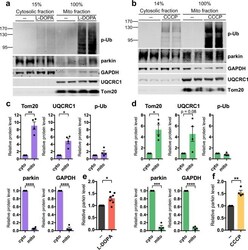
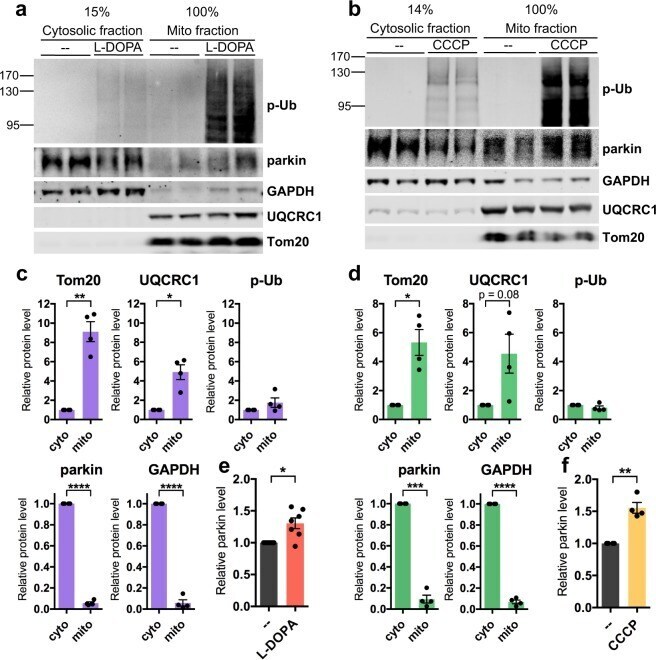
- Figure 6 Phospho-poly-Ub is present in both cytosolic and mitochondrial fractions and leads to mitochondrial parkin translocation. ( A - F ) PC12 cells were treated with 200 muM L-DOPA for 14-17 hours ( A , C , E ) or 10 muM CCCP for 6 hours ( B , D , F ) before being harvested for sub-cellular fractionation. 15% of the resulting cytosolic fractions and 100% of the mitochondria-enriched fractions were analyzed by Western immunoblotting for the indicated proteins. ( A , B ) Representative Western blots showing the distribution of phospho-ubiquitin, parkin, GAPDH, UQCRC1, and Tom20 between cytosolic and mitochondrial fractions. ( A - D ) Phospho-poly-ubiquitin is present both in the cytosol and on mitochondria after L-DOPA ( A , C ) and CCCP ( B , D ) treatment. The phospho-poly-ubiquitin signal in the cytosolic and mitochondrial fractions was normalized to the percentage of the fraction that was loaded to estimate the total level of phospho-poly-ubiquitin in each fraction. The same quantification was carried out for mitochondrial (Tom20, UQCRC1) and cytosolic (parkin, GAPDH) proteins from untreated cells to confirm that fractionation was successful. ( A , B , E , F ) Parkin protein translocates to mitochondria after L-DOPA ( A , E ) and CCCP ( B , F ) treatment. Parkin levels in the mitochondrial fraction with drug or control treatment were normalized to levels of UQCRC1 and plotted in ( E , F ). ( C - F ) Error bars show SEM from N = 4 ( C , D ), 7 ( E ), and 4 ( F ) independ
- Submitted by
- Invitrogen Antibodies (provider)
- Main image
- Experimental details
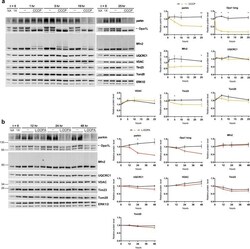
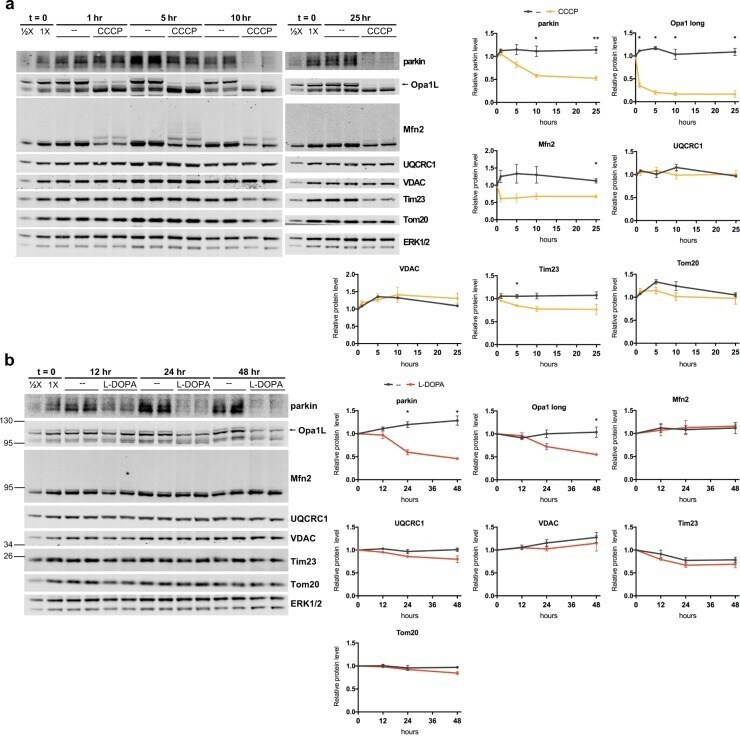
- Figure 9 Lack of robust mitophagy in the CCCP and L-DOPA models. ( A , B ) L-DOPA and CCCP do not induce changes in mitochondrial protein levels consistent with robust mitophagy. Differentiated PC12 cells were treated with 10 muM CCCP ( A ) or 200 muM L-DOPA ( B ) for the indicated times before harvest for WB. Representative blots and quantifications of the indicated proteins from N = 3 independent experiments are shown. ( A ) CCCP does not significantly decrease levels of UQCRC1, VDAC, or Tom20, while it does induce loss of parkin, Mfn2, Tim23, and Opa1-long. ( B ) L-DOPA does not significantly decrease levels of Mfn2, UQCRC1, VDAC, Tim23, or Tom20, while it does induce loss of parkin and Opa1-long. Error bars show SEM; *p
- Submitted by
- Invitrogen Antibodies (provider)
- Main image
- Experimental details
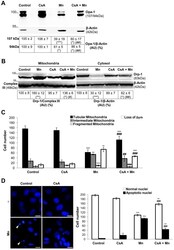
- Figure 6 CsA prevents Mn-induced Opa-1 cleavage and Drp-1 translocation to mitochondria. Opa-1 expression levels in total cell lysates. Anti-beta- Actin antibody was used as a loading control ( A ); Drp-1 expression levels in enriched-mitochondrial and cytosolic fractions. Membranes were stripped and reprobed for anti-Complex III subunit core 1- OxPhos (Complex III) I and anti-beta- Actin as loading control ( B ); CsA diminishes Mn-induced mitochondrial fragmentation, loss of Deltapsim and apoptotic nuclei appeareance. Quantification of mitochondria ( C ) and nuclei morphology ( D ) classified according to Figs. 4, 5. Scale bar: 10 um. Three independent experiments were conducted. Statistical significance, **p