Explore
 Validate
 Learn
Learn37-7000
antibody from Invitrogen Antibodies
Targeting: PLK1
PLK
 Western blot
 ELISA
ELISA Immunocytochemistry Immunoprecipitation Immunohistochemistry Flow cytometry Other assay
Antibody data
- Antibody Data
- Antigen structure
- References [17]
- Comments [0]
- Validations
- Immunocytochemistry [2]
- Immunohistochemistry [3]
- Flow cytometry [1]
- Other assay [11]
Submit
Validation data
Reference
Comment
Report error
- Product number
- 37-7000 - Provider product page

- Provider
- Invitrogen Antibodies
- Product name
- PLK1 Monoclonal Antibody (35-206)
- Antibody type
- Monoclonal
- Antigen
- Other
- Reactivity
- Human, Mouse, Rat
- Host
- Mouse
- Isotype
- IgG
- Antibody clone number
- 35-206
- Vial size
- 100 μg
- Concentration
- 0.5 mg/mL
- Storage
- -20°C
Submitted references Integrin-Mediated Adhesion Promotes Centrosome Separation in Early Mitosis.
Protocol to identify centrosome-associated transcription factors during mitosis in mammalian cell lines.
Methylation of PLK1 by SET7/9 ensures accurate kinetochore-microtubule dynamics.
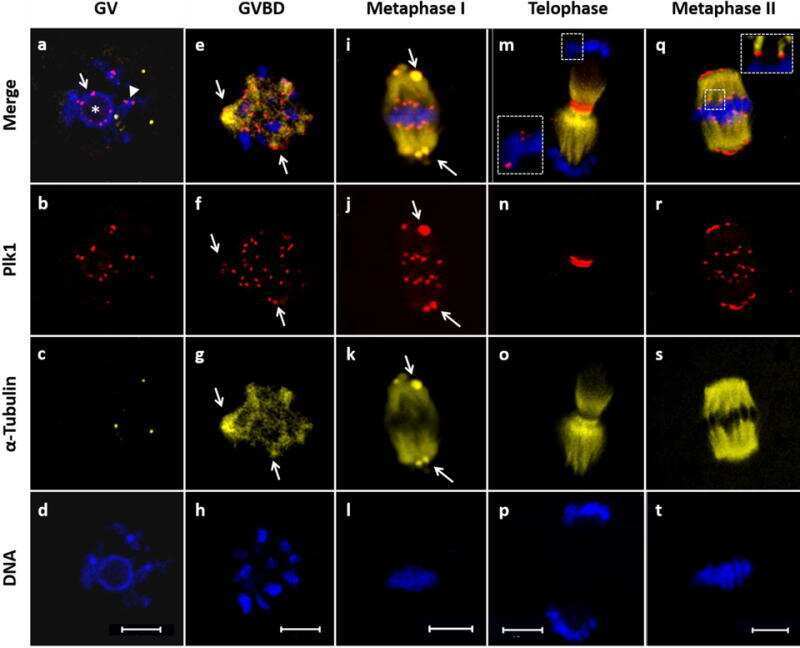
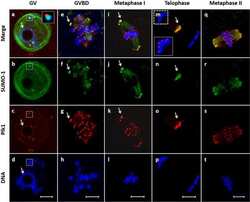
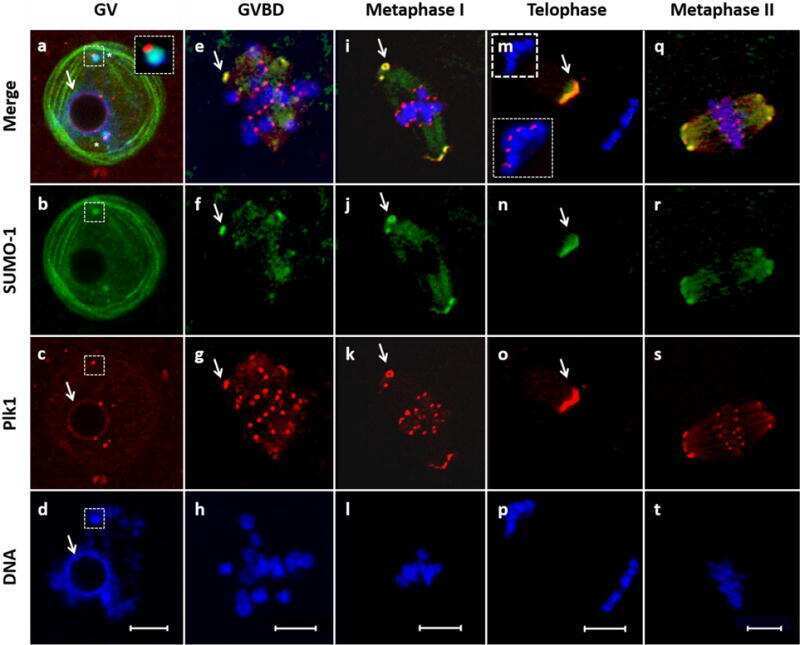
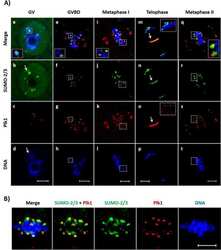
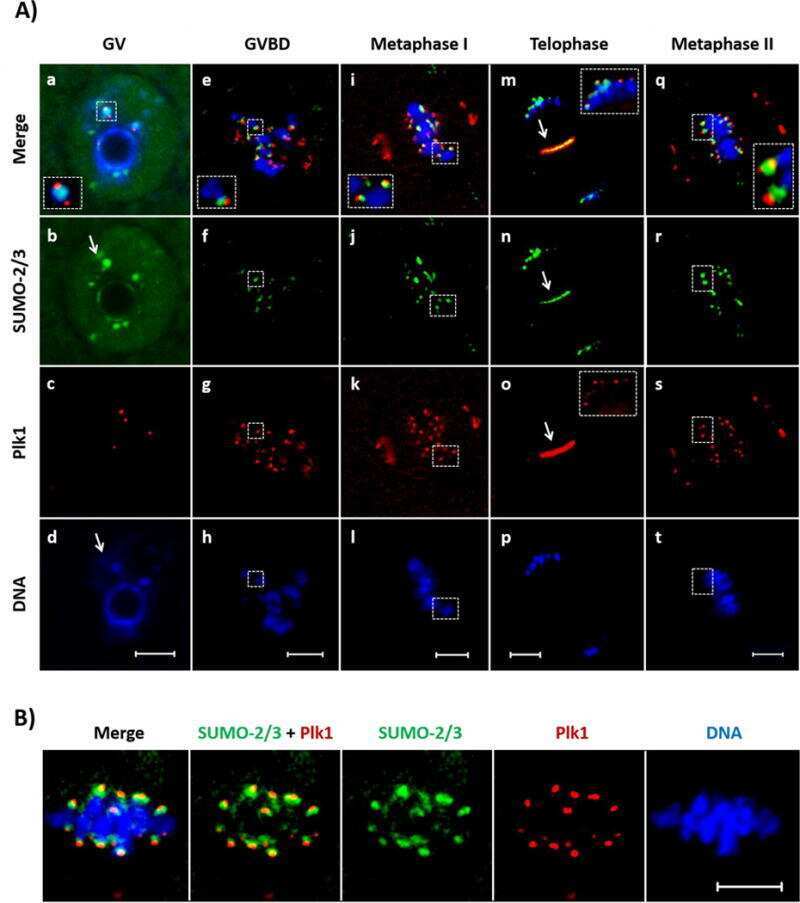
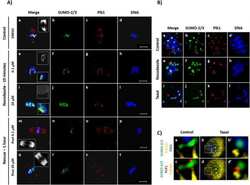
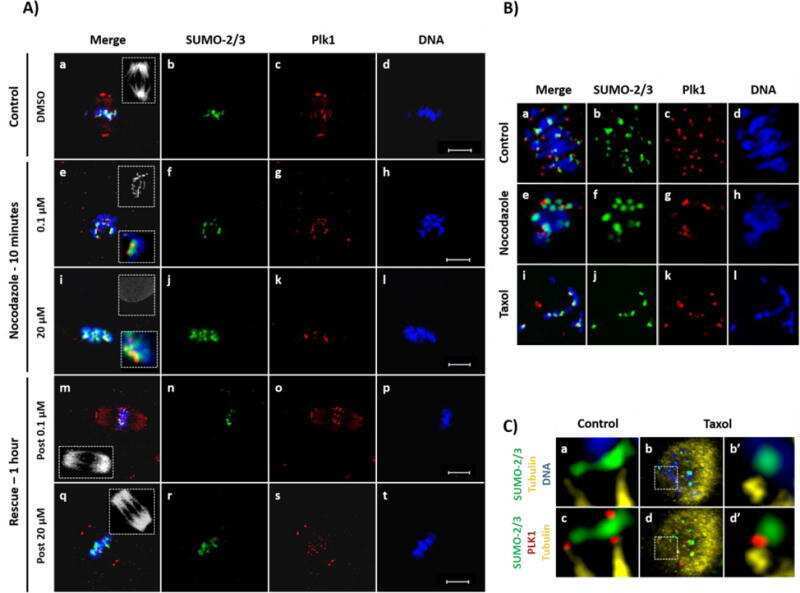
Temporal and SUMO-specific SUMOylation contribute to the dynamics of Polo-like kinase 1 (PLK1) and spindle integrity during mouse oocyte meiosis.
YPC-21661 and YPC-22026, novel small molecules, inhibit ZNF143 activity in vitro and in vivo.
A novel form of necrosis, TRIAD, occurs in human Huntington's disease.
Hypoxia-induced alterations of G2 checkpoint regulators.
Monitoring of changes in lipid profiles during PLK1 knockdown in cancer cells using DESI MS.
The hnRNP-Htt axis regulates necrotic cell death induced by transcriptional repression through impaired RNA splicing.
Wee1 is required to sustain ATR/Chk1 signaling upon replicative stress.
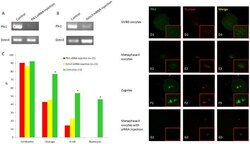
Aberrant expression of maternal Plk1 and Dctn3 results in the developmental failure of human in-vivo- and in-vitro-matured oocytes.
SAPK pathways and p53 cooperatively regulate PLK4 activity and centrosome integrity under stress.
Forced Expression of ZNF143 Restrains Cancer Cell Growth.
Proteomic profiling revealed the functional networks associated with mitotic catastrophe of HepG2 hepatoma cells induced by 6-bromine-5-hydroxy-4-methoxybenzaldehyde.
Three independent mechanisms for arrest in G2 after ionizing radiation.
Extensive crosstalk between O-GlcNAcylation and phosphorylation regulates cytokinesis.
Cdk1/Erk2- and Plk1-dependent phosphorylation of a centrosome protein, Cep55, is required for its recruitment to midbody and cytokinesis.
Kamranvar SA, Gupta DK, Wasberg A, Liu L, Roig J, Johansson S
Cells 2022 Apr 16;11(8)
Cells 2022 Apr 16;11(8)
Protocol to identify centrosome-associated transcription factors during mitosis in mammalian cell lines.
Xie G, Zhou Y, Du M, Wang Q, Yi J, Zhang XK
STAR protocols 2021 Sep 17;2(3):100495
STAR protocols 2021 Sep 17;2(3):100495
Methylation of PLK1 by SET7/9 ensures accurate kinetochore-microtubule dynamics.
Yu R, Wu H, Ismail H, Du S, Cao J, Wang J, Ward T, Yang F, Gui P, Ali M, Chu L, Mo F, Wang Q, Chu Y, Zang J, Zhao Y, Ye M, Fang G, Chen PR, Dou Z, Gao X, Wang W, Liu X, Yao X
Journal of molecular cell biology 2020 Jul 3;12(6):462-476
Journal of molecular cell biology 2020 Jul 3;12(6):462-476
Temporal and SUMO-specific SUMOylation contribute to the dynamics of Polo-like kinase 1 (PLK1) and spindle integrity during mouse oocyte meiosis.
Feitosa WB, Hwang K, Morris PL
Developmental biology 2018 Feb 15;434(2):278-291
Developmental biology 2018 Feb 15;434(2):278-291
YPC-21661 and YPC-22026, novel small molecules, inhibit ZNF143 activity in vitro and in vivo.
Haibara H, Yamazaki R, Nishiyama Y, Ono M, Kobayashi T, Hokkyo-Itagaki A, Nishisaka F, Nishiyama H, Kurita A, Matsuzaki T, Izumi H, Kohno K
Cancer science 2017 May;108(5):1042-1048
Cancer science 2017 May;108(5):1042-1048
A novel form of necrosis, TRIAD, occurs in human Huntington's disease.
Yamanishi E, Hasegawa K, Fujita K, Ichinose S, Yagishita S, Murata M, Tagawa K, Akashi T, Eishi Y, Okazawa H
Acta neuropathologica communications 2017 Mar 8;5(1):19
Acta neuropathologica communications 2017 Mar 8;5(1):19
Hypoxia-induced alterations of G2 checkpoint regulators.
Hasvold G, Lund-Andersen C, Lando M, Patzke S, Hauge S, Suo Z, Lyng H, Syljuåsen RG
Molecular oncology 2016 May;10(5):764-73
Molecular oncology 2016 May;10(5):764-73
Monitoring of changes in lipid profiles during PLK1 knockdown in cancer cells using DESI MS.
Jayashree B, Srimany A, Jayaraman S, Bhutra A, Janakiraman N, Chitipothu S, Krishnakumar S, Baddireddi LS, Elchuri S, Pradeep T
Analytical and bioanalytical chemistry 2016 Aug;408(20):5623-32
Analytical and bioanalytical chemistry 2016 Aug;408(20):5623-32
The hnRNP-Htt axis regulates necrotic cell death induced by transcriptional repression through impaired RNA splicing.
Mao Y, Tamura T, Yuki Y, Abe D, Tamada Y, Imoto S, Tanaka H, Homma H, Tagawa K, Miyano S, Okazawa H
Cell death & disease 2016 Apr 28;7(4):e2207
Cell death & disease 2016 Apr 28;7(4):e2207
Wee1 is required to sustain ATR/Chk1 signaling upon replicative stress.
Saini P, Li Y, Dobbelstein M
Oncotarget 2015 May 30;6(15):13072-87
Oncotarget 2015 May 30;6(15):13072-87
Aberrant expression of maternal Plk1 and Dctn3 results in the developmental failure of human in-vivo- and in-vitro-matured oocytes.
Fan Y, Zhao HC, Liu J, Tan T, Ding T, Li R, Zhao Y, Yan J, Sun X, Yu Y, Qiao J
Scientific reports 2015 Feb 3;5:8192
Scientific reports 2015 Feb 3;5:8192
SAPK pathways and p53 cooperatively regulate PLK4 activity and centrosome integrity under stress.
Nakamura T, Saito H, Takekawa M
Nature communications 2013;4:1775
Nature communications 2013;4:1775
Forced Expression of ZNF143 Restrains Cancer Cell Growth.
Izumi H, Yasuniwa Y, Akiyama M, Yamaguchi T, Kuma A, Kitamura N, Kohno K
Cancers 2011 Oct 19;3(4):3909-20
Cancers 2011 Oct 19;3(4):3909-20
Proteomic profiling revealed the functional networks associated with mitotic catastrophe of HepG2 hepatoma cells induced by 6-bromine-5-hydroxy-4-methoxybenzaldehyde.
Zhang B, Huang B, Guan H, Zhang SM, Xu QZ, He XP, Liu XD, Wang Y, Shang ZF, Zhou PK
Toxicology and applied pharmacology 2011 May 1;252(3):307-17
Toxicology and applied pharmacology 2011 May 1;252(3):307-17
Three independent mechanisms for arrest in G2 after ionizing radiation.
Landsverk KS, Patzke S, Rein ID, Stokke C, Lyng H, De Angelis PM, Stokke T
Cell cycle (Georgetown, Tex.) 2011 Mar 1;10(5):819-29
Cell cycle (Georgetown, Tex.) 2011 Mar 1;10(5):819-29
Extensive crosstalk between O-GlcNAcylation and phosphorylation regulates cytokinesis.
Wang Z, Udeshi ND, Slawson C, Compton PD, Sakabe K, Cheung WD, Shabanowitz J, Hunt DF, Hart GW
Science signaling 2010 Jan 12;3(104):ra2
Science signaling 2010 Jan 12;3(104):ra2
Cdk1/Erk2- and Plk1-dependent phosphorylation of a centrosome protein, Cep55, is required for its recruitment to midbody and cytokinesis.
Fabbro M, Zhou BB, Takahashi M, Sarcevic B, Lal P, Graham ME, Gabrielli BG, Robinson PJ, Nigg EA, Ono Y, Khanna KK
Developmental cell 2005 Oct;9(4):477-88
Developmental cell 2005 Oct;9(4):477-88
No comments: Submit comment
Supportive validation
- Submitted by
- Invitrogen Antibodies (provider)
- Main image
- Experimental details
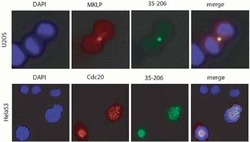
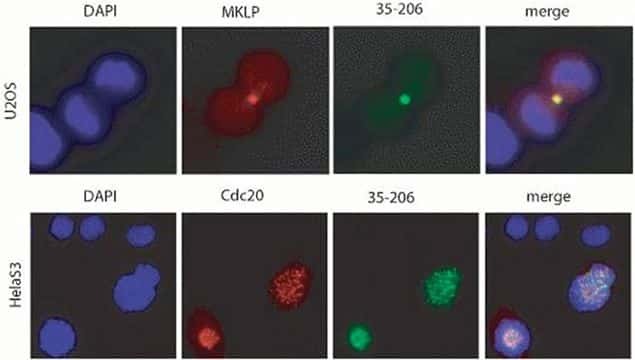
- Immunofluorescent staining of (top row) U2-OS cells, (bottom row) HeLa S3 cells using Ms anti PLK-1 (Product # 37-7000). Image courtesy of Dr. Erich Nigg, Max-Planck Institut fur Biochemie, Germany.
- Submitted by
- Invitrogen Antibodies (provider)
- Main image

- Experimental details
- Immunofluorescent staining of (top row) U2-OS cells, (bottom row) HeLa S3 cells using Ms anti PLK-1 (Product # 37-7000). Image courtesy of Dr. Erich Nigg, Max-Planck Institut fur Biochemie, Germany.

Supportive validation
- Submitted by
- Invitrogen Antibodies (provider)
- Main image
- Experimental details
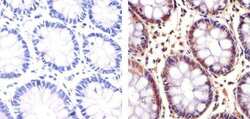
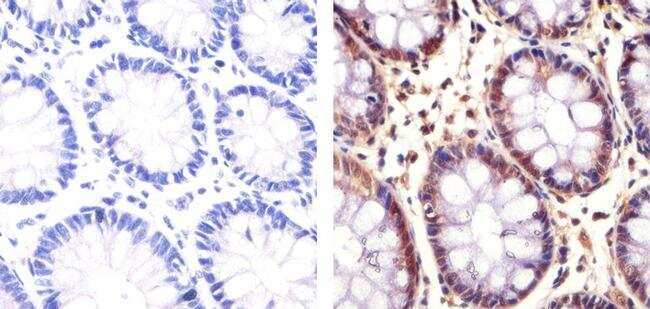
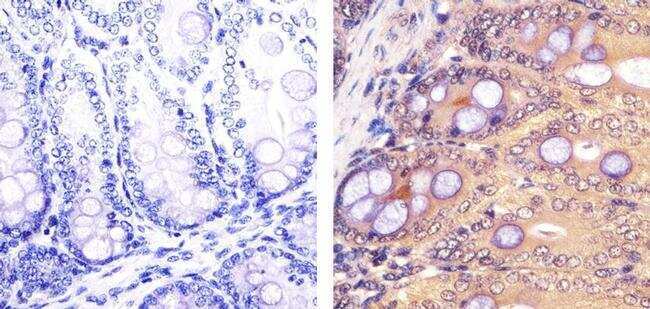
- Immunohistochemistry analysis of PLK1 showing staining in the cytoplasm and nucleus of paraffin-embedded human colon tissue (right) compared to a negative control without primary antibody (left). To expose target proteins, antigen retrieval was performed using 10mM sodium citrate (pH 6.0), microwaved for 8-15 min. Following antigen retrieval, tissues were blocked in 3% H2O2-methanol for 15 min at room temperature, washed with ddH2O and PBS, and then probed with a Anti- PLK1 Monoclonal Antibody (35-206) (Product # 37-7000) diluted in 3% BSA-PBS at a dilution of 1:100 overnight at 4°C in a humidified chamber. Tissues were washed extensively in PBST and detection was performed using an HRP-conjugated secondary antibody followed by colorimetric detection using a DAB kit. Tissues were counterstained with hematoxylin and dehydrated with ethanol and xylene to prep for mounting.
- Submitted by
- Invitrogen Antibodies (provider)
- Main image
- Experimental details
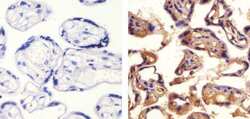
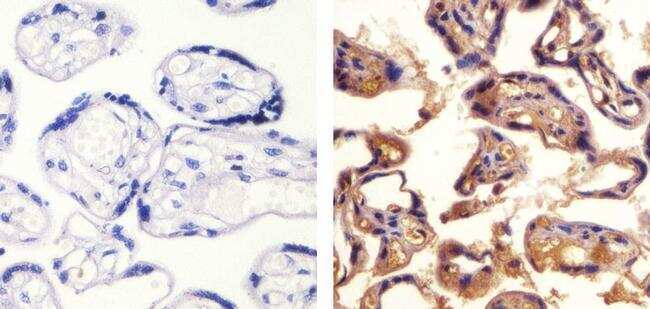
- Immunohistochemistry analysis of PLK1 showing staining in the cytoplasm and nucleus of paraffin-embedded human placenta tissue (right) compared to a negative control without primary antibody (left). To expose target proteins, antigen retrieval was performed using 10mM sodium citrate (pH 6.0), microwaved for 8-15 min. Following antigen retrieval, tissues were blocked in 3% H2O2-methanol for 15 min at room temperature, washed with ddH2O and PBS, and then probed with a Anti- PLK1 Monoclonal Antibody (35-206) (Product # 37-7000) diluted in 3% BSA-PBS at a dilution of 1:100 overnight at 4°C in a humidified chamber. Tissues were washed extensively in PBST and detection was performed using an HRP-conjugated secondary antibody followed by colorimetric detection using a DAB kit. Tissues were counterstained with hematoxylin and dehydrated with ethanol and xylene to prep for mounting.
- Submitted by
- Invitrogen Antibodies (provider)
- Main image
- Experimental details
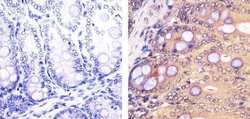
- Immunohistochemistry analysis of PLK1 showing staining in the cytoplasm and nucleus of paraffin-embedded mouse colon tissue (right) compared to a negative control without primary antibody (left). To expose target proteins, antigen retrieval was performed using 10mM sodium citrate (pH 6.0), microwaved for 8-15 min. Following antigen retrieval, tissues were blocked in 3% H2O2-methanol for 15 min at room temperature, washed with ddH2O and PBS, and then probed with a Anti- PLK1 Monoclonal Antibody (35-206) (Product # 37-7000) diluted in 3% BSA-PBS at a dilution of 1:100 overnight at 4°C in a humidified chamber. Tissues were washed extensively in PBST and detection was performed using an HRP-conjugated secondary antibody followed by colorimetric detection using a DAB kit. Tissues were counterstained with hematoxylin and dehydrated with ethanol and xylene to prep for mounting.
Supportive validation
- Submitted by
- Invitrogen Antibodies (provider)
- Main image
- Experimental details
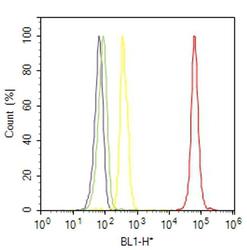
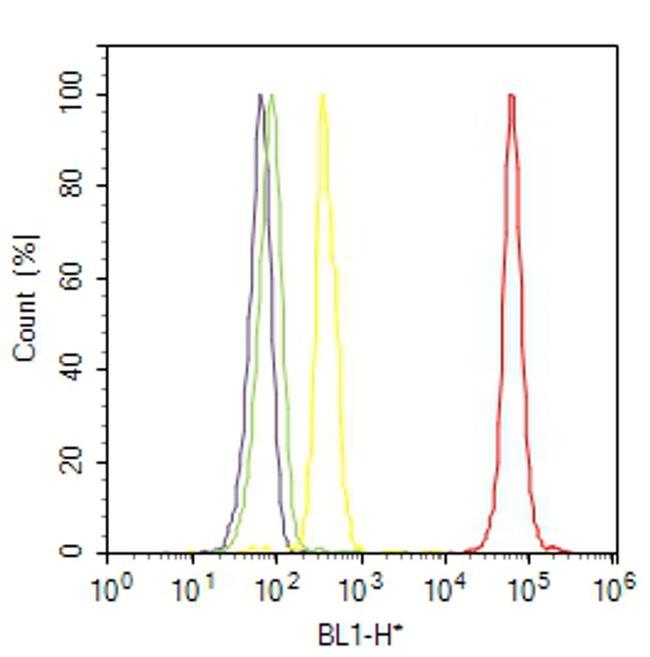
- Flow cytometry analysis of PLK1 was done on K-562 cells. Cells were fixed with 70% ethanol for 10 minutes, permeabilized with 0.25% Triton™ X-100 for 20 minutes, and blocked with 5% BSA for 30 minutes at room temperature. Cells were labeled with PLK1 Mouse Monoclonal Antibody (377000, red histogram) or with mouse isotype control (yellow histogram) at 3-5 ug/million cells in 2.5% BSA. After incubation at room temperature for 2 hours, the cells were labeled with Alexa Fluor® 488 Rabbit Anti-Mouse Secondary Antibody (A11059) at a dilution of 1:400 for 30 minutes at room temperature. The representative 10,000 cells were acquired and analyzed for each sample using an Attune® Acoustic Focusing Cytometer. The purple histogram represents unstained control cells and the green histogram represents no-primary-antibody control.
Supportive validation
- Submitted by
- Invitrogen Antibodies (provider)
- Main image
- Experimental details
- NULL
- Submitted by
- Invitrogen Antibodies (provider)
- Main image
- Experimental details
- NULL
- Submitted by
- Invitrogen Antibodies (provider)
- Main image
- Experimental details
- NULL
- Submitted by
- Invitrogen Antibodies (provider)
- Main image
- Experimental details
- NULL
- Submitted by
- Invitrogen Antibodies (provider)
- Main image
- Experimental details
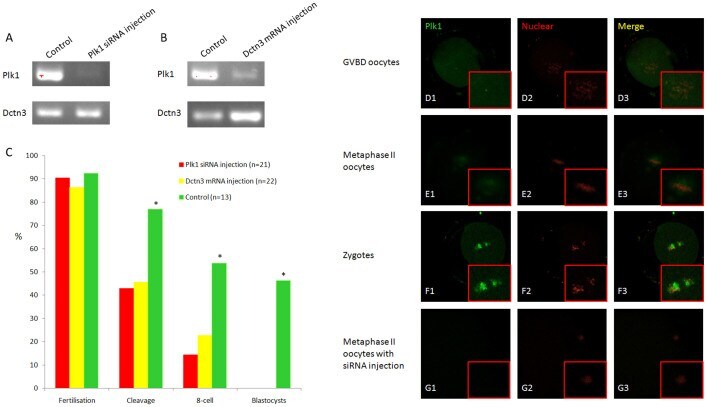
- Figure 7 Functional analyses of Plk1 and Dctn3 genes in IVO oocytes. (A) Plk1 siRNA induced the silence of Plk1 gene but not Dctn3 gene expression; (B) In vitro -transcribed mRNA injection induced overexpression of Dctn3 and also induced silencing of Plk1; (C) Fertilisation rate was not impaired by Plk1 siRNA injection or Dctn3 mRNA injection, but the efficiency of cleavage, 8-cell and blastocyst formation were decreased in both treatment groups. * indicates significant differences between oocytes and zygotes (P
- Submitted by
- Invitrogen Antibodies (provider)
- Main image

- Experimental details
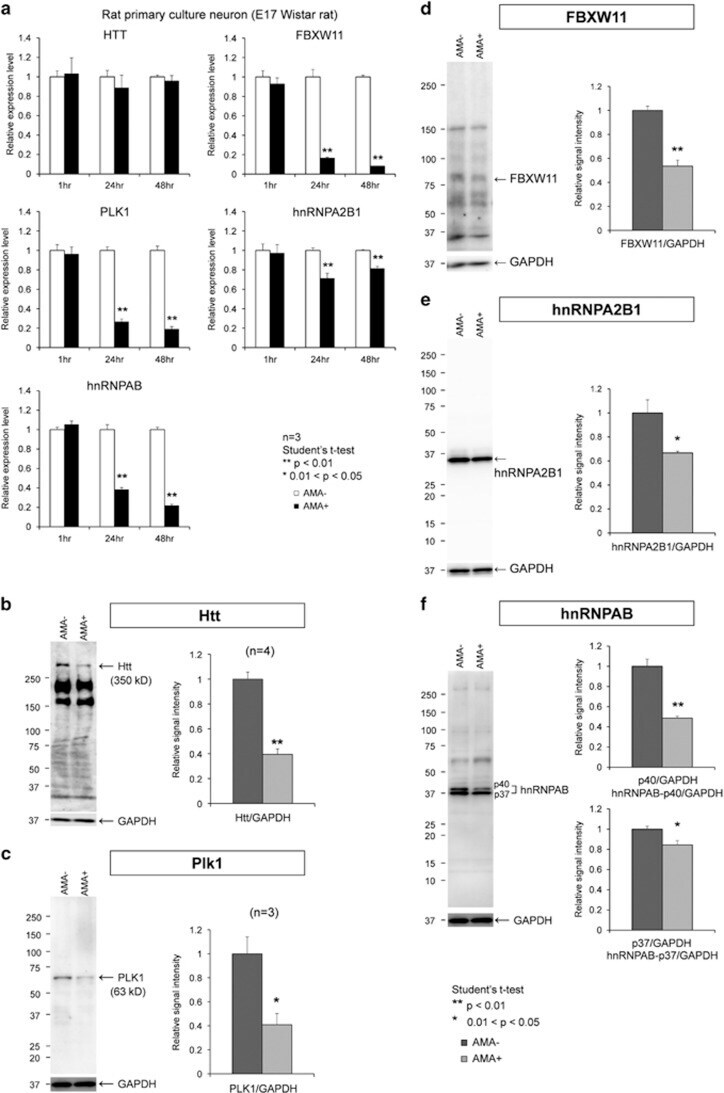
- Figure 4 Chronological changes of RNA and protein expression levels in rat cortical neurons during TRIAD. ( a ) Chronological changes of RNA expression levels of candidate key genes were evaluated by RT-qPCR from 1 to 47 h after addition of AMA to primary culture of rat cortical neurons. ( b ) Protein expression levels of rat Htt were evaluated by western blot before and 24 h after addition of AMA to primary culture of rat cortical neurons. Right graph shows quantitative analysis. ( c ) Protein expression levels of rat Plk1 were evaluated by western blot before and 24 h after addition of AMA to primary culture of rat cortical neurons. Right graph shows quantitative analysis. ( d ) Protein expression levels of rat FBXW11 were evaluated by western blot before and 24 h after addition of AMA to primary culture of rat cortical neurons. Right graph shows quantitative analysis. ( e ) Protein expression levels of rat hnRNPA2B1 were evaluated by western blot before and 24 h after addition of AMA to primary culture of rat cortical neurons. Right graph shows quantitative analysis. ( f ) Protein expression levels of rat hnRNPAB were evaluated by western blot before and 24 h after addition of AMA to primary culture of rat cortical neurons. Right graphs show quantitative analyses of two isoforms
- Submitted by
- Invitrogen Antibodies (provider)
- Main image
- Experimental details
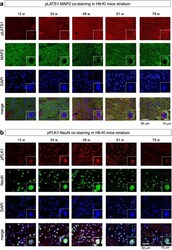
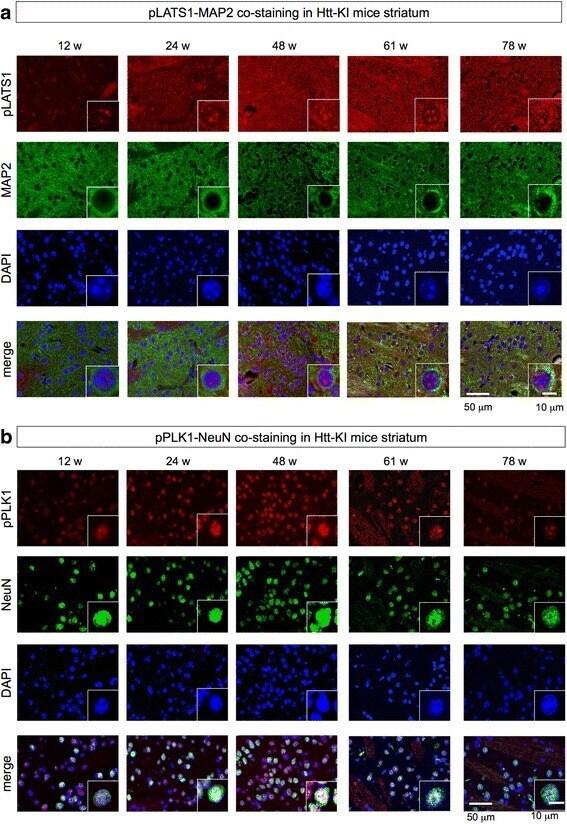
- Fig. 2 LATS1 and Plk1 are activated in striatal neurons of Htt-KI mice. a Double staining of LATS1 and MAP2 revealed LATS1 activation in neurons of mutant Htt-KI mice. LATS is expressed mainly in the nuclei rather than the cytoplasm of neurons. b Double staining of PLK1 and NeuN revealed transient actication in neurons of mutant Htt-KI mice. Plk1 is expressed in neurons
- Submitted by
- Invitrogen Antibodies (provider)
- Main image
- Experimental details
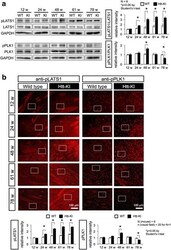
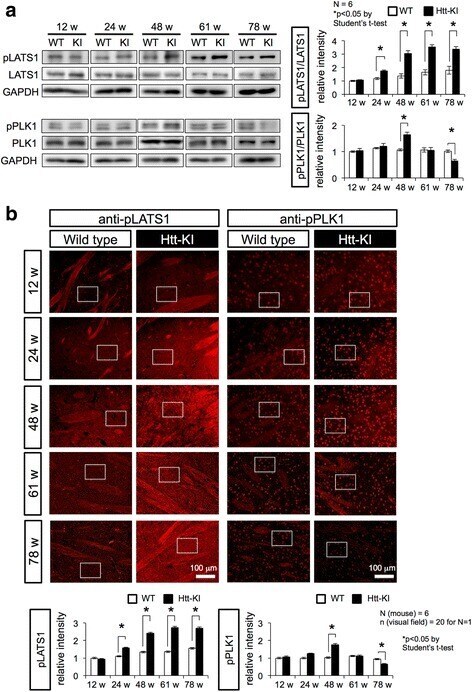
- Fig. 1 LATS1 and PLK1 are activated in Htt-KI mice. a Chronological analyses of LATS1, PLK1 and their phosphorylated forms by western blot with cerebral tissues including striatum from Htt-KI and their background mice (WT). The right graphs show the ratios of pLATS1/LATS1 and pPLK1/PLK1 in western blot analyses that are corrected by the value of WT at 12 weeks. b Immunostaining of striatal tissues from mutant Htt-KI (111Q) and their background mice with anti-phospho-LATS1 and anti-phospho-PLK1 antibodies. The lower graphs show relative intensities of immunostains in squared areas after subtraction with background stain signals. Mean value of signal intensity/area from twenty visual fields was used for N = 1. The bar graphs show mean + SEM. *: p < 0.05 in Student's t -test
- Submitted by
- Invitrogen Antibodies (provider)
- Main image
- Experimental details
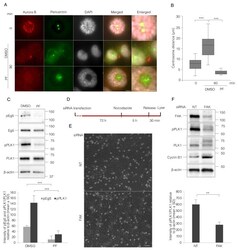
- Figure 4 FAK inhibition reduces PLK1 activity and thereby impairs centrosome separation. ( A ) Representative immunofluorescence pictures illustrating the separation of centrosomes and nuclear features in BJ cells at the time points of 0 min after nocodazole washout and 90 min after re-plating the cells on fibronectin with PF or DMSO added directly at the washout. The staining of Aurora B (red) shows its location at centromeres and the midbody at the early and late stages of mitosis, respectively, in the control cells. Scale bar, 5 mum. ( B ) Box plots showing the centrosomes distance (um) at 0 and 60 min after treatment as in ( A ). ( C ) Representative Western blot picture (upper) and quantification of the signal intensity of the bands (lower) of mitotic cells re-plated on fibronectin for 60 min in the presence of PF or DMSO. ( D ) Experimental design for siRNA treatment shown in ( E , F ). ( E ) Representative phase contrast images from the siRNA transfected cells 5 h after nocodazole treatment. Scale bar, 50 mum. ( F ) Western blot pictures (upper) and quantification of the signal intensity of pPLK1 bands relative to total PLK1 and beta-actin (lower) from the cells described in part ( D ). p -values less than 0.05, 0.01, 0.001, and 0.0001 were shown by two and three stars, respectively.

- Submitted by
- Invitrogen Antibodies (provider)
- Main image
- Experimental details
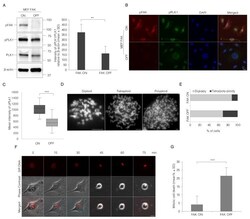
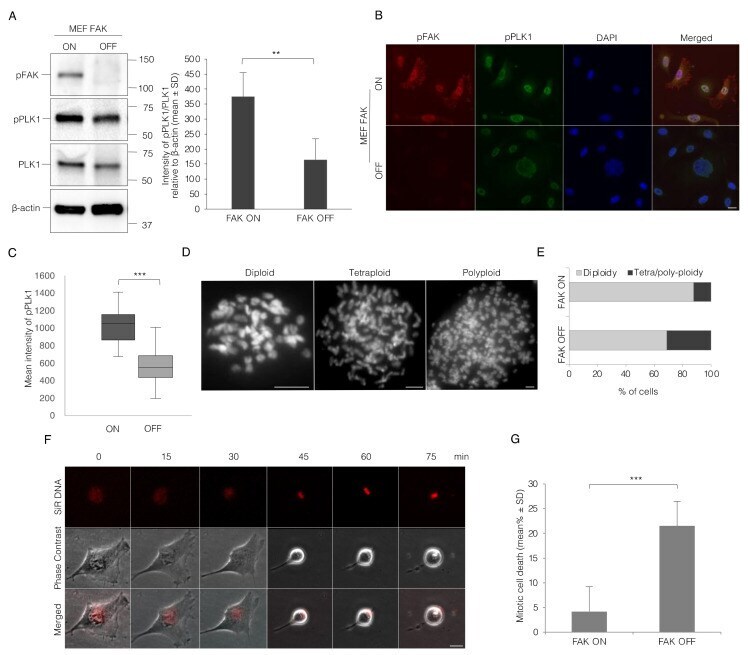
- Inhibition of FAK expression reduces the activity of PLK1 and causes frequent mitotic cell death and tetraploidy. ( A ) Representative Western blot pictures and quantification of the bands showing the difference in the level of pPLK1 relative to the total level of PLK1 and beta-actin, and pFAK in the mitotic Tet-FAK-ON and -OFF MEF cells re-plated on fibronectin for 60 min. ( B ). Decrease of pPLK1 in the cells lacking FAK expression after 72 h treatment with doxycycline and 5 h after release from the double thymidine block. Representative micrographs illustrating the pPLK1 (green) signals in Tet-FAK ON and OFF cells. Scale bar, 20 mum. ( C ) Box plots showing the average intensity of pPLK1 in 100 cell nuclei. ( D ) Representative pictures of Tet-FAK OFF cells with different ploidy. The chromosomes were stained by DAPI. Scale bar, 5 mum. ( E ) The % of mitotic cells having diploid or tetra/polyploid chromosome sets. A total of 500 chromosome plates were analyzed for each condition of FAK ON and OFF. ( F ) Snapshot images from a time-lapse movie displaying the mitotic progression of a single FAK OFF cell from the beginning of mitosis (0 min time point) to cell death at the later time point. The nucleus was labeled with SiR-DNA (red). Scale bar, 50 mum. ( G ) Mean (%) +- SD of the number of mitotic cells that die during the early mitotic progression after rounding up. p -values less than 0.05, 0.01, 0.001, and 0.0001 were shown by two and three stars, respectively.
- Submitted by
- Invitrogen Antibodies (provider)
- Main image
- Experimental details
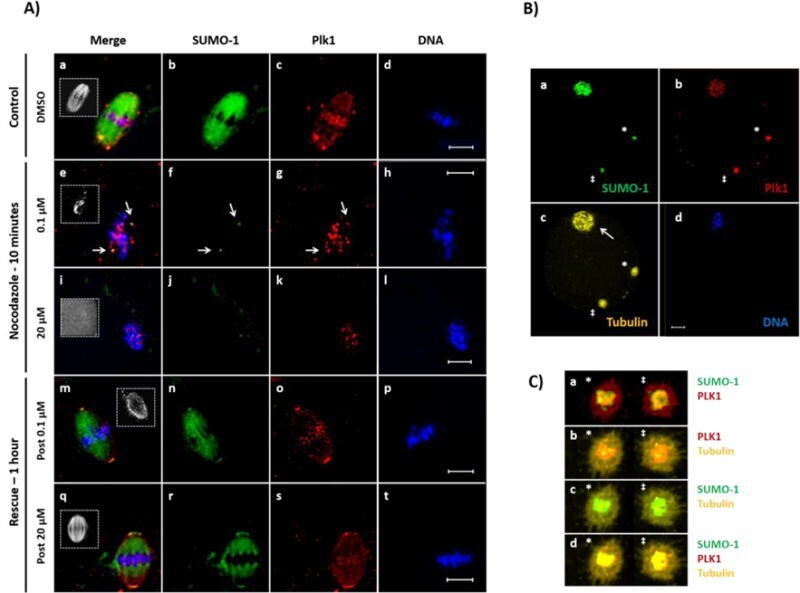
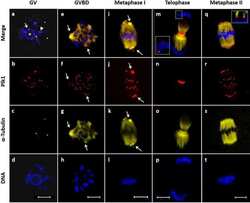
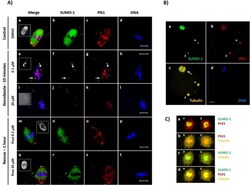
- Figure 6 SUMO-1-PLK1 localization depends on spindle integrity and is involved in MTOC organization MII oocytes matured in vivo were treated with microtubule-disturbing drugs followed by immunofluorescence bioimaging using confocal microscopy. DNA was detected using DAPI. (A) Mouse oocytes were cultured with Nocodazole (0.1 or 20muM; 10min), or without (DMSO-matched vehicle controls). Nocodazole-treated or vehicle-matched control MII oocytes were either processed immediately for immuno-bioimaging or rinsed and cultured for an additional 1h to allow microtubule re-assembly (rescue). Oocytes were immunostained using rabbit anti-SUMO-1 (b, f, j, n, r), mouse anti-PLK1 (c, g, k, o, s) and rat anti-alpha-tubulin (white boxes, a, e, i, m, q) antibodies; DNA (d, h, l, p, t). The merged image is shown (a, e, i, m, q); tubulin signals are not shown to better visualize SUMO-1 localization with PLK1. In vehicle-matched control oocytes, intact spindles are observed (box, a). PLK1 localizes at centromeres and is coincident with SUMO-1 at the spindle poles (a-d). Treatment with 0.1muM Nocodazole partially disassembled microtubules (box, e) and PLK1 localizes both at centromeres and coincident with SUMO-1 at the remaining spindle poles (arrows, e-g). Treatment with 20muM Nocodazole completely disorganized oocyte microtubules and no intact spindles are observed (see absence of any spindle structure, box, i). PLK1 remains at the centromeres but no longer coincident w